

ABSTRACT
Several methods have been proposed to test for introgression across genomes. One method identifies an excess of shared derived alleles between taxa using Patterson’s D statistic, but does not establish which loci show such an excess or whether the excess is due to introgression or ancestral population structure. Smith and Kronforst (2013) propose that, at loci identified as outliers for the D statistic, introgression is indicated by a reduction in absolute genetic divergence (dXY) between taxa with shared ancestry, whereas ancestral structure produces no reduction in dXY at these loci. Here, we use simulations and Heliconius butterfly data to investigate the behavior of D when applied to small genomic regions. We find that D imperfectly identifies loci with shared ancestry in many scenarios due to a bias in regions with few segregating sites. A related statistic, f, is mostly robust to this bias but becomes less accurate as gene flow becomes more ancient. Although reduced dXY does indicate introgression when loci with shared ancestry can be accurately detected, both D and f systematically identify regions of lower dXY in the presence of both gene flow and ancestral structure, so detecting a reduction in dXY at D or f outliers is not sufficient to infer introgression. However, models including gene flow produced a larger reduction in dXY than models including ancestral structure in almost all cases, so this reduction may be suggestive, but not conclusive, evidence for introgression.
INTRODUCTION
Hybridization and gene flow between taxa play a major role in evolution, acting as a force against divergence, and as a potential source of adaptive novelty (Abbott et al. 2013). Consequently, identifying, quantifying and dating gene flow between species are important objectives in the era of population genomics. Although identifying gene flow between species has been a long-standing problem in population genetics, the issue has received considerable recent attention with the analysis of shared ancestry between Humans and Neanderthals (for example, Yang et al. 2012; Wall et al. 2013). Furthermore, with genomic data sets becoming available in a wide variety of other taxonomic groups, there is a need for reliable methods that are computationally tractable on large data sets.
A sensitive and widely used approach to test for gene flow is to fit coalescent models using maximum-likelihood or Bayesian methods (Pinho and Hey 2010). However, simulation and model fitting are computationally intensive tasks, and are not easily applied on a genomic scale. A simpler and more computationally efficient approach that is gaining in popularity is to test for an excess of shared derived variants using a four-taxon test (Kulathinal et al. 2009; Green et al. 2010; Durand et al. 2011). The test considers ancestral (‘A’) and derived (‘B’) alleles, and is based on the prediction that two particular SNP patterns, termed ‘ABBA’ and ‘BABA’ (Figure 1A), should be equally frequent under a scenario of incomplete lineage sorting without gene flow. An excess of ABBA patterns is indicative of gene flow between two of the taxa, and can be detected using Patterson’s D statistic (Green et al. 2010; Durand et al. 2011; see Material and Methods for details). However, an excess of shared derived variants can arise from processes other than recent introgression, in particular non-random mating in the ancestral population due to population structure (Eriksson and Manica 2012). It is therefore important to make use of additional means to distinguish between these alternative hypotheses.

A. The D and f statistics operate on four taxa featuring three related populations P1, P2, P3 rooted by an outgroup O and related by the background topology shown on the left and right in brown. Two biallelic SNP patterns are used to calculate D and f; the first with an ancestral allele in P1 and O and a derived allele in P2 and P3 (ABBA) and the second with an ancestral allele in P2 and O and a derived allele in P1 and P3 (BABA). This general design applies to the four particular Heliconius subspecies shown here, showing the convergent wing patterns of H. melpomene amaryllis and H. timareta thelxinoe. B. Number of sites with ABBA and BABA patterns per 100 bp across the Heliconius HmB locus for the subspecies shown in part A, estimated from allele frequencies using Equations 2 and 3 over 5 kb windows, moving in increments of 1 kb.
The D statistic was originally designed to be applied on a genome-wide or chromosome-wide scale, with block-jackknifing used to overcome the problem of non-independence between loci (Green et al. 2010). However, many researchers are interested in identifying particular genomic regions subject to gene flow, rather than simply estimating a genome-wide parameter. Theory predicts that the rate of gene flow should vary across the genome, both in the case of secondary contact after isolation (Barton and Gale 1993) as well as continuous gene flow during speciation (Wu 2001). Indeed, a maximum likelihood test for speciation with gene flow devised by Yang (2010) is based on detecting this underlying heterogeneity. The pattern of introgression across the genome may carry information about the selective forces at play and the genetic architecture of adaptive traits.
Several recent studies have attempted to characterize heterogeneity of introgression in more detail. Garrigan et al. (2012) used a likelihood ratio test to identify genomic windows that have been shared between Drosophila species. Models with and without gene flow were evaluated over 1 and 5 kb genomic windows. Windows showing a significantly better fit to the gene flow model were widely distributed across the autosomes, but scarce on the Z chromosome. Roux et al. (2013) used an ABC framework to fit models of single and variable introgression rates among loci in Ciona species. Their results indicated strong heterogeneity across the genome, and unidirectional introgression consistent with multiple incompatibilities between species. Rheindt et al. (2013) used ABBA-BABA statistics to map candidate loci for introgression in the flycatcher Zimmerius chrysops and attempted to link these loci to gene functions.
The Heliconius Genome Consortium (2012) used a sliding-window approach to investigate whether alleles that determine convergent wing patterns displayed an excess of shared variation between co-mimetic species of Heliconius butterflies (Figure 1B). This method compared the numbers of SNPs matching the ABBA and BABA patterns, for each 50 kb window across two wing patterning loci, the HmB locus, controlling red pattern elements, and the HmYb locus, controlling yellow pattern elements. In a comparison between H. melpomene amaryllis and H. timareta thelxinoe from Peru, the HmB locus displayed a strong excess of ABBA sites localized over a narrow region, suggesting introgression of the forewing red band pattern, with a smaller, narrower excess present at the HmYb locus (The Heliconius Genome Consortium 2012). A similar excess of shared derived alleles at the HmB locus was observed between a different pair of co-mimetic races from Ecuador with “rayed” patterns, H. melpomene aglaope and H. timareta florencia.
A companion paper by Pardo-Diaz et al. (2012) provided additional evidence that alleles at the HmB locus have been repeatedly shared among populations of H. melpomene and H. timareta. Analyzing a larger number of populations, these authors constructed phylogenetic trees using PCR amplicons distributed across the HmB locus. One amplicon displayed perfect clustering by wing pattern, suggesting that these pattern alleles each had a single mutational origin and were subsequently shared between multiple populations over a wide geographic area. The short branch lengths that separated populations with the same pattern were consistent with recent sharing rather than inheritance of ancient polymorphic variation. In addition, a signature of introgression was identified using an explicit test for elevated linkage disequilibrium between shared polymorphisms (Pardo-Diaz et al. 2012).
All of these data, in combination with a recent study that showed pervasive genome-wide evidence for gene flow between H. melpomene and H. timareta (Martin et al. 2013), strongly support the hypothesis of repeated introgression between these species, as it is difficult to envisage a scenario in which both species could have inherited both of these pattern alleles from their common ancestor. One possibility is that shared ancestral variation in wing patterns has been maintained through multiple speciation events by balancing selection, but this seems unlikely given the known positive frequency dependent selection on warning color (Mallet and Barton 1989).
Nevertheless, a formal test to rule out the ancestral structure hypothesis based on the SNP data used to identify a signal of shared ancestry is desirable, both to complement the existing case for introgression in Heliconius and as a general method for other taxa where many lines of evidence are not available. Smith and Kronforst (2013) recently applied a new test to distinguish between the hypotheses of ancestral structure and introgression between Heliconius species. They proposed that introgression between taxa should result in lower absolute genetic divergence at loci with an excess of shared alleles. In contrast, a reduction in divergence is not expected under incomplete sorting of ancestral variation. Loci with an excess of shared alleles were identified by dividing the region of interest (HmB locus, HmYb locus, or the whole genome) into 5 kb windows, calculating Patterson’s D statistic for each window, and partitioning the windows into outliers (the 10% of windows with the highest D values) and background (the remaining 90% of windows). The mean absolute genetic divergence (dXY) was then compared between the partitions and found to be significantly lower in outlier windows than in Background windows, consistent with recent introgression (Smith and Kronforst 2013).
This approach represents a novel application of the D statistic for the detection of introgressed loci, which may hold promise as a general method for similar genome-scale studies in other taxa. The robustness of the D statistic for detecting genome-wide excesses of shared derived alleles has been thoroughly explored (Green et al. 2010; Durand et al. 2011; Yang et al. 2012; Eaton and Ree 2013; Martin et al. 2013). However, it is not clear how reliably D can be used to find the location of individual loci with a history of shared ancestry. In the present study, we used simulations to evaluate the effectiveness of the D statistic, calculated for small genomic windows, as a means to (1) identify loci of shared ancestry and (2) differentiate between recent introgression and shared ancestral variation at these loci.
We first assessed the reliability of the D statistic in identifying regions of increased shared variation under a variety of phylogenetic scenarios. We also investigated the utility of an additional parameter, f, originally designed to estimate the proportion of the genome that has been shared (Green et al. 2010). Second, we reanalyzed Heliconius data to examine the performance of these statistics on empirical data. Third, we used our simulated datasets to test the proposal that recent gene flow can be distinguished from shared ancestral variation based on absolute divergence. Overall our results suggest that caution should be exercised when interpreting values of the D statistic for small windows. Using the f statistic in addition to D may offer a better means to identify introgressed loci. However, both methods introduce systematic biases, which may impede attempts to distinguish between recent introgression and ancestral structure at loci identified in this way.
RESULTS
Identifying windows of shared ancestry in simulated datasets
We compared two methods to identify sequence windows with a history of shared ancestry. The first used the magnitude of Patterson’s D statistic directly (Equation 1). The second used the f statistic as proposed here (Equation 6), but f outliers were only identified among those windows with positive D values (Figure 2). This combination of D and f was used since f only makes sense as a statistic where there is an excess of ABBA over BABA sites, rather than the reverse.

A. For each of 360 models, 10 000 windows were simulated, 9000 from a Background topology and 1000 from an Alternate topology. Four parameters varied between models; Bgt12, the split time between P1 and P2 in the Background topology, Bgt123, the split time between the merged P1 and P2 populations and the P3 population in the Background topology, Alt23, the split time between P2 and P3 in the Alternate topology and Alt123, the split time between the merged P2 and P3 populations and the P1 population in the Alternate topology. This figure shows one of 120 models simulating gene flow from P2 to P3 (not drawn to scale). B. Histogram of D values calculated per window. Colors show windows from Background topology (brown) and Alternate topology (green), as per part A. Filled bars represent windows where D ≥ 0. f is calculated for these windows only. The dashed black line separates the top 1000 D values (outliers) from the lower 9000 (non-outliers). 603 of 1000 Alternate windows are identified as outliers by D, so D has 60.3% accuracy in this case. C. Histogram of f values for windows with D ≥ 0. The dashed black line delineates the top 1000 f values (outliers). f identifies 855 of 1000 Alternate windows as outliers, so has 85.5% accuracy in this case.
To determine the accuracy of these approaches, we simulated datasets of 10 000 5 kb sequence windows using a combined model, in which 9000 windows were assigned the species topology (((P1,P2),P3),O) (Background), and the remaining 1000 (Alternate) windows were assigned a topology consistent with gene flow or ancestral structure ((P1,(P2,P3),O) (Figure 2). Four split times varied between models: Bgt12, the split time between P1 and P2 in the Background topology; Bgt123, the split time between the merged P1 and P2 populations and the P3 population in the Background topology; Alt23, the split time between P2 and P3 in the Alternate topology; and Alt123, the split time between the merged P2 and P3 populations and the P1 population in the Alternate topology. Varying these four parameters was sufficient to model gene flow from P2 to P3, gene flow from P3 to P2, or ancestral structure (Figure 3A, D and G; see Material and Methods for details). In total, 360 combined models were analyzed, each with a unique combination of the four split times (File S6).

A,D,G. The three types of models simulated with 9000 Background topologies (brown) and 1000 Alternate topologies (colored). To simulate gene flow from P2 to P3, Alt123 was set equal to Bgt12, Alt23 had to be more recent than this, and Bgt123 more ancient. To simulate gene flow from P3 to P2, Alt123 was set equal to Bgt123, Bgt12 had to be more recent than this, and Alt23 more recent than Bgt12. To simulate ancestral structure, Alt23 was set equal to Bgt123, Bgt12 had to be more recent than this, and Alt123 more ancient. B,C,E,F,H,I. The accuracy of D and f for each combination of Background and Alternate topologies. Accuracy was calculated as the percentage of the 1000 Alternate windows that were among the top 1000 D and f values. In this plot, only models with an oldest split time of 2 MYA are plotted, thus leaving only two independent variables: Alt23 (x-axis) and Bgt12 (shading). See Figures S1 and S2 for accuracy of all 360 models.
The accuracy of the two approaches in identifying the 1000 Alternate windows was strongly dependent on the particular combination of split times in the Background and Alternate trees (Figures S1, S2). Despite the complex interaction between the split times, several general trends were apparent. The true Alternate windows were more readily identified under gene flow scenarios compared to ancestral structure scenarios, and windows with a history of gene flow from P2 to P3 were less accurately identified than those with a history of gene flow from P3 to P2. In general, quantifying introgression using the f statistic was more reliable than the D statistic (Figures S1, S2, S3).
Accuracy was more dependent on the recent split times Alt23 and Bgt12 than the more ancient split times Bgt123 and Alt123. Among all the models in which the deepest split was 2 MYA (Figure 3), the most important parameter in determining accuracy was the timing of the P2-P3 split in the Alternate windows (Alt23). For gene flow models, this represents the date of gene flow. For ancestral structure models this represents the split time between P3 and the ancestor of P1 and P2 (Figure 3). In all three scenarios, accuracy improved as Alt23 became more recent, approaching 100% in models of very recent gene flow, where Alt23 = 0.2 MYA.
For gene flow models, accuracy also depended on the timing of the split between P1 and P2 in the Background trees (Bgt12), with more ancient splits tending to give better accuracy. However, using f to define outliers largely eliminated this effect. In ancestral structure models, using f improved accuracy more for models in which Bgt12 was more recent, but offered little improvement when Bgt12 was ancient. Finally, accuracy was generally lower in models simulating ancestral structure than those with gene flow, plateauing at about 80% in the best cases (Figures 3, S1, S2).
Overall, across the 360 simulated models, using f to quantify admixture provided equal or greater accuracy in identifying Alternate windows than using D alone (Figure S3). The small size of the windows analyzed played a major role in producing this trend. We repeated all the simulations using 10 and 20 kb windows, and found that the accuracy of the D statistic improved dramatically with increasing window size (mean improvement of 16% between 5 and 10 kb windows and 21% between 5 and 20 kb windows). However, f did not show a concordant improvement with increasing window size (Figure S4). Hence, at the 20 kb scale, quantifying introgression using f provided little improvement over the value of D alone, and actually decreased the accuracy for a handful of ancestral structure models (Figure S3). Nevertheless, it was clear from these simulations that, in many scenarios, there was a limit to the number of Alternate windows that could be identified, and this appeared to be due to an inherent property of the model, rather than a lack of data. This suggests there are a number of realistic evolutionary scenarios under which this genome scan approach would fail to identify all, or even a majority of, windows with a history of excess shared ancestry.
Identifying regions of shared ancestry around Heliconius wing pattern loci
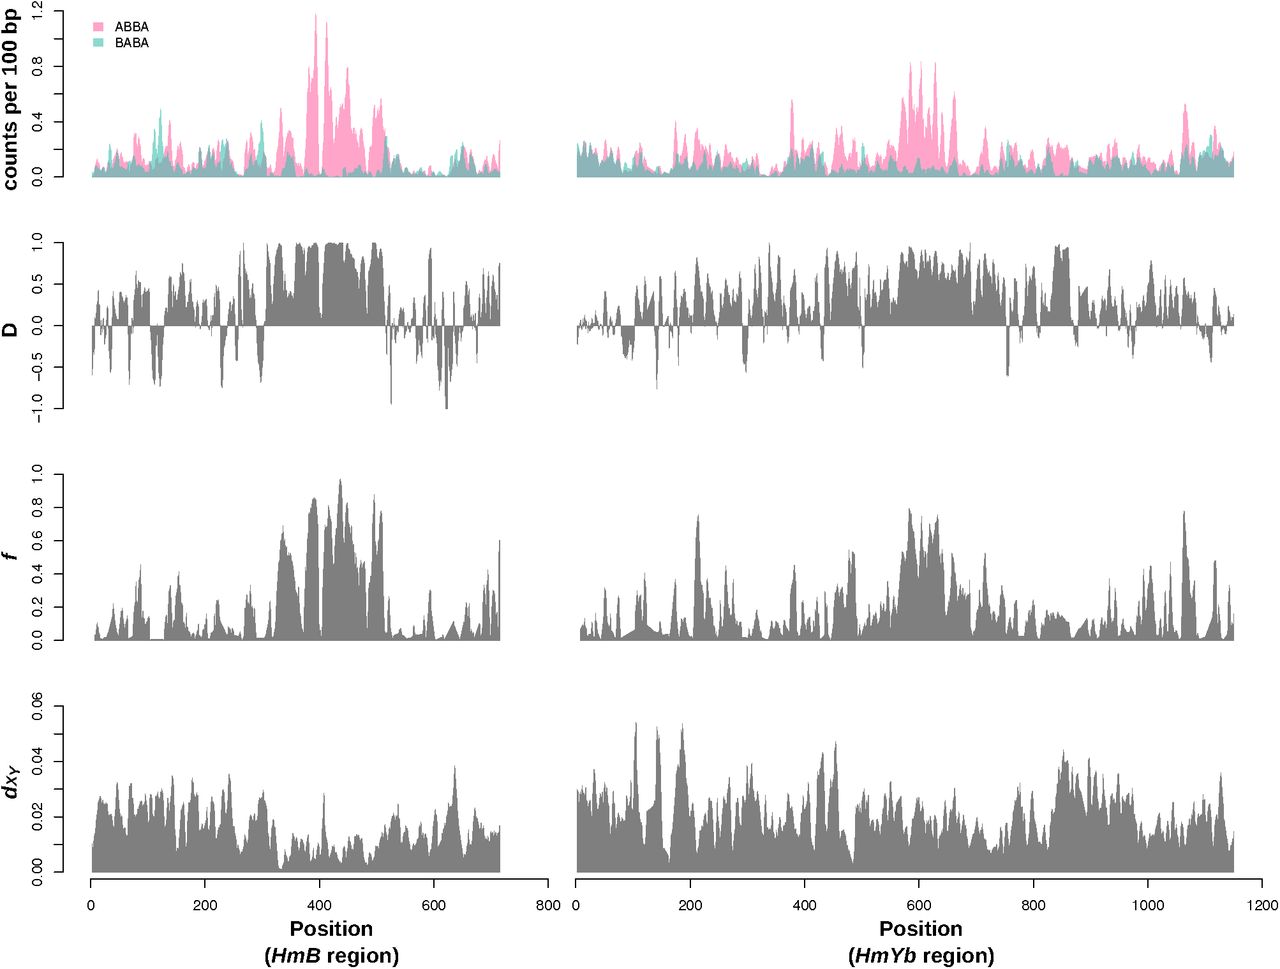
The performance of the D and f statistics on real data provided further insight into the patterns in the simulated data (Figure 4). We plotted the counts of ABBA and BABA sites as well as the D and f statistics in sliding windows across two Heliconius wing patterning loci HmB and HmYb, parts of which have been found to show strong evidence for introgression in previous studies (Heliconius Genome Consortium 2012, Pardo-Diaz et al. 2012). The narrow genomic regions identified by the Heliconius Genome Consortium (2012), using absolute counts of ABBA and BABA sites, were not accurately recovered by the D statistic alone, but show better correspondence with values of the f statistic, plotted for all regions where D ≥ 0. We hypothesized that this is due to the sensitivity of D to small numbers of segregating sites (sites that were variable across the analyzed taxa), as many regions where the D statistic approached 1 were windows in which the counts of both ABBAs and BABAs were very low. By contrast, most high peaks of f corresponded to regions containing large numbers of ABBA sites (Figure 4).

Counts of ABBA and BABA SNP patterns, D, f and dXY across the HmYb and HmB BAC sequences, as analyzed by The Heliconius Genome Consortium (2012) and Smith and Kronforst (2013). Counts of ABBA and BABA SNP patterns for the Heliconius populations shown in Figure 1A, were estimated from allele frequencies using Equations 2 and 3. All plotted values were calculated for 5 kb sliding windows to replicate the approach of Smith and Kronforst (2013), but in order to generate smooth plots, overlapping windows were used, moving in increments of 1 kb.
Effect of the number of segregating sites on D and f
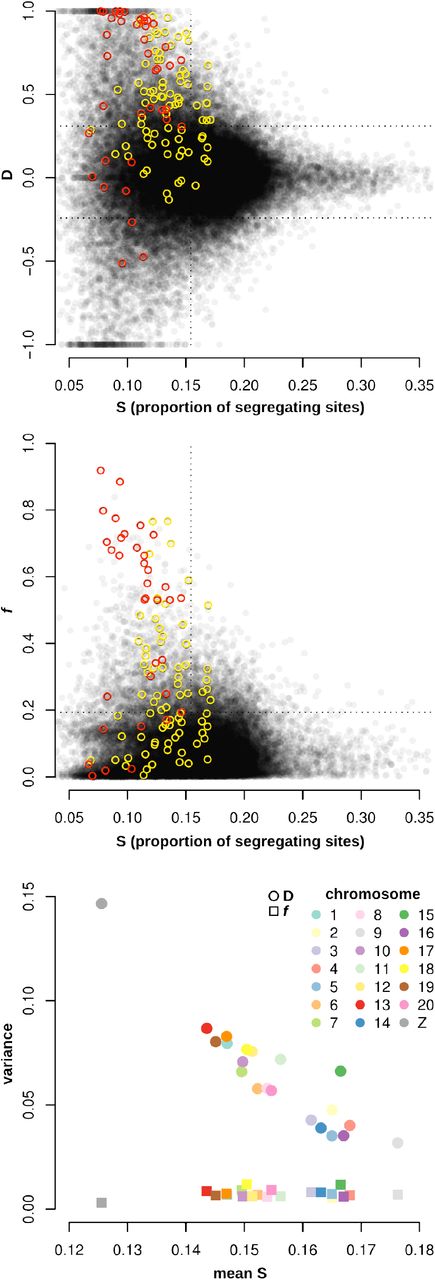
Analysis of published Heliconius whole genome data from the same taxa (Martin et al. 2013) confirmed that the variance in Patterson’s D statistic was strongly affected by the number of segregating sites per window (Figure 5). Of the extreme positive or negative D values (those above the 90th percentile or below the 10th percentile), the vast majority had a below average proportion of segregating sites (calculated as the number of variable sites across all taxa, divided by the total number of sites analyzed in each window; Figure 5A). In addition, the variance in D decreased as the proportion of segregating sites per window increased. Windows with extreme D values around the Heliconius wing pattering loci (see previous section) also had below-average proportions of segregating sites. While it is expected that the proportion of segregating sites would be reduced at introgressed loci with a history of strong selection, these findings suggest that a high D value alone is not sufficient evidence for introgression. Many of the D outlier loci result from noise in the signal due to low numbers of segregating sites.

A,B. Values of D and f for non-overlapping 5 kb windows across the genome, plotted against the proportion of segregating sites in each window. Segregating sites were only counted at positions that had genotype calls for at least 50% of the individuals. f values are only plotted for windows with D ≥ 0. Data from Martin et al. 2013, for the same taxa as in Figure 1A. C. The variance among D and f values for each chromosome, plotted against the mean proportion of segregating sites.
In contrast, when f was calculated for all windows with positive D, the values were not sensitive to the proportion of segregating sites per window (Figure 5B). The top 10% of f values were roughly evenly distributed around the mean proportion of segregating sites, and many of the most extreme f values corresponded to windows at the wing patterning loci, particularly the HmB locus.
D values were more variable in genomic regions with fewer segregating sites. The variance in D among 5 kb windows for each chromosome was strongly negatively correlated with the average proportion of segregating sites (Figure 5C). Chromosomes with a lower density of segregating sites, such as the Z chromosome, had higher variance among D values than chromosomes with larger proportions of segregating sites. By contrast, the variance in f, calculated for all windows with positive D, displayed no significant relationship to the mean proportion of segregating sites per chromosome. In summary, these data show that extreme D values, both positive and negative, occur disproportionately in genomic regions with fewer segregating sites, while f values are far less biased by underlying heterogeneity in genetic diversity.
Distinguishing between gene flow and ancestral structure scenarios
Smith and Kronforst proposed a novel method to discriminate between gene flow and ancestral structure as causes of an excess of shared derived alleles, by comparing absolute divergence (dXY) between outlier windows and the remaining non-outliers (Smith and Kronforst 2013; see Introduction). It makes intuitive sense that introgressed regions should show lower between-species divergence as compared to the rest of the genome, while shared ancestry due to ancestral structure would not lead to lower divergence. We confirmed this prediction by comparing dXY between Alternate and Background windows in our simulated datasets, under models including gene flow and ancestral structure. In models simulating gene flow, levels of dXY between the three populations for the Alternate and Background windows matched the predictions of Smith and Kronforst accurately, with dXY between P2 and P3 strongly reduced in Alternate windows relative to Background, a weaker reduction in the same direction in dXY between P1 and P3, and equal dXY between P1 and P2 for Alternate and Background windows (see Figure 6A, Simulation, for example). Similarly, models simulating ancestral structure matched the corresponding prediction, with Alternate windows showing no reduction in dXY between P2 and P3 as compare to Background, but an elevated dXY between both P1 and P3 and between P1 and P2.

A. An example gene flow model, with Bgt123=2, Bgt12=1.2, Alt123=1.2, Alt23=0.2. B. An example ancestral structure model, with Bgt123=1.4, Bgt12=0.2, Alt123=2, Alt23=1.4. ***=p < 0.001, #=p > 0.05 (Wilcoxon rank-sum test)
We then tested whether gene flow and ancestral structure could be distinguished where loci with shared ancestry are not known (as would be the situation with empirical data), but are instead inferred by selecting the top 10% of D or f values (outliers). We focus mainly on dXY between P2 and P3, the most important parameter in these predictions. As predicted, in all 240 models simulating gene flow, mean dXY between P2 and P3 was reduced in outlier windows as compared to non-outlier windows, whether outliers were defined by D or f (Figure 7). This reduction was significant for all gene flow models (p < 2e-05 in all cases, 99% significance level with Bonferroni correction over 480 tests; see Figure 6A for example). However, mean P2 − P3 dXY was also significantly reduced in D and f outliers in all 120 models simulating ancestral structure (p < 4e-05 in all cases, 99% significance level with Bonferroni correction over 240 tests; Figure 6B, Figure 7). Since mean P2-P3 dXY was not reduced in Alternate windows derived from ancestral structure topologies, the reduction for D and f outliers must result from the fact that D and f do not accurately identify all Alternate windows in these cases. Thus, there is a systematic bias, with the D and f outliers showing a lower mean dXY between P2 and P3 than the non-outlier windows, regardless of whether gene flow was simulated. This finding is perhaps unsurprising, as D and f are both methods for identifying increased levels of shared ancestry between P2 and P3, and will find such loci whether they are due to real gene flow or stochastic variation in the coalescent process. Hence, among the Background windows, those that happen by chance to have lower dXY between P2 and P3, will also tend to have higher D and f.

Outlier windows defined by Alternate or Background topology (Simulation) or by outlying D and f values, as per Figure 6. Model types shown in color (ancestral structure, red; gene flow from P2 to P3, green; gene flow from P2 to P3, blue).
It is therefore clear that, although a distinction could be made between simulated gene flow and ancestral structure scenarios by examining the Alternate and Background windows directly (Figure 7, Simulation), the lack of 100% accuracy in identifying alternate windows using D or f makes a simple test for a statistical difference in P2-P3 dXY meaningless. In our models, there is always a reduction in mean P2-P3 dXY in outliers compared to non-outliers, regardless of the underlying evolutionary scenario.
Nevertheless, there were clear differences in the magnitude of the decrease in P2-P3 dXY between outlier and non-outlier windows that could potentially be used to distinguish different evolutionary scenarios. Gene flow models almost always produced a larger reduction in P2-P3 dXY than ancestral structure models. For ancestral structure models, average P2-P3 dXY for f outlier windows was never less than 77% of that for non-outlier windows. By contrast, for gene flow models, mean P2-P3 dXY for outlier windows was on average 55% of that for non-outliers for models including gene flow from P2 to P3 and 50% for gene flow from P3 to P2, with a maximum value of 82% for either type of gene flow (Figure 7). 8 of the 240 gene flow models showed a relative reduction in P2-P3 dXY for f outliers that was within the range of that seen in ancestral structure models. These 8 models all included comparatively ancient gene flow (≥1 MYA) occurring very soon after the P1-P2 species split, meaning that incomplete lineage sorting probably obscured much of the signal. Nevertheless, it is unclear how appropriate general thresholds could be set to reliably distinguish the two scenarios, given that results will vary according to demographic histories.
Differences between predictions, simulated data and real data
There is a discrepancy between the predictions made by Smith and Kronforst (2013) for gene flow scenarios and the divergences that were observed in the genome-wide RAD sequence data set they analyzed. A significant reduction in dXY between P1 and P2 was observed for D outliers, even though such a reduction was not predicted under either gene flow or ancestral structure scenarios (see Figure 2C of Smith and Kronforst 2013). We did not observe such a pattern in any of our simulations based on neutral coalescent models (see Figure 6 for example) but we did observe a similar pattern for D outliers in our whole genome data for the same taxa (Figure S5). However, using f outliers eliminated this reduction in dXY between P1 and P2, thus recreating exactly the predictions of Smith and Kronforst for a case of recent gene flow (Figure S5), as confirmed by our simulations (Figure 6). This finding is consistent with both our simulation and empirical data above, showing that D outliers are more likely to occur in region of generally lower divergence between P1, P2 and P3, but that f is less affected by confounding factors, and more likely to identify truly introgressed loci.
DISCUSSION
With the advent of population genomics, studies of species divergence have moved from simply documenting inter-specific gene flow, towards the identification of specific genomic regions that show strong signals of either introgression or divergence (Garrigan et al. 2012; Staubach et al. 2012; Roux et al. 2013). This is a useful goal for many reasons. It can permit the identification of large-scale trends, such as chromosomal differences, and the fine-scale localization of putative targets of adaptive introgression for further characterization. There is therefore likely to be considerable interest in simple and easily computable statistics that can be used to identify loci with a history of introgression. We have shown that Patterson’s D does not accurately identify such loci when calculated over small genomic regions (10 kb or less). We propose that the f statistic, as applied here, provides a better means to identify putatively introgressed regions.
Previous studies have explored the behavior of D across the whole genome, where there are large numbers of variable sites (Green et al. 2010; Durand et al. 2011; Yang et al. 2012; Eaton and Ree 2013; Martin et al. 2013; Wall et al. 2013). These studies have shown that D is a robust method to test for admixture on a genome-wide scale. In particular, the non-independence between linked sites can be overcome by block-jackknifing. The main problem documented here therefore results from calculating D for small genomic regions with small numbers of segregating sites. This leads to highly variable estimates, and so outlying D values do not provide a reliable signal of shared ancestry.
The number of segregating sites can be influenced by many technical and biological factors. Here, a window size of 5 kb is simply too small for sufficient numbers of informative sites to be detected. However, biological factors such as directional selection and population bottlenecks can cause reductions in genetic diversity, thus reducing the number of segregating sites. These problems may be confounded if we are specifically interested in loci that experience strong selective pressures, which could increase the likelihood of detecting chance outliers at such loci.
Using the f statistic to quantify introgression for windows in which D is positive provides a more reliable method of detecting introgressed loci under a range of parameters. It is not biased by the number of segregating sites and can identify almost all loci derived from a recent gene flow event, provided the species split and the gene flow event are separated by a substantial period of time. Where f performs poorly, it is because the time of gene flow approaches the time of the species split, leading to large amounts of incomplete lineage sorting across the simulated windows, swamping the signal of gene flow. Therefore, the f statistic can be considered a reliable detector of meaningful differences in ancestry.
The most accurately identified models were those with recent gene flow from P3 to P2. This is unsurprising, because gene flow from P3 to P2 is more likely to generate ABBA patterns than gene flow in the opposite direction. Derived ‘B’ alleles are more likely to emerge on the longer branch leading to P3, than on the shorter branch separating P2 from P1. This reasoning is supported by the fact that the accuracy of the D statistic improves as the split between P1 and P2 gets older, increasing the length of the branch leading to P2. Using the f statistic largely circumvents this issue, as it accounts for the expected number of ABBA patterns under complete gene flow, thus controlling to some extent for the differences in relative branch lengths. An issue with f as it was originally implemented (Green et al. 2010, Durand et al. 2011) is that it assumes unidirectional gene flow from P3 to P2. If gene flow had in fact occurred in the opposite direction, or bidirectionally, this would tend to underestimate of the proportion of admixture, except in rare regions where derived alleles happen to be more common in P2 than P3, which would produce overestimates. Our modified implementation of the f statistic is also conservative, but it is protected from overestimates by allowing for bidirectional gene flow, and setting the ‘donor’ population at each site as the population with the highest frequency of the derived allele (see Methods for details).
The final goal of this study was to assess the method proposed by Smith and Kronforst to distinguish between recent gene flow and ancestral structure using absolute genetic divergence (dXY). Our simulations confirm that the intuitive predictions of this method are valid, as windows with simulated gene flow showed consistently lower dXY between P2 and P3 as compared to windows without gene flow, whereas windows with simulated ancestral structure did not. However, we also found that this test is not appropriate when using either the D or f statistic to identify outliers, as this adds a systematic bias. Outliers of D and f are over-represented in regions of lower than average dXY between P2 and P3, even in models without gene flow. It seems likely that in real genomes the bias in D will be even more extreme, as factors such as selective constraint and variable mutation rates produce significant variation in rates of divergence across the genome, which cannot be accurately recreated by neutral simulations.
Although the existence of a reduction in P2-P3 dXY is not sufficient evidence for gene flow, it may be that the size of the reduction does distinguish gene flow and ancestral structure. In our simulations, we found that models with gene flow consistently produced larger reductions in P2-P3 dXY in outlier windows than models with ancestral structure, except in a small number of cases where gene flow was relatively ancient and the differences between the Alternate and Background topologies was small. This observation is relevant to the case for adaptive introgression of Heliconius wing patterning alleles. The magnitude of the reduction in dXY between H. m. amaryllis and H. t. thelxinoe for D outlier windows at the HmB and HmYb loci (Smith and Kronforst 2013, Figures 2A and 2B) was greater than that observed in any of our simulated ancestral structure models. In contrast, many of our gene flow models produced reductions in dXY of a similar magnitude to that observed by Smith and Kronforst (2013). As we have simulated a wide range of scenarios, with divergence times and population sizes similar to those in Heliconius species, we believe that these patterns of divergence add support to the case for introgression in Heliconius, a case already supported by multiple lines of evidence.
In conclusion, while Patterson’s D statistic provides a robust signal of shared ancestry across the genome, it should not be used for naïve scans to ascribe shared ancestry to small genomic regions, due to its bias toward extreme values in regions containing few segregating sites. The f statistic is a more appropriate, but still imperfect, tool for the identification of loci with shared ancestry. Smith and Kronforst’s predictions for distinguishing gene flow and ancestral structure using absolute divergence are legitimate only when regions of shared ancestry can be accurately identified, but do not consistently hold for regions identified as D or f outliers, due to the biases of these statistics. Nevertheless, the size of the reduction in absolute divergence may be informative in distinguishing between gene flow and ancestral structure. We recommend that future analyses of this sort make use of simulations tailored to the taxa under study to determine appropriate threshold values, but it remains to be determined how generally applicable this approach may be.
MATERIAL AND METHODS
Statistics used to detect shared ancestry
In this study, we focused on an approach to identify an excess of shared derived polymorphisms, indicated by the relative abundance of two SNP patterns termed “ABBAs” and “BABAs” (Figure 1A; Green et al. 2010). Given three populations and an outgroup with the relationship (((P1, P2), P3), O), ABBAs are sites at which the derived allele “B” is shared between the non-sister taxa P2 and P3, while P1 carries the ancestral allele, as defined by the outgroup (Figure 1A). Similarly, BABAs are sites at which the derived allele is shared between P1 and P3, while P2 carries the ancestral allele. Under a neutral coalescent model, both patterns can only result from incomplete lineage sorting and should be equally abundant in the genome (Durand et al. 2011). A significant excess of ABBAs over BABAs is indicative either of gene flow between P2 and P3, or some form of non-random mating or structure in the population ancestral to P1, P2 and P3. This excess can be tested for, using Patterson’s D statistic,
 where CABBA(i) and CBABA(i) are counts of either 1 or 0, depending on whether or not the specified pattern (ABBA or BABA) is observed at site i in the genome. Under the null hypothesis of no gene flow and random mating in the ancestral population, D will approach zero, regardless of differences in effective population sizes (Durand et al. 2011). Hence, a D significantly greater than zero is indicative of a significant excess of shared derived alleles between P2 and P3.
If population samples are used, then rather than binary counts of fixed ABBA and BABA sites, the frequency of the derived allele at each site in each population can be used (Green et al. 2010, Durand et al. 2011), effectively weighting each segregating site according to its fit to the ABBA or BABA pattern, with

 where Pij is the frequency of the derived allele at site i in population j. These values are then used in equation 1 to calculate D (Durand et al. 2011).
Whereas Patterson’s D allows a test for an excess of shared derived alleles, a related statistic, f, was developed to quantify this excess in terms of the introgressed fraction of the genome (Green et al. 2010, Durand et al. 2011). This method makes use of the numerator of equation 1, the difference between sums of ABBAs and BABAs, or S. In the example described above, with ((P1,P2),P3),O); the proportion of the genome that has been shared between P2 and P3 subsequent to the split between P1 and P2, can be estimated by comparing the observed value of S to a value estimated under a scenario of complete sharing between P2 and P3. This would mean that P2 would now resemble a lineage of the P3 taxon, and so the denominator of equation 1 can be estimated by replacing P2 in equations 2 and 3 with a second lineage sampled from P3, or by splitting the P3 sample into two,
 where P3a and P3b are the two lineages sampled from P3. Splitting P3 in this way may lead to stochastic errors at individual sites, particularly with small sample sizes. These should be negligible when whole-genome data are analyzed but could easily lead to erroneous values of f (including f > 1) when small genomic windows are analyzed, as in the present study. We therefore used a more conservative version, in which P3 a and P3b are both substituted with the entire P3 sample:
 While this may generally underestimate the size of the shared fraction of the genome, it also reduces the rate of stochastic error. Moreover, in the present study, we are less concerned with the absolute value of f, and more with the relative values of f between genomic regions.
The f statistic assumes unidirectional gene flow from P3 to P2 (i.e. P3 is the donor and P2 is the recipient). Since the branch leading to P3 is longer than that leading to P2 (Figure 1), gene flow in the opposite direction (P2 to P3) is likely to generate fewer ABBAs. Thus, in the presence of gene flow from P2 to P3, or in both directions, the f equation should lead to an underestimate. However, when small genomic windows are analyzed, the assumption of unidirectional gene flow could lead to overestimates, because any region in which derived alleles are present in both P2 and P3, but happen to be at higher frequency in P2, will yield f estimates that are greater than 1. Thus, we propose a modified version of f in which the denominator is calculated by defining a donor population (PD) for each site, which can differ between sites and can be either P3 or P2. For each site, PD is the population that has the highest frequency of the derived allele, thus maximizing the denominator and eliminating f estimates greater than 1:
 All f estimates shown in the Results were calculated using Equation 6.
Finally, to estimate divergence between two populations we calculated Dxy, the mean number of differences between each pair of individuals sampled from the two populations. At sites with missing data were excluded in a pairwise manner, and each pair of individuals contributed equally to the mean.
Measuring the ability of the D and f statistics to identify shared regions using simulations
To determine how reliably the D and f statistics identify windows of shared ancestry, we generated a large range of sequence datasets using Hudson’s ms simulator (Hudson 2002) and Seq-Gen (Rambaut and Grass, 1996). Model parameters were selected to produce sequence alignments comparable to data analyzed in recent studies of Heliconius butterflies (The Heliconius Genome Consortium 2012, Smith and Kronforst 2013, Martin et al. 2013, Kronforst et al. 2013), but also generic enough to allow for broader interpretation. In all models, a constant effective population size (Ne) of 1×10⁶ was used, with a mutation rate of 2.5×10⁻⁹ and a generation time of 0.25 years. To approximate a scenario in which a subset of the genome has a distinct phylogenetic history, we used a combined model approach, in which 90% of windows had a standard species tree or background topology (((P1,P2),P3),O), and the remaining 10% of windows had an alternate topology ((P1,(P2,P3)),O), consistent with shared ancestry between P2 and P3 (Figure 3A, D, G). In all datasets, the roots of both the background and alternate trees were fixed to 3 MYA, while the other split times varied between datasets and ranged between 0.2 and 2 MYA (File S6). Only certain combinations of split times for the background and alternate trees were tested, restricting simulations to simple and biologically plausible scenarios. These combinations fall into three distinct categories: Gene flow from P2 to P3, gene flow from P3 to P2, and ancestral structure (Figure 3A, D, G). In total, 120 datasets in each category met the criteria laid out in Figure 3. Full parameters of these 360 models are provided in File S6.
Figure 2 illustrates the design of the simulation study. Ten thousand 5 kb windows were simulated for each of the 360 models, with 9000 windows generated using the background topology and 1000 windows generated using the alternate topology in each case. The accuracy of the D and f statistics in identifying regions of shared ancestry was estimated by determining how reliably each was able to identify the 10% of alternate windows in each dataset. While this approach of partitioning each dataset into two somewhat arbitrarily-sized subsets with distinct histories is unrealistic, it provides a simple and powerful framework in which to measure the accuracy with which we can subsequently identify windows subject to shared ancestry, with clear expectations. The accuracy of each statistic was therefore defined as the proportion of the 1000 alternate windows that fell within the top 1000 values. Hence 100% accuracy would indicate that the statistic identified all of the alternate windows from the simulated data, i.e. the top 1000 values corresponded perfectly to the 1000 alternate windows. A completely uninformative statistic would randomly identify 10% of the alternate windows. For D, only positive values were included in the set of 1000 outlying windows; windows with extreme negative D values were included in the background partition. Similarly, for f, only windows with D ≥ 0 were considered, as f is meaningless when there is no excess of ABBAs; and windows with negative Ds were included in the background partition (Figure 1C). To examine the effects of window size, we repeated the entire simulation study for windows of 10 kb (5000 windows) and 20 kb (2500 windows).
Analysis of Heliconius wing patterning regions and whole genome sequences
To investigate the ability of the D and f statistics to identify known loci at which adaptive introgression is thought to have occurred, we re-analyzed sequences of Heliconius wing patterning regions from The Heliconius Genome Consortium (2012), also recently analyzed by Smith and Kronforst (2013). The D and f statistics were calculated as described above for 5 kb sliding windows, moving in increments of 1 kb. Windows for which fewer than 1000 sites had genotype calls for at least half of the individuals were discarded. This threshold was selected as a compromise between the number of sites covered, and the number of individuals represented at each site. Stricter filtering on individual representation resulted in a considerable reduction in the number of sites analyzed, but more lenient filtering would result in poor allele frequency estimates at sites where few individuals are represented.
To interrogate how the D and f statistics are affected by the number of segregating sites in a given window, we re-analyzed whole genome data from Martin et al. (2013). D and f were calculated, along with proportion of segregating sites over the complete dataset, for non-overlapping 5 kb windows across the genome. Windows were restricted to single scaffolds and, as above, windows for which fewer than 1000 sites had genotype calls for at least half of the individuals were discarded. We also analyzed windows from each of the 21 chromosomes of the H. m. melpomene genome sequence separately. Scaffolds were assigned to chromosomes according to the Heliconius Genome Consortium (2012), and incorporating the improved assignment of Z-linked scaffolds by Martin et al. (2013) (details available in Dryad repositories http://dx.doi.org/10.5061/dryad.m27qq and http://dx.doi.org/10.5061/dryad.dk712).
Assessing a test to distinguish gene flow from ancestral structure based on absolute divergence
Smith and Kronforst (2013) proposed a simple test to distinguish between the hypotheses of pre- and post-speciation shared ancestry based on absolute divergence. We tested their predictions using the 360 simulated datasets described above, by comparing dXY (mean differences per site) between P2 and P3 for the background and alternate windows. The test was repeated, but rather than comparing the actual alternate and background windows, we identified 10% of the windows as outliers according to D and f values. Average dXY was then compared between the outlier and non-outlier partitions using a Wilcoxon rank-sum test, as values tended to be non-normally distributed (confirmed with Bonferroni-corrected Shapiro-Wilk tests).
Software
Code and data for this manuscript will be made available as a Data Dryad repository on acceptance. Most files, with instructions for running scripts to generate the results, are currently available on GitHub at https://github.com/johnomics/Martin_Davey_Jiggins_evaluating_introgression_statistics. Large data sets can be made available on request and will be made publicly available after review. This work was made possible by the free, open source software packages EggLib (De Mita and Siol 2012), phyclust (Chen 2011), R (R Core Team 2013), ggplot2 (Wickham 2009), plyr (Wickham 2011), reshape (Wickham 2007) and Inkscape (http://www.inkscape.org).
ACKNOWLEDGEMENTS
We thank Krzysztof Kozak, Richard Merrill and Richard Wallbank for initial discussions that inspired this work and Jim Mallet and Marcus Kronforst for comments on the manuscript. This work was supported by the Leverhulme Trust (F/09364/E to C.D.J.) and the Herchel Smith Fund (Postdoctoral Fellowship to J.W.D.).


