

Abstract
The arrival of farming in Europe around 8,500 years ago necessitated adaptation to new environments, pathogens, diets, and social organizations. While indirect evidence of adaptation can be detected in patterns of genetic variation in present-day people, ancient DNA makes it possible to witness selection directly by analyzing samples from populations before, during and after adaptation events. Here we report the first genome-wide scan for selection using ancient DNA, capitalizing on the largest genome-wide dataset yet assembled: 230 West Eurasians dating to between 6500 and 1000 BCE, including 163 with newly reported data. The new samples include the first genome-wide data from the Anatolian Neolithic culture, who we show were members of the population that was the source of Europe’s first farmers, and whose genetic material we extracted by focusing on the DNA-rich petrous bone. We identify genome-wide significant signatures of selection at loci associated with diet, pigmentation and immunity, and two independent episodes of selection on height.
Natural selection has left its mark on patterns of variation in our genomes1, but these patterns are echoes of past events, which are difficult to date and interpret, and are often confounded by neutral processes. Ancient DNA provides a more direct view, and should be a transformative technology for studies of selection just as it has transformed studies of history. Until now, however, the large sample sizes required to detect selection have meant that ancient DNA studies have concentrated on characterizing effects at parts of the genome already believed to have been affected by selection2-5.
We assembled genome-wide data from 230 ancient individuals who lived in West Eurasia from 6500 to 1000 BCE (Table 1, Fig. 1a, Supplementary Data Table 1, Supplementary Information section 1). To obtain this dataset, we combined published data from 67 samples from relevant periods and cultures4-6, with 163 samples for which we report new data, of which 83 have never previously been analyzed (the remaining 80 samples include 67 whose targeted single nucleotide polymorphism (SNP) coverage we triple from 390k to 1240k7; and 13 with shotgun data whose data quality we increase using our enrichment strategy3,8). The 163 samples for which we report new data are drawn from 270 distinct individuals who we screened for evidence of authentic DNA7. We used in-solution hybridization with synthesized oligonucleotide probes to enrich promising libraries for more than 1.2 million SNPs (“1240k capture”, Methods). The targeted sites include nearly all SNPs on the Affymetrix Human Origins and Illumina 610-Quad arrays, 49,711 SNPs on chromosome X and 32,681 on chromosome Y, and 47,384 SNPs with evidence of functional importance. We merged libraries from the same individual and filtered out samples with low coverage or evidence of contamination to obtain the final set of individuals. The advantage of 1240k capture is that it gives access to genome-wide data from ancient samples with small fractions of human DNA and increases efficiency by targeting sites in the human genome that will actually be analyzed. The effectiveness of the approach can be seen by comparing our results to the largest previously published ancient DNA study, which used a shotgun sequencing strategy5. Our median coverage on analyzed SNPs is ~4-times higher even while the mean number of reads generated per sample is 36-times lower (Extended Data Fig. 1).

A: Locations color-coded by date, with a random jitter added for visibility (8 Afanasievo and Andronovo samples lie further east and are not shown). B: Principal component analysis of 777 modern West Eurasian samples (grey), with 221 ancient samples projected onto the first two principal component axes and labeled by culture. Abbreviations: [E/M/L]N Early/Middle/Late Neolithic, LBK Linearbandkeramik, [E/W]HG Eastern/Western hunter-gatherer, [E]BA [Early] Bronze Age, IA Iron Age.
To learn about the history of archaeological cultures for which genome-wide data is reported for the first time here, we studied either 1,055,209 autosomal SNPs when analyzing 230 ancient individuals alone, or 592,169 SNPs when co-analyzing them with 2,345 present-day individuals genotyped on the Human Origins array4. We removed 13 samples either as outliers in ancestry relative to others of the same archaeologically determined culture, or first-degree relatives (Supplementary Data Table 1).
Our sample of 26 Anatolian Neolithic individuals represents the first genome-wide ancient DNA data from the eastern Mediterranean. Our success at analyzing such a large number of samples is likely due to the fact that at the Barcin site–the source of 21 of the working samples–we sampled from the cochlea of the petrous bone9, which has been shown to increase the amount of DNA obtained by up to two orders of magnitude relative to teeth (the next-most-promising tissue)3. Principal component (PCA) and ADMIXTURE10 analysis, shows that the Anatolian Neolithic samples do not resemble any present-day Near Eastern populations but are shifted towards Europe, clustering with Neolithic European farmers (EEF) from Germany, Hungary, and Spain7 (Fig. 1b, Extended Data Fig. 2). Further evidence that the Anatolian Neolithic and EEF were related comes from the high frequency (47%; n=15) of Y-chromosome haplogroup G2a typical of ancient EEF samples7 (Supplementary Data Table 1), and the low FST (0.005-0.016) between Neolithic Anatolians and EEF (Supplementary Data Table 2). These results support the hypothesis7 of a common ancestral population of EEF prior to their dispersal along distinct inland/central European and coastal/Mediterranean routes. The EEF are slightly more shifted to Europe in the PCA than are the Anatolian Neolithic (Fig. 1b) and have significantly more admixture from Western hunter-gatherers (WHG), shown by f4-statistics (|Z|>6 standard errors from 0) and negative f3-statistics (|Z|>4)11 (Extended Data Table 3). We estimate that the EEF have 7-11% more WHG admixture than their Anatolian relatives (Extended Data Fig. 2, Supplementary Information section 2).
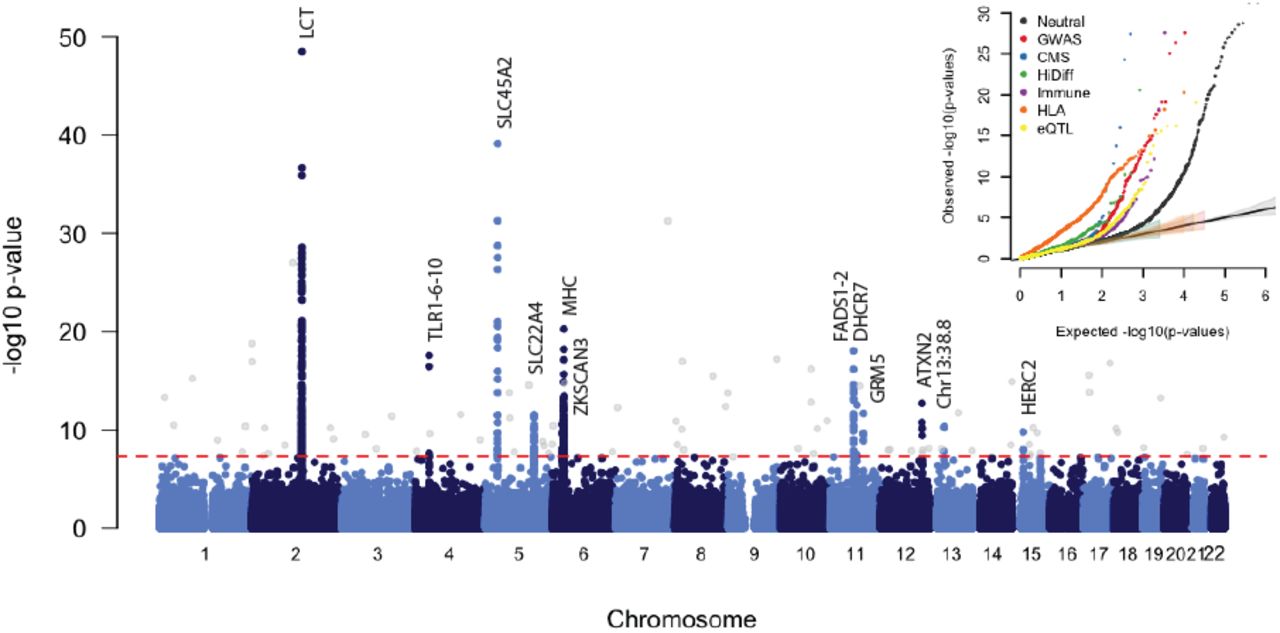
GC-corrected –log10 p-value for each marker. The red dashed line represents a genome-wide significance level of 0.5 × 10⁻⁸. Genome-wide significant points filtered because there were fewer than two other genome-wide significant points within 1Mb are shown in grey. Inset: QQ plots for corrected −log10 p-values for different categories of potentially functional SNPs (Methods). Truncated at −log10(p-value)=30. All curves are significantly different from neutral expectation.
The Iberian Chalcolithic individuals from El Mirador cave are genetically similar to the Middle Neolithic Iberians who preceded them (Fig. 1b; Extended Data Fig. 2), and have more WHG ancestry than their Early Neolithic predecessors7 (|Z|>10) (Extended Data Table 3). However, they do not have a significantly different proportion of WHG ancestry (we estimate 23-28%) than the Middle Neolithic Iberians (Extended Data Fig. 2). Chalcolithic Iberians have no evidence of steppe ancestry (Fig. 1b, Extended Data Fig. 2), in contrast to central Europeans of the same period5,7. Thus, the “Ancient North Eurasian”-related ancestry that is ubiquitous across present-day Europe4,7 arrived in Iberia later than in Central Europe (Supplementary Information section 2).
To understand population transformations in the Eurasian steppe, we analyzed a time transect of 37 samples from the Samara region spanning ~5600-300 BCE and including the Eastern Hunter-gatherer (EHG), Eneolithic, Yamnaya, Poltavka, Potapovka and Srubnaya cultures. Admixture between populations of Near Eastern ancestry and the EHG7 began as early as the Eneolithic (5200-4000 BCE), with some individuals resembling EHG and some resembling Yamnaya (Fig. 1b; Extended Data Fig. 2). The Yamnaya from Samara and Kalmykia, the Afanasievo people from the Altai (3300-3000 BCE), and the Poltavka Middle Bronze Age (2900-2200 BCE) population that followed the Yamnaya in Samara, are all genetically homogeneous, forming a tight “Bronze Age steppe” cluster in PCA (Fig. 1b), sharing predominantly R1b Y-chromosomes5,7 (Supplementary Data Table 1), and having 48-58% ancestry from an Armenian-like Near Eastern source (Extended Data Table 3) without additional Anatolian Neolithic or Early European Farmer (EEF) ancestry7 (Extended Data Fig. 2). After the Poltavka period, population change occurred in Samara: the Late Bronze Age Srubnaya have ~17% Anatolian Neolithic or EEF ancestry (Extended Data Fig. 2). Previous work documented that such ancestry appeared east of the Urals beginning at least by the time of the Sintashta culture, and suggested that it reflected an eastward migration from the Corded Ware peoples of central Europe5. However, the fact that the Srubnaya also harbored such ancestry indicates that the Anatolian Neolithic or EEF ancestry could have come into the steppe from a more eastern source. Further evidence that migrations originating as far west as central Europe may not have had an important impact on the Late Bronze Age steppe comes from the fact that the Srubnaya possess exclusively (n=6) R1a Y-chromosomes (Extended Data Table 1), and four of them (and one Poltavka male) belonged to haplogroup R1a-Z93 which is common in central/south Asians12, very rare in present-day Europeans, and absent in all ancient central Europeans studied to date.
To study selection, we created a dataset of 1,084,781 autosomal SNPs in 617 samples by merging 213 ancient samples with genome-wide sequencing data from four populations of European ancestry from the 1,000 Genomes Project13. Most present-day Europeans can be modeled as a mixture of three ancient populations related to Mesolithic hunter-gatherers (WHG), early farmers (EEF) and steppe pastoralists (Yamnaya)4,7, and so to scan for selection, we divided our samples into three groups based on which of these populations they clustered with most closely (Fig. 1b, Extended Data Table 1). We estimated mixture proportions for the present-day European ancestry populations and tested every SNP to evaluate whether its present-day frequencies were consistent with this model. We corrected for test statistic inflation by applying a genomic control correction analogous to that used to correct for population structure in genome-wide association studies. Of ~1 million non-monomorphic autosomal SNPs, the ~50,000 in the set of potentially functional SNPs were significantly more inconsistent with the model than neutral SNPs (Fig. 2), suggesting pervasive selection. Using a conservative significance threshold of p=5.0 × 10⁻⁸, and a genomic control correction of 1.38, we identified 12 loci that contained at least three SNPs achieving genome-wide significance within 1 Mb of the most associated SNP (Fig. 2, Extended Data Table 2, Extended Data Fig. 3, Supplementary Data Table 3).

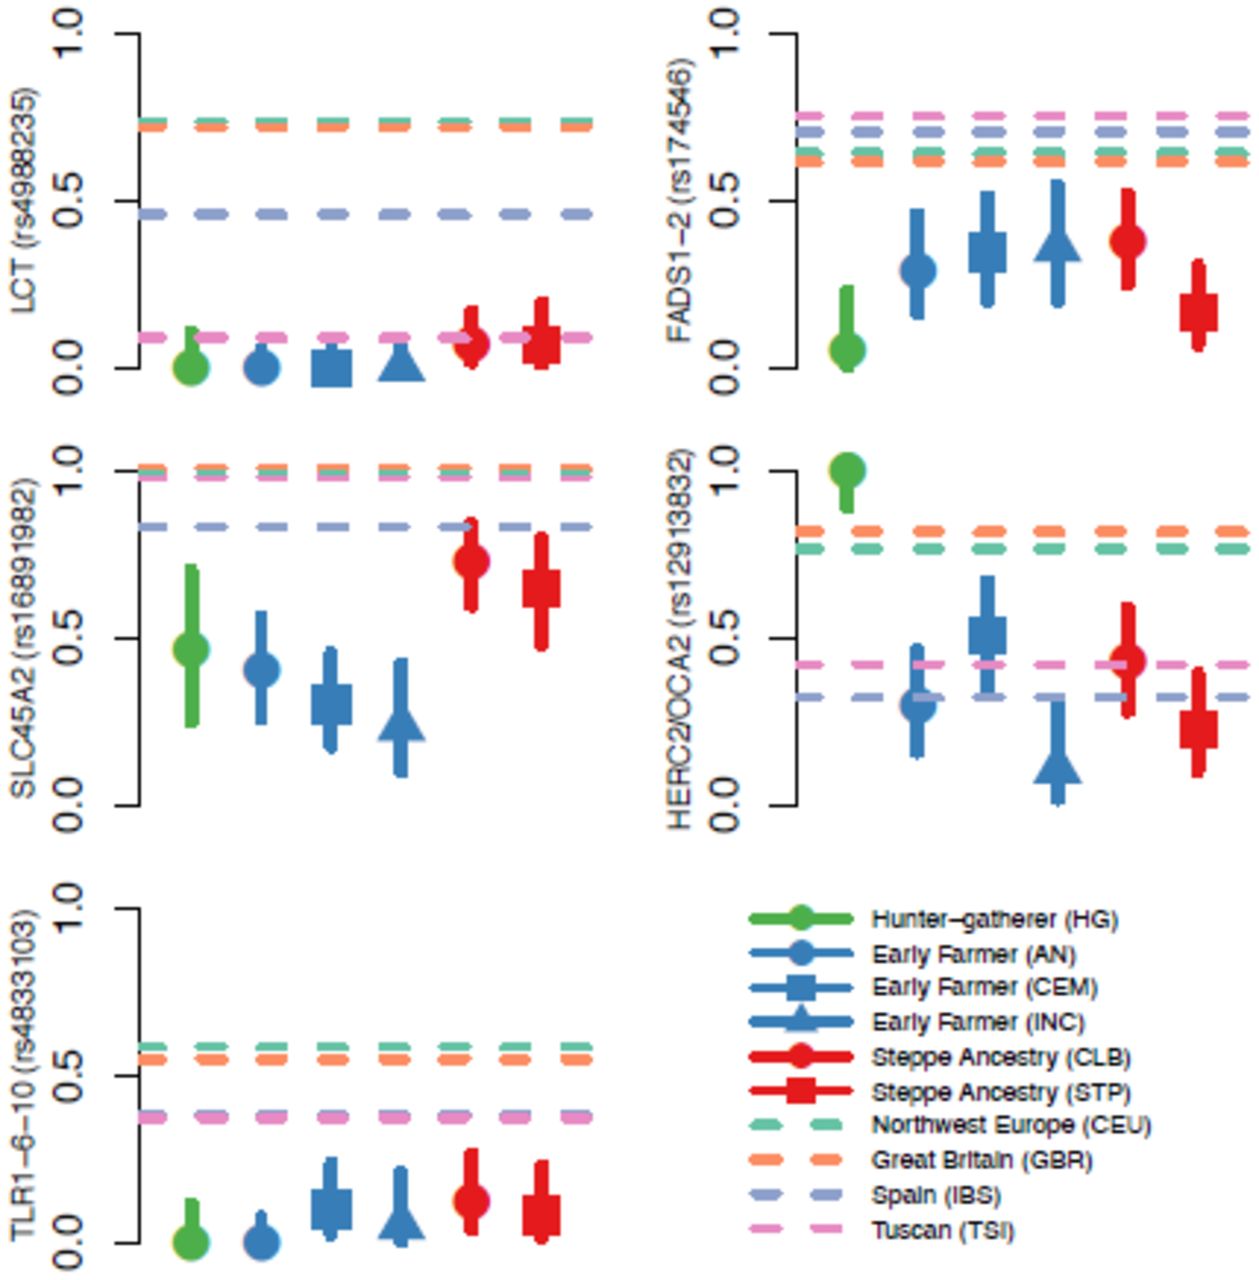
Allele frequencies for five genome-wide significant signals of selection. In each plot, the dots and solid lines show the maximum likelihood frequency estimate and a 1.9-log-likelihood support interval for the derived allele frequency in each ancient population. The four horizontal dashed lines show the allele frequencies in the four modern 1000 Genomes populations. Abbreviations for ancient populations (See Extended Data Table 1); AEN: Anatolian Neolithic; HG: hunter-gatherer; CEM: Central European Early and Middle Neolithic; INC: Iberian Neolithic and Chalcolithic; CLB: Central European Late Neolithic and Bronze Age; STP: Steppe. The Hunter-Gatherer, Early Farmer and Steppe Ancestry classifications correspond approximately to the three populations used in the genome-wide scan with some differences - for example Bell Beakers are included here with CLB but not in the selection scan (See Extended Data Table 1 for details).
The strongest signal of selection is at the SNP (rs4988235) responsible for lactase persistence in Europe14. Our data (Fig. 3) strengthens previous reports that an appreciable frequency of lactase persistence in Europe only dates to the last four thousand years3,5,15. The allele’s earliest appearance in our data is in a central European Bell Beaker sample (individual I0112) that lived between approximately 2300 and 2200 BCE. Two other independent signals related to diet are located on chromosome 11 near FADS1 and DHCR7. FADS1 and FADS2 are involved in fatty acid metabolism, and variation at this locus is associated with plasma lipid and fatty acid concentration16. The selected allele of the most significant SNP (rs174546) is associated with decreased triglyceride levels16. Variants at DHCR7 and NADSYN1 are associated with circulating vitamin D levels17 and our most associated SNP, rs7940244, is highly differentiated across closely related Northern European populations18, suggesting selection related to variation in dietary or environmental sources of vitamin D.
Two signals have a potential link to celiac disease. One occurs at the ergothioneine transporter SLC22A4 that is hypothesized to have experienced a selective sweep to protect against ergothioneine deficiency in agricultural diets19. Common variants at this locus are associated with increased risk for ulcerative colitis, celiac disease, and irritable bowel disease and may have hitchhiked to high frequency as a result of this sweep19-21. However the specific variant (rs1050152, L503F) that was thought to be the target did not reach high frequency until relatively recently (Extended Data Fig. 4). The signal at ATXN2/SH2B3–also associated with celiac disease20–shows a similar pattern (Extended Data Fig. 4).

A: Estimated genetic heights for studied populations. Boxes show date ranges and .05 to .95 posterior densities for estimated population mean genetic height (Methods). Dots show the maximum likelihood point estimate of the height. Arrows show major population relationships, with dashed lines representing ancestral populations. Two labeled V’s show our hypothesis for two independent selective events. B: Z scores for the polygenic selection scan. The score is positive in each box if the column population is taller than the row population. Abbreviations; AN: Anatolian Neolithic; HG: hunter-gatherer; CEM: Central European Early and Middle Neolithic; INC: Iberian Neolithic and Chalcolithic; CLB: Central European Late Neolithic and Bronze Age; STP: Steppe; CEU: Utah residents with northern and western European ancestry; IBS: Iberian population in Spain.
The second strongest signal in our analysis is at the derived allele of rs16891982 in SLC45A2, which contributes to light skin pigmentation and is almost fixed in present-day Europeans but occurred at much lower frequency in ancient populations. In contrast, the derived allele of SLC24A5 that is the other major determinant of light skin pigmentation in modern Europe appears fixed in the Anatolian Neolithic, suggesting that its rapid increase in frequency to around 0.9 in the Early Neolithic was mostly due to migration (Extended Data Fig. 4). Another pigmentation signal is at GRM5, where SNPs are associated with pigmentation possibly through a regulatory effect on nearby TYR22. We also find evidence of selection for the derived allele of rs12913832 at HERC2/OCA2, which appears to be fixed in Mesolithic hunter-gatherers, and is the primary determinant of blue eye color in present-day Europeans. In contrast to the other loci, the range of frequencies in modern populations is within that of ancient populations (Fig. 3). The frequency increases with higher latitude, suggesting a complex pattern of environmental selection.
The TLR1-TLR6-TLR10 gene cluster is a known target of selection in Europe23, possibly related to resistance to leprosy, tuberculosis or other mycobacteria. There is also a strong signal of selection at the major histocompatibility complex (MHC) on chromosome 6. The strongest signal is at rs2269424 near the genes PPT2 and EGFL8 but there are at least six other apparently independent signals in the MHC (Extended Data Fig. 3); and the entire region is significantly more associated than the genome-wide average (residual inflation of 2.07 in the region on chromosome 6 between 29-34 Mb after genome-wide genomic control correction). This could be the result of multiple sweeps, balancing selection, or background selection in this gene-rich region.
We find a surprise in six Scandinavian hunter-gatherers (SHG) from the Motala site in southern Sweden. In three out of six samples, we observe the haplotype carrying the derived allele of rs3827760 in the EDAR gene (Extended Data Fig. 5), which affects tooth morphology and hair thickness and has been the subject of a selective sweep in East Asia24, and today is at high frequency in East Asians and Native Americans. The EDAR derived allele is largely absent in present-day Europe except in Scandinavia, plausibly due to Siberian movements into the region millennia after the date of the Motala samples. The SHG have no evidence of East Asian ancestry4,7, suggesting that the EDAR derived allele may not have originated not in East Asians as previously suggested24. A second surprise is that, unlike closely related western hunter-gatherers, the Motala samples have predominantly derived pigmentation alleles at SLC45A2 and SLC24A5.
We also tested for selection on complex traits. The best-documented example of this process in humans is height, for which the differences between Northern and Southern Europe have driven by selection25. To test for this signal in our data, we used a statistic that tests whether trait-affecting alleles are both highly correlated and more differentiated, compared to randomly sampled alleles26. We predicted genetic heights for each population and applied the test to all populations together, as well as to pairs of populations (Fig. 4). Using 180 height-associated SNPs27 (restricted to 169 where we successfully targeted at least two chromosomes in each population), we detect a significant signal of directional selection on height (p=0.002). Applying this to pairs of populations allows us to detect two independent signals. First, the Iberian Neolithic and Chalcolithic samples show selection for reduced height relative to both the Anatolian Neolithic (p=0.042) and the Central European Early and Middle Neolithic (p=0.003). Second, we detect a signal for increased height in the steppe populations (p=0.030 relative to the Central European Early and Middle Neolithic). These results suggest that the modern South-North gradient in height across Europe is due to both increased steppe ancestry in northern populations, and selection for decreased height in Early Neolithic migrants to southern Europe. We do not observe any other significant signals of polygenetic selection in five other complex traits we tested: body mass index28 (p=0.20), waist-to-hip ratio29 (p=0.51), type 2 diabetes30 (p=0.37), inflammatory bowel disease21 (p=0.17) and lipid levels16 (p=0.50).
Our results show how ancient DNA can be used to perform a genome-wide scan for selection, and demonstrate selection on loci related to pigmentation, diet and immunity, painting a picture of Neolithic populations adapting to settled agricultural life at high latitudes. For most of the signals we detect, allele frequencies of modern Europeans are outside the range of any ancient populations, indicating that phenotypically, Europeans of four thousand years ago were different in important respects from Europeans today despite having overall similar ancestry. An important direction for future research is to increase the sample size for European selection scans (Extended Data Fig. 6), and to apply this approach to regions beyond Europe and to nonhuman species.
Acknowledgments
We thank Paul de Bakker, Joachim Burger, Christos Economou, Elin Fornander, Qiaomei Fu, Fredrik Hallgren, Karola Kirsanow, Alissa Mittnik, Iñigo Olalde, Adam Powell, Pontus Skoglund, Shervin Tabrizi, and Arti Tandon for discussions, suggestions about SNPs to include, or contribution to sample preparation or data curation. We thank Svante Pääbo, Matthias Meyer, Qiaomei Fu, and Birgit Nickel for collaboration in developing the 1240k capture reagent. We thank Julio Manuel Vidal Encinas and María Encina Prada for allowing us to resample La Braña 1, and the 1000 Genomes Project for allowing use of the Phase 3 data. I.M. was supported by the Human Frontier Science Program LT001095/2014-L. C.G. was supported by the Irish Research Council for Humanities and Social Sciences (IRCHSS). A.K., P.K. and O.M. were supported by RFBR 𝒩o15-06-01916 and RFHNo15-11-63008 and O.M. by a state grant of the Ministry of education and science of Russia Federation #33.1195.2014/k. J.K. was supported by ERC starting grant APGREID and DFG grant KR 4015/1-1. K.W.A. was supported by DFG grant AL 287 / 14-1. W.H. and B.L. were supported by Australian Research Council DP130102158. R.P. was supported by ERC starting grant ADNABIOARC (263441), and an Irish Research Council ERC support grant. D.R. was supported by U.S. National Science Foundation HOMINID grant BCS-1032255, U.S. National Institutes of Health grant GM100233, and the Howard Hughes Medical Institute.
Author Information
The aligned sequences are available through the European Nucleotide Archive under accession number [to be made available on publication]. The Human Origins genotype datasets including ancient individuals can be found at (http://genetics.med.harvard.edu/reichlab/Reich_Lab/Datasets.html). Reprints and permissions information is available at www.nature.com/reprints. The authors declare no competing financial interests. Readers are welcome to comment on the online version of the paper. Correspondence and requests for materials should be addressed to I.M.
(iain mathieson{at}hms.harvard.edu), W.H. (haak{at}shh.mpg.de), R.P. (ron.pinhasi{at}ucd.ie) or D.R. (reich{at}genetics.med.harvard.edu).
Author Contributions
W.H., R.P. and D.R. supervised the study. S.A.R., J.L.A., J.M.B., E.C., F.G., A.K., P.K., M.L., H.M., O.M., V.M., M.A.R., J.R., J.M.V., J.K., A.C., K.W.A., D.B., D.A., C.L., W.H., R.P. and D.R. assembled archaeological material. I.M., I.L., N.R., S.M., N.P., S.D., J.P., W.H. and D.R. analysed genetic data. N.R., E.H., K.S., D.F., M.N., K.S., C.G., E.R.J., B.L., C.L. and W.H. performed wet laboratory ancient DNA work. I.M., I.L. and D.R. wrote the manuscript with help from all co-authors.
Methods
Ancient DNA analysis
We screened 433 next generation sequencing libraries from 270 distinct samples for authentic ancient DNA using previously reported protocols7. All libraries that we included in nuclear genome analysis were treated with uracil-DNA-glycosylase (UDG) to reduce characteristic errors of ancient DNA31.
We performed in-solution enrichment for a targeted set of 1,237,207 SNPs using previously reported protocols4,7,32. The targeted SNP set merges 394,577 SNPs first reported in Ref. 7 (390k capture), and 842,630 SNPs first reported in ref.33 (840k capture). For 67 samples for which we newly report data in this study, there was pre-existing 390k capture data7. For these samples, we only performed 840k capture and merged the resulting sequences with previously generated 390k data. For the remaining samples, we pooled the 390k and 840k reagents together to produce a single enrichment reagent. We attempted to sequence each enriched library up to the point where we estimated that it was economically inefficient to sequence further. Specifically, we iteratively sequenced more and more from each sample and only stopped when we estimated that the expected increase in the number of targeted SNPs hit at least once would be less than one for every 100 new read pairs generated. After sequencing, we filtered out samples with <30,000 targeted SNPs covered at least once, with evidence of contamination based on mitochondrial DNA polymorphism32, an appreciable rate of heterozygosity on chromosome X despite being male34, or an atypical ratio of X to Y sequences
Of the targeted SNPs, 47,384 are “potentially functional” sites chosen as follows (with some overlap): 1,290 SNPs identified as targets of selection in Europeans by the Composite of Multiple Signals (CMS) test1; 21,723 SNPS identified as significant hits by genome-wide association studies, or with known phenotypic effect (GWAS); 1,289 SNPs with extremely differentiated frequencies between HapMap populations35 (HiDiff); 9,116 immunochip SNPs chosen for study of immune phenotypes (Immune); 347 SNPs phenotypically relevant to South America (mostly altitude adaptation SNPs in EGLN1 and EPAS1), 5,387 SNPs which tag HLA haplotypes (HLA) and 13,672 expression quantitative trait loci36 (eQTL).
Population history analysis
We used two datasets for population history analysis. “HO” consists of 592,169 SNPs, taking the intersection of the SNP targets and the Human Origins SNP array4; we used this dataset for co-analysis of present-day and ancient samples. “HOIll” consists of 1,055,209 SNPs that additionally includes sites from the Illumina genotype array37; we used this dataset for analyses only involving the ancient samples.
On the HO dataset, we carried out principal components analysis in smartpca38 using a set of 777 West Eurasian individuals4, and projected the ancient individuals with the option “lsqproject: YES”. We carried out ADMIXTURE analysis on a set of 2,345 present-day individuals and the ancient samples after pruning for LD in PLINK 1.9 (https://www.cog-genomics.org/plink2)39 with parameters “-indeppairwise 200 25 0.4”. We varied the number of ancestral populations between K=2 and K=20, and used cross-validation (--cv) to identify the value of K=17 to plot in Extended Data Fig. 2f.
We used ADMIXTOOLS11 to compute f-statistics, determining standard errors with a Block Jackknife and default parameters. We used the option “inbreed: YES” when computing f3-statistics of the form f3(Ancient; Ref1, Ref2) as the Ancient samples are represented by randomly sampled alleles rather than by diploid genotypes. For the same reason, we estimated FST genetic distances between populations on the HO dataset with at least two individuals in smartpca also using the “inbreed: YES” option.
We estimated ancestral proportions as in Supplementary Information section 9 of Ref. 7, using a method that fits mixture proportions on a Test population as a mixture of N Reference populations by using f4-statistics of the form f4(Test or Ref, O1; O2, O3) that exploit allele frequency correlations of the Test or Reference populations with triples of Outgroup populations. We used a set of 15 world outgroup populations4,7. In Extended Data Fig. 2, we added WHG and EHG as outgroups for those analyses in which they are not used as reference populations.
We determined sex by examining the ratio of aligned reads to the sex chromosomes40. We assigned Y-chromosome haplogroups to males using version 9.1.129 of the nomenclature of the International Society of Genetic Genealogy (www.isogg.org), restricting analysis using samtools41 to sites with map quality and base quality of at least 30, and excluding 2 bases at the ends of each sequenced fragment.
Genome-wide scan for selection
For most ancient samples, we did not have sufficient coverage to make reliable diploid calls. We therefore used the counts of sequences covering each SNP to compute the likelihood of the allele frequency in each population. Suppose that at a particular site, for each population we have M samples with sequence level data, and N samples for which we had hard genotype calls (Loschbour, Stuttgart and the 1,000 Genomes samples). For samples i = 1... N, with genotype data, we observe X copies of the reference allele out of 2N total chromosomes. For each of samples i = (N + 1)… (N + M), with sequence level data, we observe Ri sequences with the reference allele out of Ti total sequences. Then, dropping the subscript i for brevity, the likelihood of the population reference allele frequency, p given data  is given by
 where
where  is the binomial probability distribution and ε is a small probability of error, which we set to 0.001. We write ℓ(p; D) for the log-likelihood. To estimate allele frequencies, for example in Fig. 3 or for the polygenic selection test, we maximized this likelihood numerically for each population.
To scan for selection across the genome, we used the following test. Consider a single SNP. Assume that we can model the allele frequencies pmod in A modern populations as a linear combination of allele frequencies in B ancient populations panc. That is, pmod = CPanc, where C is an A by B matrix with rows summing to 1. We have data Dj from population j which is some combination of sequence counts and genotypes as described above. Then, writing  the log-likelihood of the allele frequencies equals the sum of the log-likelihoods for each population.

To detect deviations in allele frequency from expectation, we test the null hypothesis H0: pmod = C panc against the alternative H1:pmod unconstrained. We numerically maximize this likelihood in both the constrained and unconstrained model and use the fact that twice the difference in log-likelihood is approximately  distributed to compute a test statistic and p-value.
We defined the ancient source populations by the “Selection group 1” label in Extended Data Table 1 and Supplementary Table 1 and used the 1000 Genomes CEU, GBR, IBS and TSI as the present-day populations. We removed SNPs that were monomorphic in all four of these modern populations as well as in 1000 Genomes Yoruba (YRI). We do not use FIN as one of the modern populations, because they do not fit this three-population model well. We estimate the proportions of (HG, EF, SA) to be CEU=(0.196, 0.257, 0.547), GBR=(0.362,0.229,0.409), IBS= (0, 0.686, 0.314) and TSI=(0, 0.645, 0.355). In practice we found that there was substantial inflation in the test statistic, most likely due to unmodeled ancestry or additional drift. To address this, we applied a genomic control correction42, dividing all the test statistics by a constant, λ, chosen so that the median p-value matched the median of the null  distribution. Excluding sites in the potentially functional set, we estimated λ = 1.38 and used this value as a correction throughout. One limitation of this test is that, although it identifies likely signals of selection, it cannot provide much information about the strength or date of selection. If the ancestral populations in the model are, in fact, close to the real ancestral populations, then any selection must have occurred after the first admixture event (in this case, after 6500 BCE), but if the ancestral populations are mis-specified, even this might not be true.
To estimate power, we randomly sampled allele counts from the full dataset, restricting to polymorphic sites with a mean frequency across all populations of <0.1. We then simulated what would happen if the allele had been under selection in all of the modern populations by simulating a Wright-Fisher trajectory with selection for 50, 100 or 200 generations, starting at the observed frequency. We took the final frequency from this simulation, sampled observations to replace the actual observations in that population, and counted the proportion of simulations that gave a genome-wide significant result after GC correction (Extended Data Fig. 6a). We resampled sequence counts for the observed distribution for each population to simulate the effect of increasing sample size, assuming that the coverage and distribution of the sequences remained the same (Extended Data Fig. 6b).
We investigated how the genomic control correction responded when we simulated small amounts of admixture from a highly diverged population (Yoruba; 1000 Genomes YRI) into a randomly chosen modern population. The genomic inflation factor increases from around 1.38 to around 1.51 with 10% admixture, but there is little reduction in power (Extended Fig. 6c). Finally, we investigated how robust the test was to misspecification of the mixture matrix C. We reran the power simulations using a matrix C′ = pC + (1 – p)R for p ∈ [0,1] where R was a random matrix chosen so that for each modern population, the mixture proportions of the three ancient populations were jointly normally distributed on [0,1]. Increasing p increases the genomic inflation factor and reduces power, demonstrating the advantage of explicitly modeling the ancestries of the modern populations (Extended Fig. 6d).
Test for polygenic selection
We implemented the test for polygenic selection described by Ref. 26. This evaluates whether trait-associated alleles, weighted by their effect size, are over-dispersed compared to randomly sampled alleles, in the directions associated with the effects measured by genome-wide association studies (GWAS). For each trait, we obtained a list of significant SNP associations and effect estimates from GWAS data, and then applied the test both to all populations combined and to selected pairs of populations. We restricted the list of GWAS associations to 169 SNPs where we observed at least two chromosomes in all tested populations (selection population 2). We estimated frequencies in each population by computing the MLE, using the likelihood described above. For each test, we sampled SNPs frequency matched in 20 bins, computed the test statistic QX and for ease of comparison, converted these to Z scores, signed according the direction of the genetic effects. Theoretically QX has a χ2 distribution but in practice, it is over-dispersed. Therefore, we report bootstrap p-values computed by sampling 10,000 sets of frequency matched SNPs.
To estimate population-level genetic height in Fig. 4A, we assumed a uniform prior on [0,1] for the distribution of all height-associated alleles, and then sampled from the posterior joint frequency distribution of the alleles, assuming they were independent, using a Metropolis-Hastings sampler with a N(0,0.001) proposal density. We then multiplied the sampled allele frequencies by the effect sizes to get a distribution of genetic height.


