

ABSTRACT
Motivation DNA methylation is an important epigenetic modification related to a variety of diseases including cancers. One of the key issues of methylation analysis is to detect the differential methylation sites between case and control groups. Previous approaches describe data with simple summary statistics and kernel functions, and then use statistical tests to determine the difference. However, a summary statistics-based approach cannot capture complicated underlying structure, and a kernel functions-based approach lacks interpretability of results.
Results We propose a novel method D3M, for detection of differential distribution of methylation, based on distribution-valued data. Our method can detect high-order moments, such as shapes of underlying distributions in methylation profiles, based on the Wasserstein metric. We test the significance of the difference between case and control groups and provide an interpretable summary of the results. The simulation results show that the proposed method achieves promising accuracy and outperforms previous methods. Glioblastoma multiforme and lower grade glioma data from The Cancer Genome Atlas and show that our method supports recent biological advances and suggests new insights.
Availability R implemented code is freely available from https://cran.r-project.org/web/packages/D3M/ https://github.com/cran/D3M.
Contact ymatsui{at}med.nagoya-u.ac.jp
1 INTRODUCTION
DNA methylation is an epigenetic chemical alternation in which a methyl group is attached to a carbon cytosine (C) base. It is closely related to gene expression, silencing, and genomic imprinting, including oncogenesis. Typically, methylation is explained as occurring in cytosine-phosphate-guanine (CpG) islands. The methylation of promoter regions, in particular, silences cancer suppressor genes.
One of the key issues for methylation analysis is to detect differential methylation site, i.e., significant difference in methylation patterns between case and control groups at a site. When comparing groups, we often summarize (or aggregate) data in summary statistics, such as mean and variance, and then investigate the difference between the groups. For example, limma (Smyth, et al., 2005), minfi (Aryee, et al., 2014), edgeR (Robinson, et al., 2010), DESeq (Anders, et al., 2010) and DiffVar (Phipson, et al. 2014) detect the differential methylation sites by testing for significant differences in mean and variance. Other nonparametric approaches exist, such as the Mann-Whitney-Wilcox test (MWW), based on rank statistics, and the Kolmogorov-Smirnov test (KS) or kernel-based approaches, such as M3D (Mayo et al., 2014) with maximum mean discrepancy (MMD) (Gretton, et al., 2012). In particular, since KS and MMD consider the underlying distribution structure, they are better suited for use with complicated distributions than methods based on summary statistics.
These approaches are effective in detecting typical differential methylation sites, but are insufficient from some perspectives, such as the following. The limma, minfi, edgeR, DESeq, and DiffVar methods are inappropriate when underlying distributions are complicated by being skewed, heavy-tailed, and multimodal. In particular, since cancer cells include heterogeneities, measurements of methylation potentially include complex distribution shapes. This observation indicates that we need to consider the underlying structure. The disadvantage of KS and MMD is infeasible interpretability of results because they measure the maximum and kernel distances of distributions, respectively, which are difficult to interpret corresponding to the actual difference of underlying distributions.
We develop a method to detect differential methylation sites with distribution-valued data (Irpino and Verde, 2014a). Distribution-valued data are an example of symbolic data analysis (Diday, 1989). This framework can treat complex data such as functional (Ramsey and Silverman 2005), tree (Wang and Marron, 2007), set, interval, and histogram values (Bock and Diday, 2000; Billard and Diday, 2006; Noirhomme-Fraiture and Diday, 2008). The proposed method describes case and control groups using distribution values. We measure the differences between distributions using the Wasserstein metric. We detect the differential methylation sites using a statistical test of significant differences of distribution functions.
2 METHODS
Our method is aimed at a distribution-based comparison of methylation patterns in two groups, through site-by-site resolution. We construct distribution functions representing the two groups at each site. Next, we compare the groups using a dissimilarity measure and test statistical significance through site-by-site resampling. We adopt an L2-Wasserstein metric (Ruesehen, 2011) as a dissimilarity measure, a distribution function-based measure of statistical distance. The advantage of this distance is the interpretability of results because the distance can be decomposed into three components, i.e., mean, variance, and distribution shape. This fact leads to visualization of results using a Q-Q plot to interpret the detected distribution difference including hypo-or hyper-methylation status.
2.1 Construction of objects
X(si) and Y(si) (i =1,2,…,S) represent the beta values in a case group (e.g., cancer subjects) and control group (e.g., normal subjects) at a CpG site si. We represent the data as distribution values by

In practice, let the beta value observations be xj (si);j = 1,2,…,n and yj (si);j =1,2,…,m following Fi(x) and Gi(y), respectively, where n and m are the respective numbers of observations at si. From the data, we construct the empirical distribution functions;

Where

2.2 Dissimilarity measure for distributions
The Wasserstein metric is defined by
 where 1 ≤ q ≤ 2 and
  and
and  indicate quantile functions.
In particular, in the case of q =2, the metric can be decomposed into three components that describe the distribution characteristics, i.e., mean, variance, and shape (Irpino and Verde, 2014a):
 where μi and
  (respectively,
  and
and  ) are mean and variance of Fi(x)(respectively, Gi(y)), and ρi is the correlation index of the points in the Q-Q plot of Fi and Gi.
The empirical estimator of the Wasserstein metric is given by

Technically, we use quantiles to compute the approximation of the (??) for reducing computational costs. Let (Qi,1,Qi,2,…,Qi,K) and  be k-quantiles of Fi(x) and Gi(y). We calculate
  in the case of q = 2, instead of evaluating the integral in (??). Here we simply write
  .
.
2.3 Detection of differential methylation sites
We use the metric to investigate whether two distributions are significantly different. We pose statistical hypotheses as follows.

We use resampling to construct a null distribution. From the null hypothesis (??), we permute the observations (x1(si),x2(si),…, xn(si)) and (y1(si),y2(si),…,ym(si)) to obtain the new distribution functions  and
and  Next, we obtain the new distance
  according to (??).
Let  be all possible distances for the permutation process. Then p-value is

Approximation of (??) uses the subset of  where B ≤ Ball:

In the simulation of section 3 and data analysis in section 4, we set B =10000.
The number of permutations B is closely related to the accuracy of the p-value. However, resolution of Psub is limited to 1/B,ifwe need the very small p-values. One solution is to perform a large number of permutations, but it is computationally expensive. A semi-parametric estimation of p-value is proposed by Knijnenburg et al. (2009) to obtain more accurate p-values.
We use an exponential distribution to estimate the distribution tail as follows,
 where λi is a scale parameter and
  is a threshold that we set to 99th percentile of null distributions. We estimate λi using data above the threshold. Technically, we perform the semi-parametric estimation only if Psub(di)reaches to zero.
2.4 Graphical representation of results
Since the method for detection of methylation, which is based on distance, cannot distinguish the “direction” of the hyper-or hypo-methylation. One approach is to plot all the distribution (density) functions of candidate sites, but this is infeasible for hundreds of sites. We use a Q-Q plot with two distributions. It enables us to visualize many pairs of distributions at a time, with the directions being easy to interpret. In the actual example shown in section 4, we plotted 1,000 pairs of differentially methylated distributions (Fig ??). We can see the hyper-methylation with the most significant 1,000 sites (blue lines in Fig ??).
3 SIMULATION
3.1 Simulation setting
We evaluated the proposed method with simulated datasets. Our simulation is intended for the detection of differential methylation sites when there is cancer heterogeneity. Here, the cancer heterogeneity is described by the multiple modes of distributions. We conduct a statistical test for H0: Fi = Gi ↔ H1: Fi ≠ Gi under significance levels 5% and 1%, and we compare the results to those of the other methods, i.e., DiffVar, MMD, KS, MWW and Welch test (Welch). We used R packages for this simulation, MissMethyl (Phipson, et al. 2014), kernlab (Karatzoglou, et al., 2004), and baseThe setting of MissMethyl is default and that of kmmd in kernlab with resampling number (ntimes) is set by 10,000. Since the distribution distance is decomposed into mean, variance, and shape in (??), we conduct seven cases of H1 (Table 1). Figure 1 shows seven differential methylation cases with beanplot (Kampstra, 2008) in which the distribution density functions are described as upper and lower for control and case groups, respectively. The vertical black solid line indicates the distribution mean. Here, we define shape differences of the distributions as the number of modes, i.e., unimodal and bimodal distributions are regarded as different.
Simulation models of eight cases
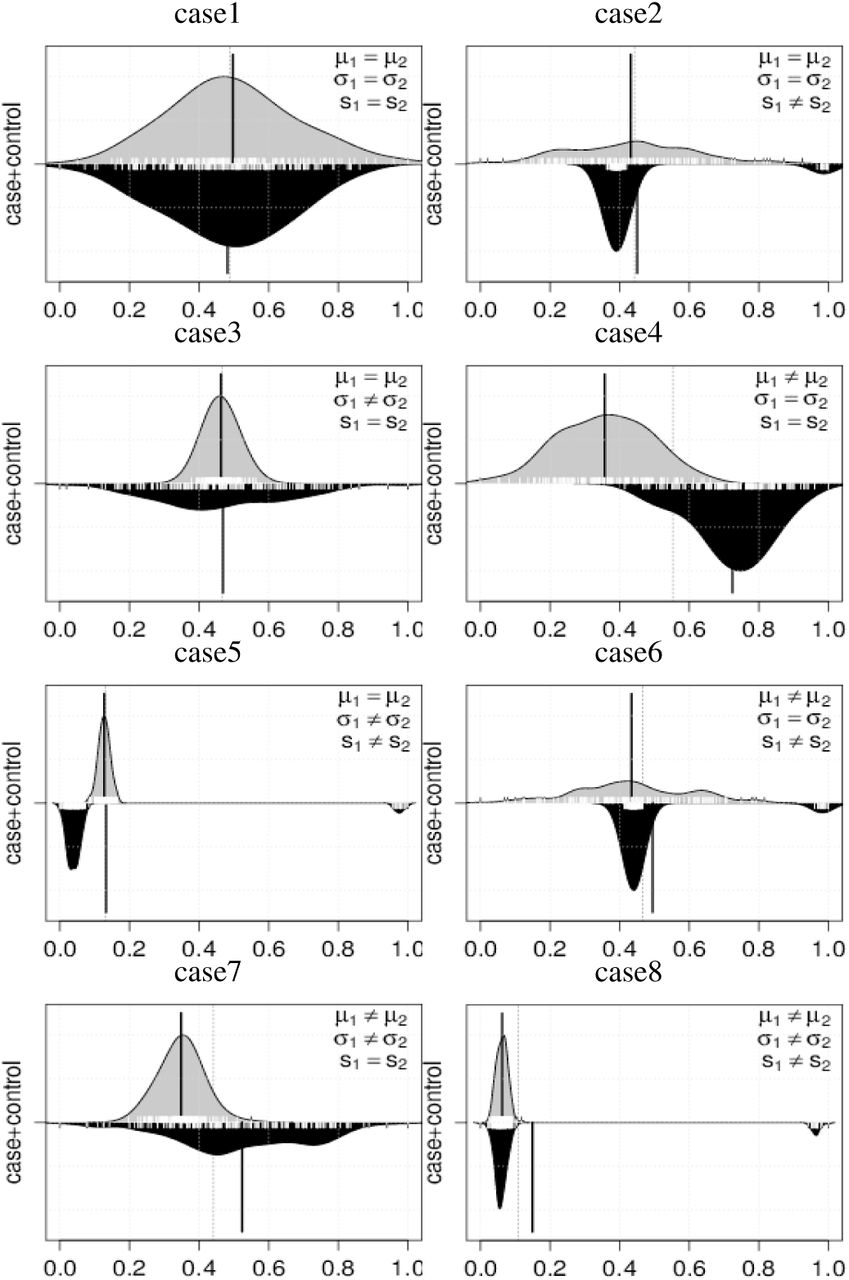
We describe the outline of the simulation as follows. We generate the data using two types of distribution. The control and case groups are represented by normal and normal mixture distributions, respectively. In each case, there are 300 samples; 160 and 140 for case and control group, respectively. The details of simulation models are shown in supplemental file S1. First, we evaluate type I errors in case 1 using 5,000 datasets. Next, we evaluate the power in cases 2-8 using 5,000 datasets for each group.
3.2 Simulation results
The results are shown in Table 2. In the first case, it is shown that error rates of D3M, DiffVar, KS, Welch, and WMM are close to the significance levels, which indicates that they effectively control type I errors. In contrast, MMD cannot control type I error at both of the levels of 5% and 1%, i.e., the significance level actually fails.
5,000 simulations in each case
Furthermore, we investigate the power with cases 2-8. KS detects most of the cases with low variance, with case 8 being an exception. However, KS cannot recognize the difference when the majorities of the two groups overlap with each other (Figure 1, case 8). DiffVar shows high power and low variance for cases where the variances differ. However, DiffVar might capture the other distribution features for the cases with equal variances, leading to uninterpretable results. In this simulation, Welch can appropriately distinguish only the mean difference. MMD succeeds in identifying shape differences in cases 2, 5, and 6. However, it decreases the accuracy in cases 3, 4, and 7, in which the mean and variance differ, and it cannot detect case 8. WMM can detect case 4, 5, and 7, but cannot detect cases in which the means differ under non-normality. D3M outperforms all these other methods and achieves promising accuracy in all cases.
4 ACTUAL EXAMPLE
4.1 Datasets
We apply our method to methylation data of glioblastoma multiforme (GBM) and lower grade glioma (LGG) from The Cancer Genome Atlas (TCGA). GBM is the primary brain tumor that progresses with malignant invasion destroying normal brain tissues (TCGA, 2008), arising through two pathologically distinct routes, de novo and as secondary tumors from LGG (Wiencke et al., 2006). In this analysis, we compare the methylation patterns in the LGG and GBM groups, and then specify the differential methylation sites. Detection of differential methylation patterns is a clue for revealing epigenetic mechanisms of development from LGG to GBM. We focus on mean, variance, and shape differences using Welch, DiffVar, and D3M and compare the results.
Here we briefly describe the datasets and preprocessing as follows. All the samples are hybridized to Illuminas Infinium HumanMethylation450K arrays, including 485,577 CpG sites, which is downloadable from TCGA portal sites. Each CpG site contains 145 samples and 530 samples in GBM and LGG, respectively. First, we remove CpG sites on the X and Y chromosomes and control probes. Missing values in both groups are inferred using R package <code>pcaMethods</code>. To distinguish the mean, variance, and shape components, we standardized the values by  to remove mean and variance effects. Finally, 394,363 sites were used for further analysis.
4.2 Analysis results
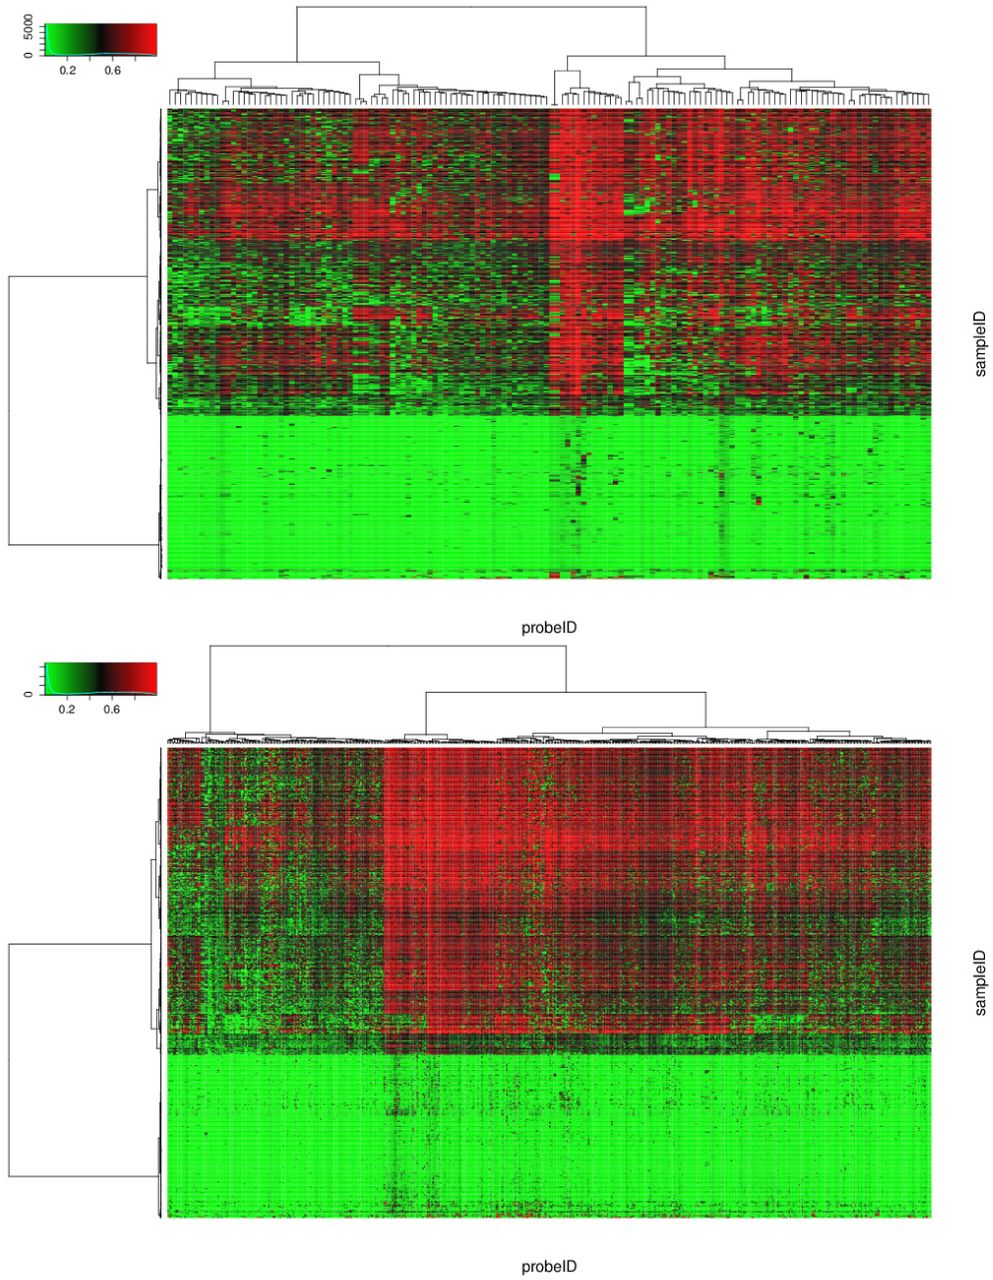
Significant differential methylation sites were identi?ed as those having p-values less than 1%. As a result, D3M, Welch, and DiffVar detected 55,796, 254,334, and 178,395 sites, respectively. Among them, we investigated sites with the smallest 1,000 p-values, including 568, 543, and 513 genes with D3M, Welch, and DiffVar, respectively. Heat map and Q-Q plots of the top 1,000 sites are shown in Figures 3 and 4. Comparing heat maps and Q-Q plots, the methylation patterns are easy to interpret in the latter. From the Q-Q plot, we could see that the top 1,000 sites tend to be hyper-methylated in LGG (with the reverse in GBM).


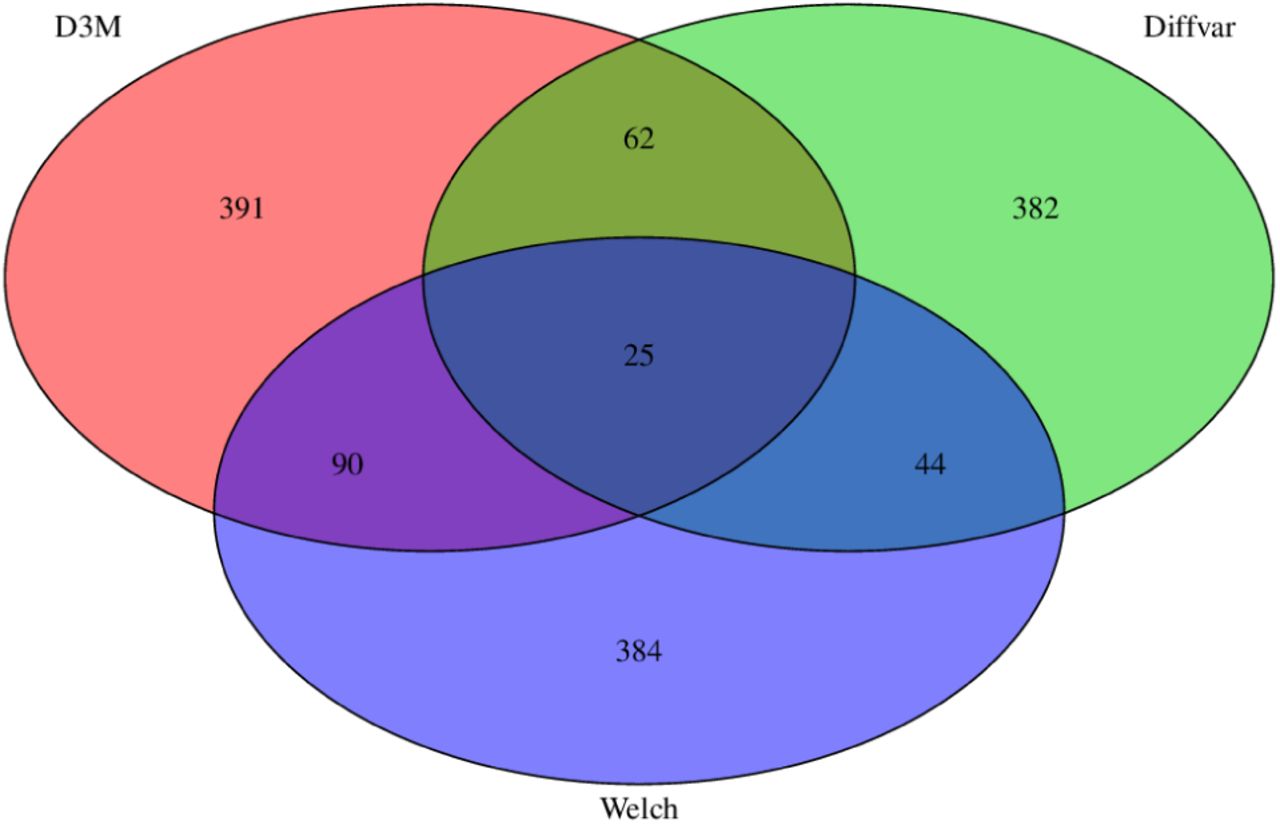
The Venn diagram shows the number of CpG sites tested for differential methylation using the three methods (Figure 2). The overlaps between D3M, Welch, and DiffVar are small, indicating that the differential methylation sites based on the shapes include distinct information not relevant to Welch and DiffVar.
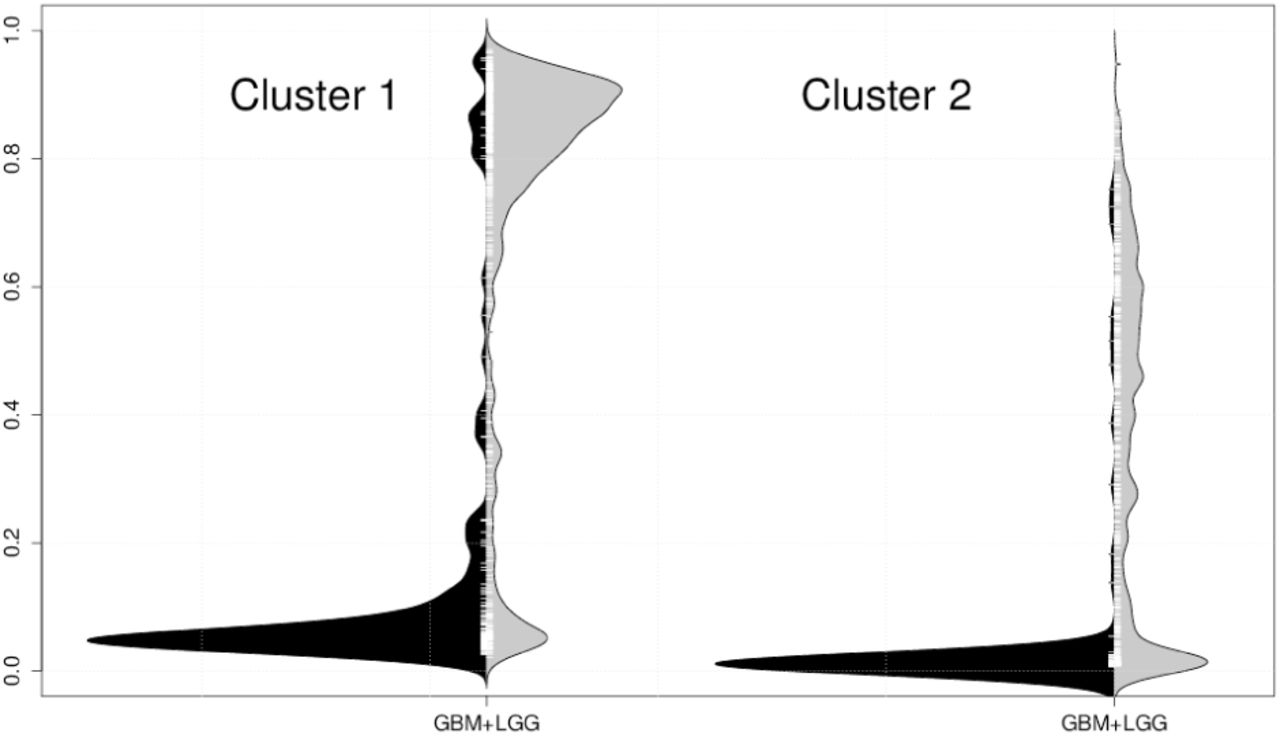
Among distributions of the top 1,000 sites, we can observe that there are mainly two distribution types in GBM, and we divide the 1,000 sites into two classes using the distributions in GBM. The clustering procedure is based on the Wasserstein metric (Irpino and Verde, 2014b). Clusters 1 and 2 contain 713 and 287 sites, respectively. Typical distribution examples in each cluster are shown in Figure 5. Cluster 1 shows two modes for distributions in GBM, whereas cluster 2 shows heavy-tailed distributions in GBM.
Next, we perform enrichment analysis on gene sets in clusters 1 and 2. We used ingenuity pathway analysis (IPA) for 423 and 184 genes in clusters 1 and 2, respectively, and significantly enriched pathways in each cluster using Fisher’s exact test. Table ?? shows ?ve pathways and related genes, ranked with p-values in each cluster.
Nearly all the pathways in clusters 1 and 2 have been previously reported as significant pathways in GBM, even though we do not include any information on GBM. The axonal guidance signaling pathway in cluster 1 has been suggested as prompting the cell invasion of GBM (Dominique, et al., 2007). The protein kinase A (PKA) pathway that is dysregulated has been considered to trigger the important steps to cancer genesis (Kiran, et al., 2005), and Prasad, et al., (2003) have indicated that PKA-activated c-AMP inhibits the proliferation and differentiation of GBM. The neuregulin signaling pathway in GBM is investigated by Patricia, et al., (2003), and the effects of death receptor pathway dysregulation is mentioned in Murphy, et al., (2013), Ziegler, et al., (2008), and Krakstad, et al., (2010). In cluster 2, the thioredoxin pathway has been found to play a key role in cancer, including GBM (Powis, et al., 2007; Yacoub, et al., 2010), and Lai, et al., (2014) show that the transcriptional regulatory network in embryonic stem cells is the most significant pathway with genome-wide methylation analysis in GBM. The remaining pathways might be explained elsewhere. Our prediction using D3M provides a hypothesis that DNA methylation in these pathways might cause the phenotypical difference between GBM and LGG.
We further focus on phosphatase and tensin homolog (PTEN) in neuregulin signaling and protein kinase A signaling pathways, and then compare the ranking based on p-value by D3M with those by other methods. The methylation of PTEN promoter is frequent in LGG and secondary GBM patients, but rare in normal and de novo GBM patients (John, et al., 2007). In our result, PTEN belongs to cluster 1, for which the distribution shape for LGG is bimodal, with the majority and minority being hyper-and hypo-methylation, respectively, and the distribution for GBM is unimodal with hypo-methylation. This suggests that demethylation of PTEN in some LGG might trigger transformation from LGG to GBM. PTEN is ranked 922nd out of 394,363 sites (0.23%) with D3M. However, PTEN is not included in the top 1,000 sites with Welch and Differ, being ranked 11,424th out of 394,363 sites (2.89%) with Welch and 10,856th out of 394,363 sites (2.75%) with DiffVar.
5 DISCUSSION
Here we summarize the advantages and disadvantageseps of D3M, DiffVar, and MMD, which have all been recently developed. These methods are designed for detecting differential methylation patterns focusing on cancer heterogeneity, which is caused by epigenetic instability and diversity. Cancer heterogeneity can often be confused with outliers. In fact, in our simulations and real data analysis, DiffVar, which is robust to outliers, regards important features of heterogeneity as outliers, and as a result, it fails to detect differential methylation sites. For example, DiffVar detects simulation case 2 as differential methylation, even though we set the mean and variance, but not the shapes, to be the same for the two groups. This is because DiffVar deals with minority distributions as outliers and evaluates only those in the majority.
In general, the significance of an outlier depends on the context of analysis (Aggarwal, 2013). When an outlier arises from measurement error not relevant to signals of interest, we must remove them prior to analysis. In contrast, when an outlier arises from an unusual event including new findings that we seek, we use them for further analysis. In this case, cancer heterogeneity could be regarded as an abnormal event compared with normal cases, and thus must be included in the analysis.
Pathways detected with the proposed method
MMD is designed to detect higher-order changes, such as shape in methylation profiles based on kernels (Mayo, et al., 2014). However, in our simulation, p-value does not work in the sense of type I error control. M3D based on MMD also cannot derive p-values, substantially just ordering distances over regions. Then, we cannot evaluate error rates probabilistically, which could be a crucial disadvantage when working with actual data.
D3M detects differences of all moments with underlying distributions based on the Wasserstein metric.
Simulation results indicate that D3M can detect not only shape differences but also mean and variance differences, as effectively as Welch and DiffVar. Thus, the proposed method can be applied to differential methylation analysis for general purposes. The limitation of D3M is that it requires sufficient sample size to construct distribution values to some extent. Empirically, because quantiles are used in the calculation of the Wasserstein metric, it requires at least 100 samples. The statistical test relies on resampling and requires computational time to calculate p-values. However, we could reduce the resampling time using a semi-parametric approach (Knijnenburg, et al., 2009).
6 CONCLUSION
In this study, we proposed a novel method, D3M, for detecting differential methylation sites based on distribution-valued data. We showed that distribution shape includes interesting information other than that found using mean-and variance-based methods. A simulation study indicated that D3M can detect differential methylation sites in various cases of distributions for which other methods, Welch, DiffVar, KS, MWW, and MMD, failed.
In the application to the GBM and LGG dataset in the TCGA cohort, we identified 1,000 sites with the smallest p-values. Most of the sites detected by D3M show strong heterogeneity and tend to be hyper-and hypo-methylated in LGG and GBM, respectively, as found in previous studies. Furthermore, mean-, variance-, and shape-based methods mutually detected differential methylation sites, because overlapped sites included up to approximately 20% of each other. Thus, distribution shape differences can provide new insights regarding methylation patterns.
Since the GBM and LGG dataset contains a large number of significantly different sites, including 55,796, 254,334, and 178,395 sites for D3M, Welch, and DiffVar, respectively, at the 1% significance level, it is difficult to understand the methylation patterns at these sites. In the future, it would be of interest to develop a method that describes the diversity of methylation patterns.


