

Abstract
Secondary contact is the reestablishment of gene flow between sister populations that have diverged. For instance, at the end of the Quaternary glaciations in Europe, secondary contact occurred during the northward expansion of the populations which had found refugia in the southern peninsulas. With the advent of multi-locus markers, secondary contact can be investigated using various molecular signatures including gradients of allele frequency, admixture clines, and local increase of genetic differentiation. We use coalescent simulations to investigate if molecular data provide enough information to distinguish between secondary contact following range expansion and an alternative evolutionary scenario consisting of a barrier to gene flow in an isolation-by-distance model. Although evidence for secondary contact is usually conveyed by statistics related to admixture coefficients, we find that they have no power to make the distinction. By contrast, the directionality index ψ that was proposed to study range expansion is informative. Additionally, we find that an excess of Linkage Disequilibrium and of genetic diversity at the suture zone is a unique signature of secondary contact. Our findings indicate that inference on secondary contact can be improved when explicitly accounting for the geographical locations of individuals.
1 Introduction
Hybrid zones are narrow regions in which genetically distinct populations meet, mate, and produce hybrids (Barton and Hewitt, 1985). Hybrid zones induced by secondary contact have often been observed in connection with the Quaternary glaciations (Hewitt, 2000). For instance, molecular markers suggest that the southern peninsulas of Europe were major ice age refugia of the European biota and that secondary contact occurred during the northward expansion which followed the last glacial maximum (Taberlet et al., 1998; Hewitt, 1999). With the advent of multi-locus molecular markers such as microsatellite or SNP data, hybrid zones can be investigated using various molecular signatures including gradients of allele frequency, admixture clines, and local increase of genetic differentiation (Nielsen et al., 2003; Adams et al., 2006; Strand et al., 2012; Bermond et al., 2012). Molecular or morphological clinal patterns provide evidence for secondary contact in various plant and animal species such as Arabidopsis thaliana (Huber et al., 2014), Silene vulgaris (Keller and Taylor, 2010), the grasshopper Oedaleus decorus (Kindler et al., 2012), the European hare Lepus europaeus or the parrotbill bird Paradoxornis webbianus (Qu et al., 2012) to name just a few examples.
However, typical molecular signatures of secondary contact zones can also occur under other evolutionary scenarios. For instance, admixture clines can be observed under pure isolation-by-distance models where nearby populations are connected through gene flow (Engelhardt and Stephens, 2010). Additionally, an increase of genetic differentiation can occur in isolation-by-distance models when there are barriers to dispersal (Riley et al., 2006). With the advent of landscape genetics, the search for barriers to gene flow has attracted considerable attention (Manel et al., 2003; Storfer et al., 2010). Although secondary-contact zones and barriers to gene flow are not mutually exclusive, because secondary contact is a non-equilibrium situation that converges to a migration-drift equilibrium (Endler, 1977), they convey different evolutionary paradigms. Models of barriers to gene flow are usually based on isolation-by-distance settings where neighboring populations are connected through dispersal (Safner et al., 2011; Blair et al., 2012). Around the barrier to gene flow, dispersal is lowered because of geographical or anthropogenic obstacles (Riley et al., 2006; Zalewski et al., 2009). By contrast, models of secondary-contact include an initial phase of evolutionary divergence between two populations or between two sets of populations. The phase of evolutionary divergence is followed by a phase of gene flow between the two divergent units at the secondary contact zone (Murray and Hare, 2006; Durand et al., 2009). Here, we use coalescent simulations to investigate to what extent molecular data provide information to distinguish between the two alternatives. For both evolutionary scenarios, we consider a one-dimensional range with isolation-by-distance as shown in figures 1 and 2.

1-dimensional secondary contact model in a nearest-neighbor stepping-stone environment with 100 demes.
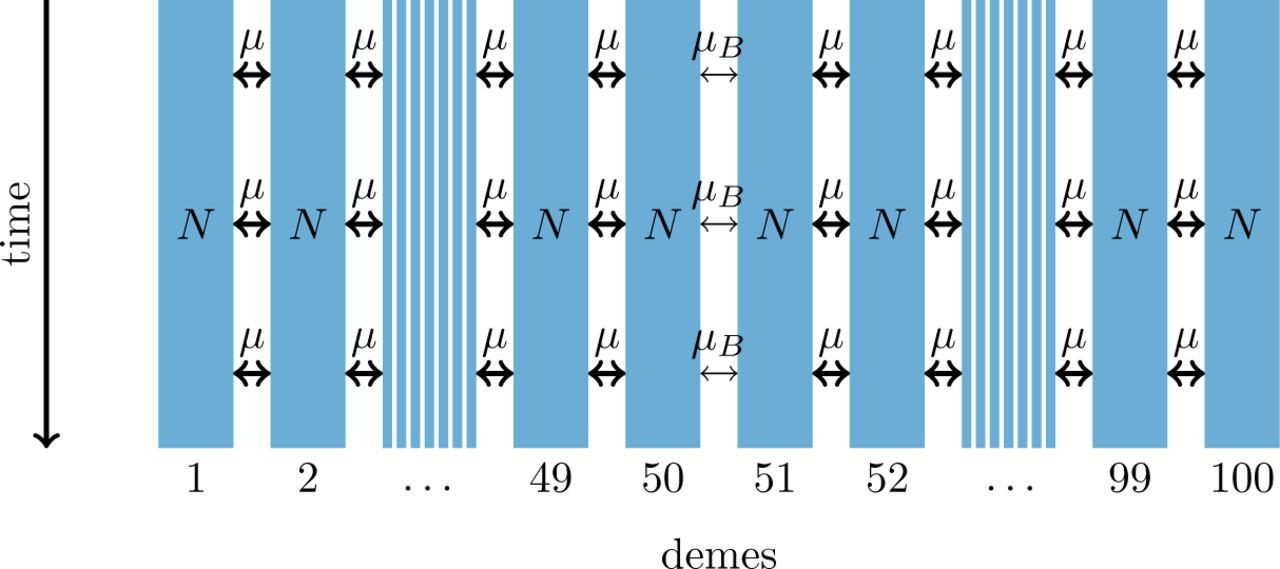
1-dimensional model of a barrier to gene flow in a nearest-neighbor stepping-stone environment with 100 demes.
For comparing the molecular signal left by the two distinct scenarios, we consider statistical measures that have been developed to provide evidence for different demographic processes. The first set of summary statistics we explore is typically used to detect hybrid zones. This first set contains measures of individual admixture coefficients between the parental source populations (Nielsen et al., 2003; Durand et al., 2009), a statistical test based on Linkage Disequilibrium (LD) where we explicitly test if a population results from admixture between parental source populations (Chakraborty and Weiss, 1988), and a measure of LD as we expect an increase of LD in admixed populations (McVean, 2002).
Secondary contact is frequently induced by geographical expansions of the ancestral populations (Hewitt, 2000), so the second set of summary statistics corresponds to measures of evidence for range expansion. We consider the recently developed directionality index ψ as it is sensitive to the occurrence of recent range expansion and it should distinguish between equilibrium and non-equilibrium models (Peter and Slatkin, 2013). The properties of the directionality index have not been studied yet when there are introgressive events. Furthermore, we include genetic diversity which has been shown to decrease along the expansion direction (Austerlitz et al., 1997).
The last set of summary statistics pertains to isolation-by-distance and barriers to gene flow. Numerical summaries indicative of barriers to gene flow usually measure genetic discontinuities, which are zones of sharp changes in allele frequencies (Manel et al., 2003). There are different ways to detect and measure them. Here, we use local FST defined as FST per unit of spatial distance. Local FST can be provided from multiple loci with georeferenced data by the software LocalDiff and we expect them to be larger around the barrier to gene flow (Duforet-Frebourg and Blum, 2014). The development of the software LocalDiff questioned the possibility of distinguishing between the two evolutionary scenarios under consideration (Duforet-Frebourg and Blum, 2014). Last, we include the decay of correlation between allele frequencies as a function of distance as it provides evidence of isolation-by-distance (Hardy and Vekemans, 1999).
2 Methods
2.1 Models
We consider secondary contact in a one-dimensional nearest-neighbor stepping-stone model consisting of 100 demes (figure 1). Range expansion is modeled as a series of founder events with moderate bottlenecks. Time is given in coalescent units before present time, i. e. in units of 2N generations where N is the diploid population size per deme at present time. Accordingly, all parameters are scaled with 4N.
The ancestral population is a random-mating population of size 2N. At time tS, it splits in two populations of size N.
From time tS to time tE, the two populations are in separate refugia (demes 1 and 100, respectively), the population sizes are constant, and there is no gene flow.
Starting at time tE, both populations expand towards each other in the stepping-stone geometry. At time points tE,tE–d, tE – 2d etc., 10% of the individuals of the deme at the expansion front colonize a new deme. Instantaneously, the size of both demes increases to N again and migration occurs at rate μ between neighboring demes.
From tC = tE – 48d until the present time, a stepping-stone model with 100 demes of size N is maintained with migration rate μ among the neighboring demes including demes 50 and 51 where secondary contact occurs.
As an alternative we investigate a nearest-neighbor stepping-stone model with a constant range of 100 demes and with reduced gene flow in the center (figure 2). The barrier to gene flow is modeled by a lower migration rate μB ≤ μ between demes 50 and 51.
DNA data of 20 chromosomes per deme is simulated with the coalescent simulator ms (Hudson, 2002). On each chromosome, we simulate 100 unlinked sequences consisting of 100,000 base pairs each. A sequence contains 100 SNPs and the scaled recombination rate within the sequence is 4.
In the secondary contact model we simulate data with parameters tS = 19, d = 1/8 and different durations since secondary contact occurred (from tC = 0,1,…, 5 until present time). In both models the scaled migration rate between neighboring demes is μ = 20. In the stepping-stone model we consider different barrier permeabilities (μB/μ = 0.002,0.01,0.02, 0.1, 0.2, 1; a value of 1 denotes no barrier). To provide means and standard errors of the summary statistics, each simulation is repeated 100 times.
2.2 Summary statistics
Hybrid zone summary statistics
Admixture coefficient
Based on the first principal component we compute an admixture coefficient for the pool of the five demes left of the barrier (Paschou et al., 2007; Bryc et al., 2010). The pools of the 5 leftmost and 5 rightmost demes are used as proxies for the two source populations. The admixture coefficient is defined as the average relative location of individuals in the putative admixted population with respect to the two source populations on the axis of the first principal component. It takes values between 0 and 1 and the larger it is, the higher is the proportion of genetic material inherited from the right source population (across the barrier or hybrid zone) through admixture.
The principal component analysis is conducted with the R function prcomp (R Core Team, 2012).
A test for admixture based on Linkage Disequilibrium (LD)
Let δi be the allele frequency difference between the two source populations at locus i. LD in the admixed population after t generations of admixture with migration rate m is given by
 where ρ is the recombination rate between loci 1 and 2 (Chakraborty and Weiss, 1988, eq. 3).
A significant correlation between LD and the product of differences of allele frequencies can be taken as a statistical evidence for admixture (Bray et al., 2010). Thus, we test admixture by computing P-values based on the Spearman correlation between LD and δ1δ2 using all pairs of SNPs that are part of the same sequence. The admixed and source populations are defined as for computing the admixture coefficient.
Linkage disequilibrium (LD)
The squared correlation coefficient between 1,000 randomly drawn pairs of SNPs within the same sequence is averaged over all unlinked sequences. LD is computed for each deme.
Range expansion summary statistics
Directionality index ψ
The directionality index ψ has been defined to detect a range expansion and infer its origin (Peter and Slatkin, 2013). The index uses the fact that populations further away from the origin of expansion have experienced more genetic drift. The index ψi,j is a pairwise measure between demes i and j that compares the average allele frequencies in the two demes: stronger drift yields higher differences in allele frequencies. Given that a range expansion has occurred, ψi,j should be negative if i is closer to the origin of the expansion than j, and positive otherwise. If ψi,j ≈ 0, both demes should be equally close to the origin of the expansion, or no range expansion has occurred. We compute values of ψ26,j with j = 27,…,50.
Genetic variability
The genetic variability is measured in each deme by the average number of pairwise nucleotide differences between all pairs of sequences, denoted by Δ.
Summary statistics for isolation-by-distance and barriers to gene flow
Allele frequency correlogram
The Pearson correlation between the allele frequencies of demes i and j is denoted by ri,j. We compute the correlogram r26,j for j = 27, … ,75.
Local FST
Local values of FST correspond to pairwise FST between neighboring demes (Duforet-Frebourg and Blum, 2014).
3 Results
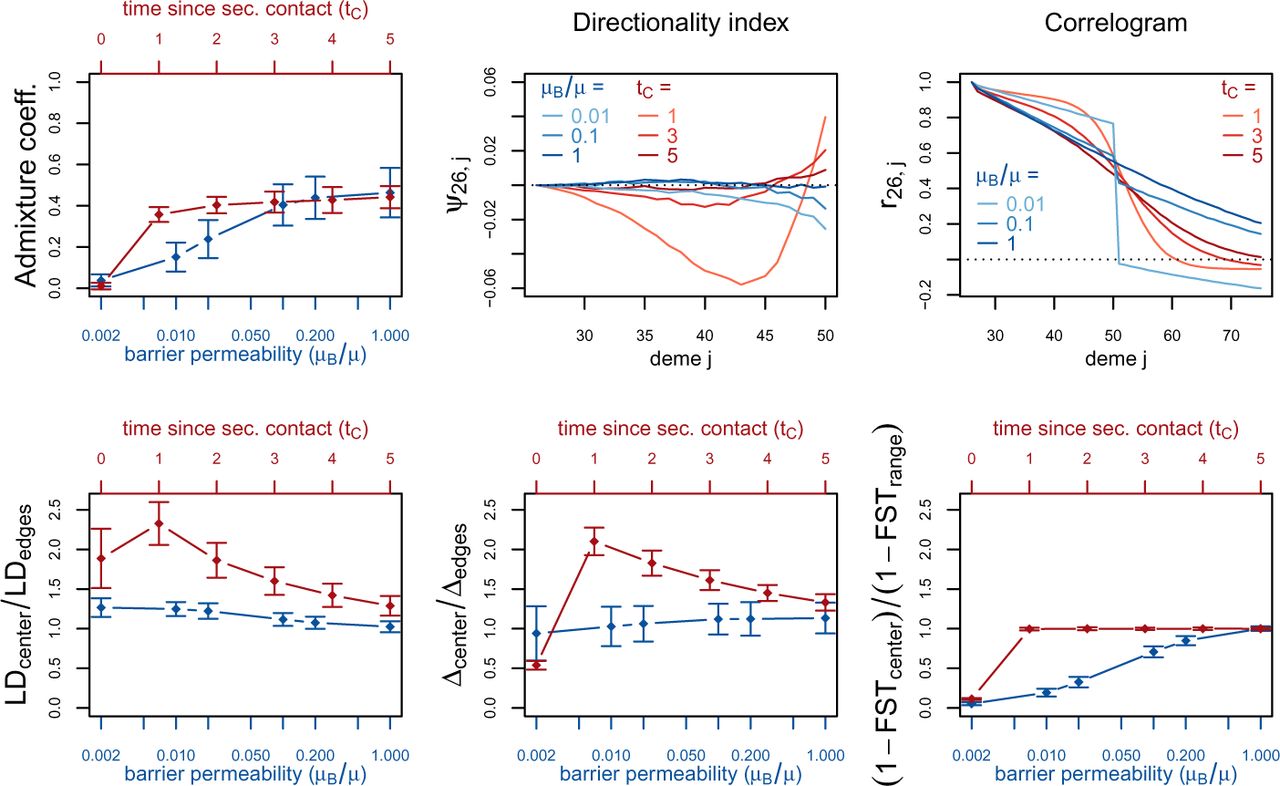
For the two different scenarios, we plot the summary statistics either as a function of the time since secondary or as a function of the intensity of gene flow across the barrier (figure 3). For the summary statistics that are computed per deme (genetic diversity Δ, LD) or per pair of neighboring demes (FST), we consider the pattern along the whole range of demes. The most important features are captured by the ratio between the values at the barrier or the suture zone, respectively, and the values to the left and right of it (see supplementary figures S1 and S2 for examples of the pattern along the whole range of demes).
Red (lines and axes): secondary contact model; blue: stepping-stone model with barrier. The barrier permeability μB/μ is plotted on a logarithmic scale with μ = 20. The dots denote the mean and the error bars ±2 standard errors, estimated from 100 replicates of the simulations. For Δ and LD, the subscript center denotes the mean over demes 49–52 and edges over demes 24–27 and 74–77. Here, center denotes demes 50 and 51 and range the mean over the neighboring demes in 26–74 except demes 50 and 51. (For these statistics, the edges of the range are dismissed because of the edge-effect in the stepping-stone model.) For the allele frequency correlogram and the ψ statistic, only the mean is plotted.
First, we consider the average admixture coefficient for the 5 populations that are located on the left-hand side of the barrier (demes 45–50). For the isolation-by-distance model with a barrier, these 5 populations are found to be admixed to an extent depending on the barrier permeability: when increasing the barrier permeability, admixture coefficients of individuals on the left-hand side of the barrier approach 50%. As expected, the populations are also found to be admixed in the secondary contact model (between 35% and 50%) except for the scenario where data is collected just before secondary contact occurs (tC = 0). When we consider the test for admixture based on Linkage Disequilibrium (table 1), we find that is has a power of 100% (α = 5%) to detect admixture after secondary contact (tC > 0). However, the test also rejects the null hypothesis of no admixture in the isolation-by-distance model very often (power ≥ 80% for μB/μ ≥ 0.01). Even for the weakest barrier permeability (μB/μ = 0.002), the null hypothesis is rejected in 62 out of 100 simulations.
Test for admixture based on LD. Left: Secondary contact model with different times since secondary contact (tC); right: stepping-stone model with barrier to gene flow of different intensities (μB/μ; μ = 20). The mean Spearman correlation coefficient over 100 replicates of the simulations. The column p < 0.05 gives the number replicates with coefficients that are significantly larger than 0.
The ratio between LD at the center (demes 49–52) and on both sides of the range (demes 24–27 and demes 74–77; demes closer to the edge of the range are skipped to avoid the edge effect; see supplementary figures S1 and S2) shows that LD is homogeneous along the whole range of demes for different barrier permeabilities in the stepping stone model with a slight increase at the barrier for low values of μB/μ. However, in the secondary contact model, LD is considerably increased in the secondary contact zone ranging from a more than 2 fold to an approximately 1.3 fold increase. The excess of LD in the center decreases as time since secondary contact increases.
Apart from random fluctuations, the directionality index ψ is constant for the stepping-stone model with constant migration rate (μB/μ = 1) as well as for very old secondary contact (tC = 5). More recent secondary contact results in a U-shaped pattern. The pairwise statistics ψ26,i, i = 27,…, 50 first decreases as expected when moving away from the origin of the expansion but it increases again towards the location of secondary contact. For the barrier model with a moderate and strong barrier (μB/μ ≥ 0.1), ψ26,i is constant for most of the range, but decreases slightly close to the barrier.
Under the stepping stone model, the number of pairwise differences (Δ) is approximately constant over the range of demes and hardly affected by the barrier. Conversely, in the secondary contact model Δ increases in the suture zone, but with more time elapsed since secondary contact it evens out along the whole range. Only when secondary contact has not occurred yet (tC = 0), the statistic Δ captures the effect of range expansion, which decreases the genetic diversity when moving away from the origin.
When considering the decay of allele frequency correlation as a function of distance, we find a sharp decrease around the suture zone or around the barrier, respectively. In the stepping-stone model, the correlation decreases linearly with distance and it drops sharply at the barrier, whereas in the secondary contact model we observe a sigmoid shape. For older secondary contact, the sigmoid decay converges towards the linear decay of the pure stepping-stone model.
Pairwise FST between neighboring demes is increased at the barrier to gene flow. The less permeable is the barrier, the larger is FST at the barrier compared to the rest of the range. In the secondary contact model, local FST is increased at the center when measured just before secondary contact occurs (tC = 0), but it is constant along the range of demes when secondary contact is already established (tC ≥ 1).
4 Discussion
Our results show that statistics related to admixture coefficients do not provide sufficient evidence for secondary contact following the isolation of populations in the presence of isolation-by-distance. The fact that isolation-by-distance seriously affects the ascertainment of population structure has already been largely documented (Novembre and Stephens, 2008; Frantz et al., 2009). Additional summaries of the data such as local values of FST or decay of correlation with distance were not more informative to support the occurrence of secondary contact.
By contrast, both an excess of Linkage Disequilibrium and genetic diversity at the suture zone are found to be unique signatures of secondary contact and informative about the timing of the establishment of secondary contact. Although the peak of diversity was initially thought to occur in glacial refugia (Hewitt, 2000), it has already been observed that the genetically most diverse populations were not located in southern Europe but at intermediate latitudes resulting from the admixture of divergent lineages that had expanded from separate refugia (Petit et al., 2003). Last, the directionality index ψ that has been proposed to detect range expansion has a distinctive U-shaped pattern when secondary contact follows range expansions (Peter and Slatkin, 2013). This statistic adds to the toolbox of population geneticists and provides one of the first attempts to distinguish between equilibrium and non-equilibrium spatial processes.
In our simulations we observe the re-establishment of the equilibrium state when secondary contact is old enough (Barton and Hewitt, 1985): eventually, all traces of secondary contact are lost and all summary statistics converge to the pattern of the stepping stone model (figure 3).
If secondary contact occurs at a barrier to gene flow, the difficulty of detecting the secondary contact from molecular data is increased. We consider additional simulations where secondary contact occurs in a region where gene flow is reduced by a factor of 10 (μB/μ = 0.1). In many respects, we see an intermediate pattern between the two previously considered scenarios, yet, genetic diversity, Linkage Disequilibrium and the directionality index ψ still provide evidence for secondary contact (supplementary figure S6).
Our simulation setting was designed to mimic the evolutionary history of species that have undergone a population split during the Quaternary glaciations with subsequent expansion and secondary contact. Assuming a generation time of 1 year and 1,000 diploid organisms per deme, it includes the time frame of expansion and secondary contact after the last glacial maximum in Europe. Species that had spent the last glacial period in southern refugia started to expand northwards around 16,000 years ago, and subsequently, many plants established a stable distribution around 6,000 years ago (Hewitt, 1999). We assume the ancestral population split up and started diverging 38,000 years ago (tS = 19) and the onset of the expansion varies from 16,000 to 6,000 years ago and lasted 6,000 years. Finally, secondary contact is established on the range of 10,000 years ago (tC = 5) to present time (tC = 0; in this setting, both populations have expanded, but no gene-flow has occurred yet). Our simulations show that the molecular signal of secondary contact vanishes after approximately 10,000 years.
To apply our results to a particular organism, parameters like the effective population size, the time of divergence and the expansion rate need to be calibrated. To assess the robustness of our results, we performed simulations of less extreme scenarios. We found that the same summary statistics are distinctive even with more moderate founder events, a lower expansion speed and higher migration rate between demes (supplementary section 2). However, we also observe that the footprint of secondary contact is more difficult to detect when the expansion is very slow or migration rates between neighboring demes are very high (supplementary figures S4 and S5). Even with these parameter settings where secondary contact is more difficult to detect, the directionality index ψ is a discriminant statistic and can detect the direction of a very slow expansion.
Our findings are relevant when investigating modes of speciation using computational approaches (Becquet and Przeworski, 2009). Secondary contact following divergence without gene flow (allopatry) is often compared to models of speciation where species start diverging while exchanging migrants (sympatry or parapatry) (Becquet and Przeworski, 2009; Duvaux et al., 2011; Roux et al., 2013). The different frameworks to study speciation are based on isolation-and-migration models, which do not account for the spatial and potentially continuous repartition of individuals (Pinho and Hey, 2010). As shown in the simulation study, accounting for spatial processes provides additional information that can partly be caught with the ψ directionality index, which has power to reveal evolutionary events such as secondary contact and range expansions. Accounting for space is a general recommendation that also stands when studying admixture between divergent populations of the same species (Patterson et al., 2012). Although isolation-by-distance is usually perceived as a confounding factor (Meirmans, 2012), the spatial sampling of individuals is in fact a chance to develop more powerful statistical approaches in evolutionary biology. Accounting for continuous populations should also be possible when performing simulations to choose the most probable scenario of speciation (Duvaux et al., 2011). Numerical simulators of genetic variation that account for the spatial repartitions of individuals are now available (Ray et al., 2010; Kelleher et al., 2013) and should encourage to study speciation models that reflect the complex spatio-temporal dynamics of species evolutionary histories (Alvarado-Serrano and Hickerson, 2015).
Acknowledgments
J. B. was supported by the Vienna Graduate School of Population Genetics (Austrian Science Fund (FWF): W1225-B20) and worked on this project while employed at the Department of Statistics and Operations Research, University of Vienna, Austria.
The computational results presented have been achieved using the Vienna Scientific Cluster (VSC) and the GenomeDK HPC cluster at Aarhus University.
References


