

Abstract
Mass cytometry or CyTOF is an emerging technology for high-dimensional multiparameter single cell analysis that overcomes many limitations of fluorescence-based flow cytometry. New methods are being published for analyzing CyTOF data attempt to improve automation, scalability, performance, and interpretation of data generated in large studies. However, most current tools are less suitable for routine use where analysis must be standardized, reproducible, interpretable, and comparable. Assigning individual cells into discrete groups of cell types (gating) involves time-consuming sequential manual steps untenable for larger studies. The subjectivity of manual gating introduces variability into the data and impacts reproducibility and comparability of results, particularly in multi-center studies. The FlowCAP consortium aims to boost user confidence in the viability of automated gating methods. We introduce DeepCyTOF, a standardization approach for gating based on a multi-autoencoder neural network. DeepCyTOF requires labeled cells from only a single sample. It is based on domain adaptation principles and is a generalization of previous work to more than two samples. We apply DeepCyTOF to two CyTOF datasets generated from primary immune blood cells: (i) 14 subjects with a history of infection with West Nile virus (WNV), and (ii) 34 healthy subjects of different ages. Each blood sample was labeled with 42 antibody markers at baseline and three different stimuli (PMA/ionomycin, tumor cell line K562, and infection with WNV). In each of these datasets we manually gated a single baseline reference sample to automatically gate the remaining uncalibrated samples. We show that DeepCyTOF cell classification is highly concordant with cell classification obtained by individual manual gating of each sample with over 99% concordance. Additionally, we apply a stacked autoencoder, which is one of the building blocks of DeepCyTOF, to cytometry datasets used in the 4th challenge of the FlowCAP-I competition and demonstrate that it over performs relative to all gating methods introduced in this competition. We conclude that stacked autoencoders combined with a domain adaptation procedure offers a powerful computational approach for semi-automated gating of CyTOF and flow cytometry data such that manual gating of one reference sample is sufficient for accurately gating the remaining samples.
1 Introduction
Flow cytometry (FCM) is routinely used in cellular and clinical immunology. Current fluorescence-based FCM experiments provide up to 15 numeric parameters for each individual cell from blood samples in a high-throughput fashion. This allows efficient multi-parameter characterization of single cell states. Interpretation of such data from hundreds-of-thousands to millions of cells is paramount to understanding the pathogenesis of a broad range of human diseases. Mass cytometry (CyTOF) is an emergent technological development for high-dimensional multi-parameter single cell analysis. By using heavy metal ions as labels and mass spectrometry as readout, many more markers can be simultaneously measured. Current CyTOF instruments allow users to probe over 40 antibody specificities and thus provide a significant improvement in analyzing the underlying cell sub-populations of a system [1, 2]. CyTOF provides unprecedented multidimensional immune cell profiling and has recently been applied to characterizing peripheral blood cells, Natural Killer cells in viral infections, skin cells, cells in celiac disease, responding phenotypes in cancer, and even holds the promise of examination of solid tumors [3, 4, 5, 6, 7, 8, 9, 10]. Cellular characterization by FCM and CyTOF will improve our understanding of disease processes [11].
Gating (assigning individual cells into discrete groups of cell types) is one of the important steps and a bottleneck of analyzing FCM and CyTOF data. It involves time-consuming sequential manual steps untenable for larger studies [12, 13, 14, 15, 16, 17, 18, 19]. The time it takes to manually analyze a cytometry experiment depends on the number of experimental units as well as the number of markers [20]. If the gating strategy is complex, the analysis time might increase dramatically. Technical variation naturally arises due to the variation between individual operators [21]. The subjectivity of manual gating introduces variability into the data and impacts reproducibility and comparability of results, particularly in multi-center studies [22]. Thus the slow processing time and the inherent subjectivity of manual analysis should be considered as primary reasons for using computational assistance methods.
The FlowCAP consortium aims to boost user confidence in the viability of automated gating methods [23]. Many of the pipelines described therein are tailored for exploratory, discovery-oriented data analysis. New methods for analyzing cytometry data attempt to improve automation, scalability, performance, and interpretation of data generated in large studies continue to emerge. These computational methods can be categorized as unsupervised or supervised approaches. Both types of approaches use a variety of simple linear transformations, density estimations, hierarchical clustering, and nonlinear projection methods, that together allow extracting features that can be used to study differences between samples. However, most current tools are less suitable for routine use where analysis must be standardized, reproducible, interpretable, and comparable [24]. In general, no automated gating algorithm or approach that would solve all specific computational problems has been accepted as the gold standard for replacing manual gating [23, 25].
In the last few years, deep learning methods have achieved outstanding performance in various computational tasks, such as image analysis, natural language processing, and pattern recognition [26]. These approaches have also been shown to be effective for extracting natural features from data in general settings [27, 28, 29]. Moreover, recent efforts to use deep learning approaches in genomics and biomedical applications show their flexibility for handling complex problems [30, 31, 32, 33, 34]. However, deep learning typically requires very large number of training instances and thus its utility for many genomic, proteomic and other biological applications is questionable. While in most genomics applications, the number of instances (e.g., number of gene expression arrays) is typically smaller than the number of variables (e.g., genes), in each FCM and CyTOF run we typically collect approximately 105 to 106 cells, so that the number of instances (cells) is several orders of magnitude larger than the number of variables (15 to 50 markers). Therefore, developing deep learning approaches to analyze cytometry data is very promising.
In the 4th challenge of the FlowCAP-I competition [23], the goal was to automatically gate 75% of cells in each sample based on manual gating of the remaining 25% of cells. We compare neural nets which were trained as stacked autoencoders to the other supervised competing approaches included in this challenge, and show that the neural nets outperform the competition winner and achieve state-of-the-art accuracy.
In addition, we present DeepCyTOF, an integrated deep learning neural network and domain adaptation framework, which employs one manually gated reference sample and utilizes it for automated gating of the remaining samples in a study. The net we construct is a generalization of DLID, a domain adaptation approach proposed by Chopra et al. [35], for the case of arbitrary number of samples, and is based on training a collection of autoencoders, and combining them into a single neural network. We used DeepCyTOF for automatic gating of two CyTOF datasets consisting of 56 and 136 samples respectively, and obtained almost identical results to those obtained by manual gating. We demonstrate that by utilizing manual gating of a single reference sample in each of these datasets, DeepCyTOF can achieve high quality automatic gating for the remaining samples and significantly reduce the time and effort that are currently required for manual gating. Finally, by simulating uncalibrated samples by transforming one CyTOF sample in multiple different ways, we demonstrate that DeepCyTOF is capable of calibrating the simulated samples such that automated gating of these samples leads to highly accurate cell classification.
The structure of this manuscript is as follows: in Section 2 we describe the datasets and algorithms used in this research. Experimental results are given in Section 3. Section 4 concludes this manuscript. Experimental details are given in an appendix.
2 Materials and Methods
Throughout this manuscript, we use the terms sample and subject as follows: a sample is a collection of measurements of cells, belonging to a single subject.
2.1 Datasets
2.1.1 FlowCAP-I Datasets
We employed five FCM datasets from FlowCAP-I [23]: (1) Diffuse large B-cell lymphoma (DLBCL), (2) Symptomatic West Nile virus (WNV), (3) Normal donors (ND), (4) Hematopoietic stem cell transplant (HSCT), and (5) Graft-versus-host disease (GvHD). With the results from manual gates produced by expert analysis, the goal of FlowCAP-I challenges was to compare the results of assigning cell events to discrete cell populations using automated gates. In particular, we consider Challenge 4: supervised approaches trained using human-provided gates. We use the manual gating provided from FlowCAP-I to evaluate the predictions of our algorithm in Section 2.2.1.
2.1.2 Mass Cytometry Datasets
We employed two CyTOF datasets generated in the Montgomery Lab. The datasets consist of primary immune cells from blood of (1) N = 14 subjects (8 asymptomatic and 6 severe) with a history of infection with West Nile virus (WNV), and (2) N = 34 healthy subjects of different ages (20 young and 14 old). Each blood sample was labeled with d = 42 antibody markers [5] (Table 1) and was subjected to four CyTOF experiments including a baseline state and three different stimuli (PMA/ionomycin, tumor cell line K562, and infection with WNV). The goal is to classify each cell to one of 6 cell type categories: (1) unlabeled, (2) B cell, (3) CD4+ T cell, (4) CD8+ T cell, (5) Monocytes, and (6) Natural killer (NK) cells. This task involves additional challenge due to calibration differences. Specifically, different subsets of the data were measured at different times; fine changes in the state of the CyTOF instrument between those times thus introduce additional variability into the measurements. The specific nature of these changes is neither known nor modeled. To tackle this problem and apply a gating procedure, most practitioners in the field calibrate the samples by applying an experimental-based normalization procedure. This procedure involves mixing samples with polystyrene beads embedded with metal lanthanides, followed by an algorithm which enables correction of both short-term and long-term signal fluctuations [36]. Once the data is normalized, most practitioners in the field apply a manual gating procedure.
2.1.3 Simulated Datasets
Starting from a single manually gated CyTOF dataset, we generated 50 simulated samples where each simulated sample corresponds to a (different) change in the calibration of the CyTOF machine. This collection of datasets was used to test whether DeepCyTOF is capable of overcoming calibration differences between samples. A detailed mathematical formulation of the data generation process appears in Appendix C.
2.1.4 Pre-processing
The only pre-processing performed on the FlowCAP-I, the Mass Cytometry datasets and the simulated datasets are a logarithmic transform, followed by Principal Components Analysis (PCA) and rescaling, as described in Appendix B.
2.2 Algorithms
2.2.1 Stacked autoencoders
An autoencoder is a single hidden layer neural network, which is trained to reconstruct its input [37]. The number of units in any hidden layer of the autoencoder is typically smaller than the input dimension, hence a trained autoencoder can be viewed as a tool for nonlinear dimensionality reduction. The map from the input representation to the hidden representation is usually called encoder. The map from the hidden layer to the output layer (which is a reconstruction of the input) is called decoder. It is widely known that the reconstruction of the data from the code space is often “cleaner” than its original representation [38]; hence the autoencoder can also be viewed as a denoising tool.
A stacked autoencoder is a multi-layer neural net, which is trained bottom-up in an iterative fashion, where in each iteration, a single layer is trained as an autoencoder [39]. Once the layer is trained, one uses it to compute a new representation for the data. This representation is then used to train the following layer and so on. Once a stacked autoencoder is trained, one may add a classifier on top of it (a softmax is a popular choice), and then fine-tune the entire neural net using standard backpropagation [40]. Such approach has been widely popular in deep learning applications e.g., [41]. Notably, autoencoders are trained in an unsupervised fashion [42, 43, 44], hence do not require labeled data. The final fine-tuning step for the specific classification task naturally requires labeled data. However, it was empirically shown that the number of labeled examples can be relatively small, where the data contains regularities which are captured by the autoencoders. Hence, such an approach is particularly useful in applications where the number of unlabeled examples is large while the number of labeled ones is small [28].
The full architecture of our stacked autoencoders consists of three fully connected hidden layers with sigmoid nonlinearity, and a softmax regression layer on top. The number of hidden nodes in each layer has been set to 20, 10, and 3, which we found to work well in practice. A scheme of such stacked autoencoder is shown in Figure 1.

Stacked autoencoder for gating cell populations
2.2.2 DeepCyTOF
Domain Adaptation is a set of techniques that allow to use a learning scheme (or a model) trained on data from a source domain with a given distribution and can also be applied to another domain with a related but not equivalent distribution. The objective of domain adaptation is to minimize the generalization error of instances of the target domain [45],[46]. In FCM and CyTOF experiments, variation in both biological and technical sources makes automatic gating challenging. Health condition and instrument calibration cause variation across samples; hence, in order to avoid gating each dataset separately (which therefore requires labeled samples from each dataset), a domain adaptation procedure might be helpful.
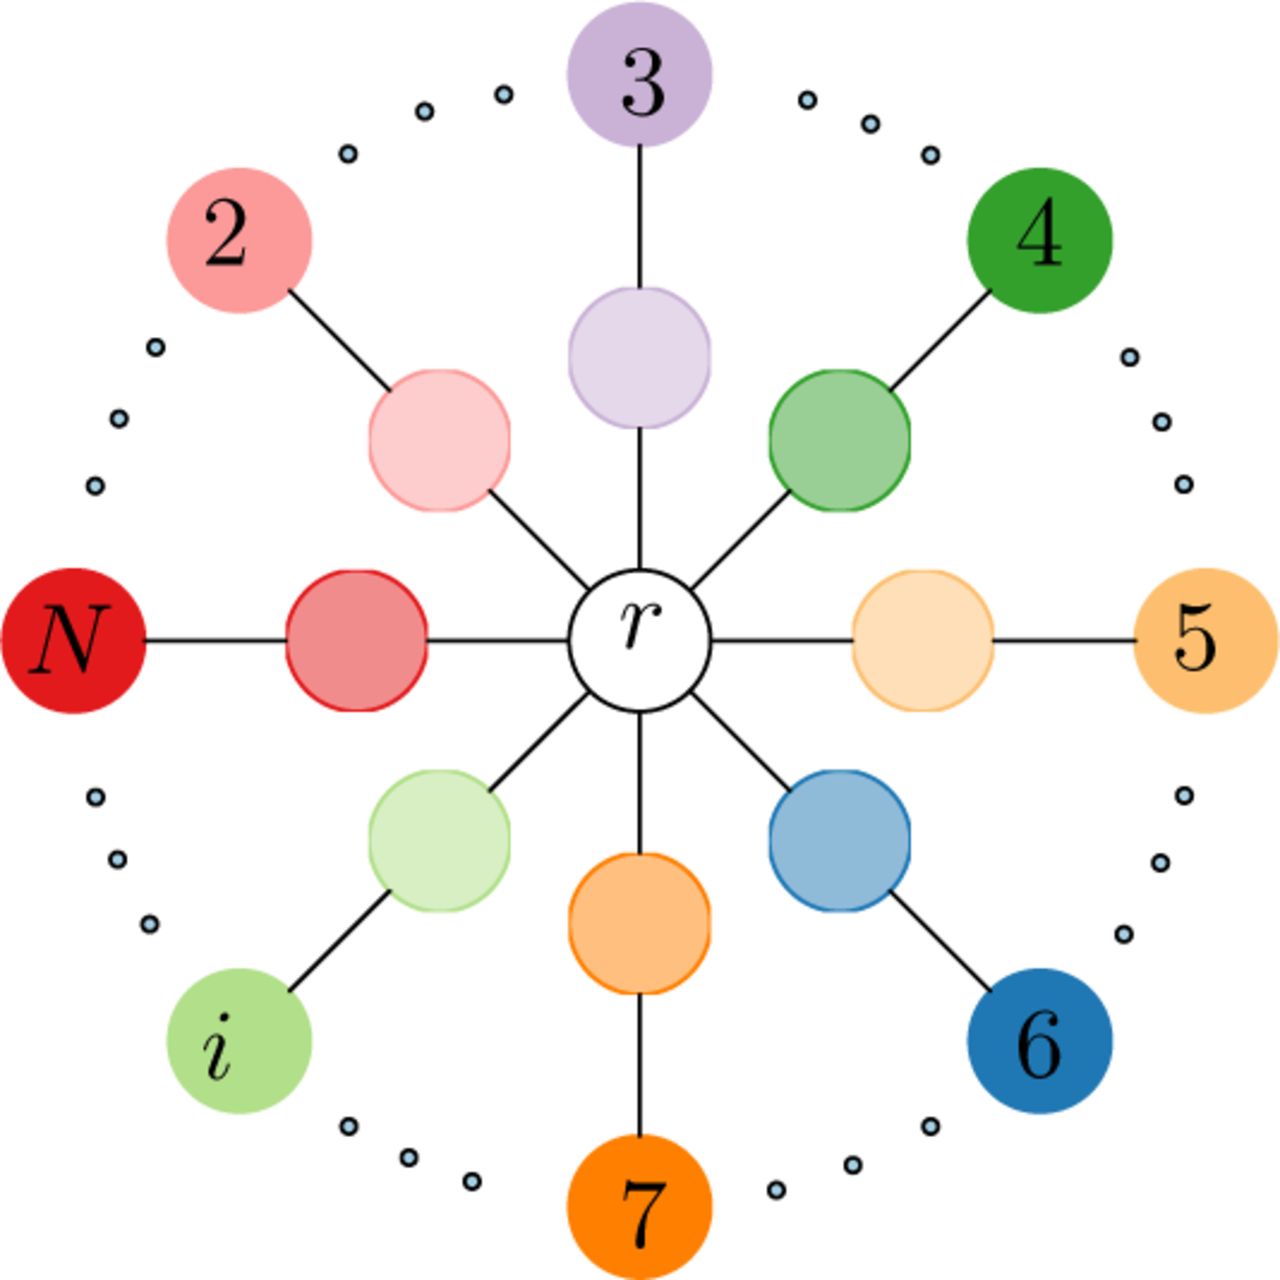
DLID [35] is a deep learning domain adaptation approach that is based on creating “intermediate” datasets, in each of which the training and test distributions are mixed. The original approach is formulated for the case of two distributions, and outputs a classifier that is trained using labeled data from one distribution and operates well on instances from either distribution. In this work, we generalize the approach to arbitrary number of datasets, which results in a star-like topology (see Figure 2), as follows: first, for each of the N samples whose data are represented by d-dimensional inputs, we calculate the d x d covariance matrix. We then measure the Frobenius norm of the difference between any pair of these covariance matrices, and pick the sample that has the minimum mean distance to all other samples. We call this the reference sample r with respect to all the others. Next, we train an autoencoder on the reference sample r (i = 1). In addition for each subject i > 1 we train two stacked autoencoders: one using the data of sample i and the other one using random mixtures consisting of 50% cells from sample i and 50% cells from r (see Figure 3).

A star graph representing multiple autoencoders. Autoencoders are constructed for the reference sample (r), for each sample in the study as shown in the outer circle (i = 2,…, N), as well as for a mixture of each sample in the study with the reference sample as shown in the inner circle (where each mixture consists of 50% randomly selected cells from the sample in the same branch of the star graph and 50% randomly selected cells from the reference sample)

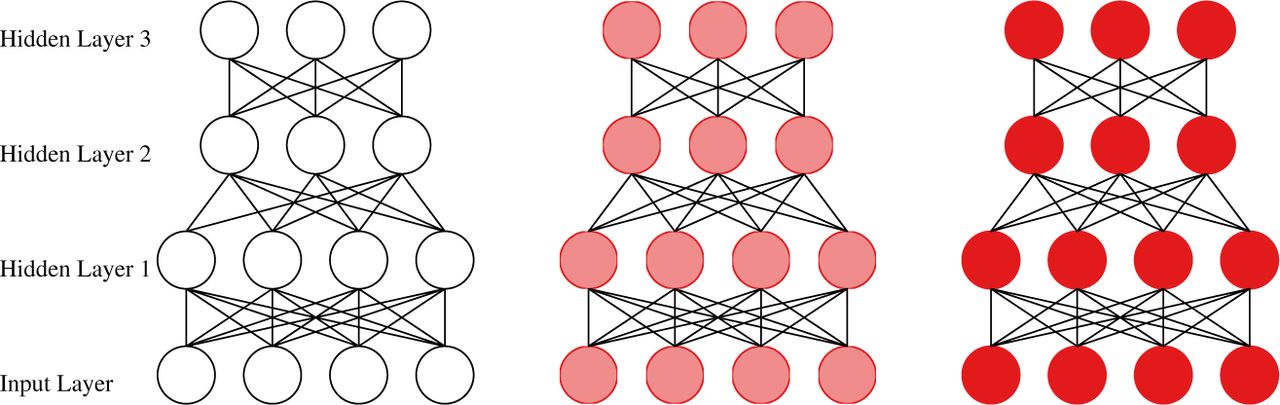
Unsupervised pre-training steps of DeepCyTOF: three stacked autoencoders are applied to reference sample r (open circles), sample i (red circles), and an intermediate dataset (pink circles), in which the cells from samples r and i are mixed with equal proportions.
Subsequently, we combine these 1 + 2(N — 1) autoencoders to a single large neural net, add a softmax layer on top and fine-tune the net using labeled data obtained by manual gating from subject r only. During the fine-tuning step, the two stacked autoencoders in each branch of the star are connected; each branch is also connected to the stacked autoencoder of the reference sample, as depicted in Figure 4, so that the star graph functions as a single network, with a classifier as its upper layer.

Connectivity between the autoencoders of each branch of the Star graph in the fine tuning step. The two stacked autoencoders on every branch of the Star are combined to a single neural net. The reference sample is connected to each branch. A single softmax classifier is connected on top of the last hidden layer of all stacked autoencoders.
2.3 Comparison of auto and manual gating
To compare the stacked autoencoders approach of Section 2.2.1 with algorithms from the 4th challenge of the FlowCAP-I competition, 25% of the cells of each subject from the FCM datasets in FlowCAP-I were labeled by manual gating and used in the unsupervised pre-training and fine-tuning steps implemented in our algorithm, leaving 75% of the remaining cells for testing. To perform semi-automated gating of all samples of each of the two CyTOF datasets based on their respective reference samples, we use all the baseline (unlabeled) samples for the unsupervised pre-training and a single baseline (labeled) reference sample r to fine-tune the net, leaving all samples that undergo three different stimuli (PMA/ionomycin, tumor cell line K562, and infection with WNV) for testing.
The F-measure statistic (the harmonic mean of precision and recall) was used for the evaluation of our methods as described in [23]. The F-measure for multiple classes is defined as the weighted average of F-measures for each cell type against all other classes. An F-measure of 1.0 indicates perfect reproduction of the manual gating with no false positive or false negative events. For any given dataset, we create several bootstrap datasets (by sampling with replacement), compute the F-measure on each and report the mean and standard deviation of the F-measure.
3 Results
In this section, we present results from three experiments. First, we use stacked autoencoders to perform cell classification on each of the five FCM datasets from the FlowCAP-I competition. Second, we apply DeepCyTOF onto two CyTOF datasets and demonstrate how combination of deep learning and domain adaptation procedures can effectively eliminate the need for manual gating of all samples in a study. Finally, we use simulated datasets to demonstrate the ability of DeepCyTOF to overcome substantial calibration differences.
3.1 Evaluation of classification performance from FlowCAP-I
The prediction is performed by training a stacked autoencoder (as described in Section 2.2.1) on each dataset. Each stacked autoencoder had three fully connected hidden layers and a softmax layer on top. Table 2 presents the performance of the stacked autoencoder when applied on the five datasets from the 4th challenge of FlowCAP-I. The performance of stacked autoencoder is compared to the performance of the respective winner of each of the five datasets in the FlowCAP-I challenge 4 competition.
As can be seen in Table 2, the stacked autoencoders performs better in four out of the five datasets and similarly on the HSCT dataset.
3.2 Validation of DeepCyTOF by analysis of two mass cytometry datasets
In this experiment we applied DeepCyTOF as follows: we first constructed two star graphs for each of the two datasets using the 14 and 34 baseline samples of these datasets respectively. Then, we connected the stacked autoencoders to a single network as in Section 2.2.2, and fined-tuned it using labeled data from the reference sample. We then used this classifier to classify cells from the non-reference samples (55 samples from the Asymptomatic vs. Severe WNV dataset and 135 samples from the Old vs. Young dataset) and compared to the performance of a linear classifier (softmax). Table 3 summarizes the results.
Table 3 illustrates some interesting points: first, DeepCyTOF achieves nearly perfect performance on the test data. Second, DeepCyTOF performs significantly better than softmax regression, which may be a result of the depth and the non-linearity of the network. Third, whether or not the data is normalized [36] does not affect the performance of DeepCyTOF.
Figure 5 shows the embedding of the labeled cells in a three dimensional space, obtained from the top hidden layer of a stacked autoencoder (after fine-tuning). As can be seen, most of the labeled cells concentrate in well separated clusters representing specific cell types and only a few cells fall between these clusters.

3rd Hidden layer Representation of a blood sample (the unlabeled cells are omitted). Different cell types are concentrated in different regions of the code space.
3.3 Evaluation of classification performance from simulated data
To test the capability of DeepCyTOF to overcome substantial calibration differences, we performed an analysis based on simulated data. As described in Appendix C, we used a real baseline sample to generate 50 samples, each of which differs in calibration from the baseline sample, where the calibration difference depends on the sample, marker and cell type. We first constructed a star graph using all 50 samples where the center of the star is the reference sample. Then, we connected the stacked autoencoders to a single network as in Section 2.2.2, and fined-tuned it using labeled data from the reference sample. We used this classifier to classify cells from all 50 samples. The 95% confidence interval of the F-measure is (0.996, 0.999). This demonstrates how the domain adaptation component of DeepCyTOF allows one to perform automatic gating even in scenarios where the multi dimensional marker distribution of the labeled reference training data differs significantly from the corresponding distribution of the unlabeled test data. For comparison, a softmax classifier, trained on the reference sample, achieves a confidence interval of (0.886, 0.930).
4 Discussion
In this work, we showed that deep learning machinery, and stacked autoencoders in particular, can be very effective in classification of cell types; the performance substantially surpassed the predictive accuracy of the methods presented in the 4th challenge of the FlowCAP-I competition. In addition, we introduced DeepCyTOF, an automated framework for gating cell populations in cytometry samples. DeepCyTOF integrates deep learning and domain-adaption concepts. The labels obtained by manual gating of the reference sample were utilized in a domain-adaptation manner. These steps enable DeepCyTOF to inherently calibrate the major cell populations of multiple samples with respect to the corresponding cell populations of the reference sample. We analyzed 192 CyTOF samples and observed nearly identical results to those obtained by manual gating (with F-measure > 0.99).
In practice, run-to-run variations in CyTOF experiments both in the same instrument and between instruments are very common. These variations lead to significant batch effects in the datasets with samples collected at different runs. As a result, noticeable differences between the data distributions of the training data (manually gated reference sample) and the remaining unlabeled test data (the remaining samples) are observed, and an approach such as domain- adaptation is required to remove these biases. Bead-normalization is an approach introduced to mass cytometry as a pre-processing step to diminish the effect of such variations [36]. Interestingly, application of DeepCyTOF to unnormalized and bead-normalized data did not show an advantage of using the latter for the task of automated gating. Our domain-adaptation approach allows us to effectively normalize different distributions for the (supervised learning) task of automated gating via introduction of intermediate representations of cytometry data, each consisting of instances from the reference (gated) distribution mixed with instances from a given un-gated distribution. A combined representation that encompasses the representations of all samples and their mixtures with the reference sample was designed to facilitate the classification of discrete groups of cell populations.
Flow cytometry and mass cytometry experiments provide us with multivariate data with dimensionality ranging between 10-40. Transforming the raw multivariate data to other representations may offer advantages for tasks such as automated gating or calibration. Finding good representations can be done either by manual investigation (hand crafting) or automated approaches. In recent years deep learning approaches have been shown to be suitable for learning useful representations of data in the sense that they provide new sets of features that makes subsequent learning easier. Furthermore, it has been shown that pre-training unsupervised steps such the ones we implemented in DeepCyTOF can improve the learning tasks [47], especially, when labeled training data is scarce. Cytometry experiments provide us with large datasets of unlabeled cells, which makes the unsupervised pre-training steps in the construction of a deep neural network applicable.
As cytometry analyses become widely used in research and clinical settings, automated solutions for analyzing the high dimensional datasets are urgently needed. Current practice in which samples are first subjected to manual gating are slowly substituted by automatic gating methods [48]. Major contributions to between-sample variations in cytometry experiments arise not only due to biological or medical differences but due to machine biases. Here we demonstrated that a novel machine learning approach based on deep neural networks and domain adaptation can substitute manual gating as they both produce indistinguishable results. In future work, we will demonstrate that deep learning approaches could address other challenges in analyzing cytometry data. This include tasks such as unsupervised calibration of samples, and feature extraction for classification or visualization of multiple samples.
Acknowledgement
The authors would like to thank Catherine Blish for CyTOF reagents, Ronald Coifman, and Roy Lederman for helpful discussions and suggestions. This research was partially funded by NIH grant 1R01HG008383-01A1 (Y.K.).
A Notation
The kth sample is denoted A(k), and is a nk × d real valued matrix, where nk denotes the number of cells and d is the dimension of the input.
B Data Pre-processing
Given N blood samples A(k) for k = 1, 2,…, N, we first perform the elementary logarithmic transformation

Next, we apply Principal Components Analysis (PCA) on a single arbitrary sample A(k) and use the projection matrix to project all other samples. In our experiments we used the first 20 principal components. Finally, we rescale each column of A(k) to [0, 1]. This is desirable when sigmoid activations are used for the output units of an autoencoder.
C Simulation
Starting from a real blood sample A(1), we calculate the mean of each cell population for each marker. Let μ be a 6 by d matrix such that μt,j is the mean intensity of marker j in cell type t.
Let Δ be defined as
 for some positive constant C and let ε be vector of d i.i.d. normal random variables. We now generate N matrices A(k) with k = 1, 2,…, N by perturbing A(1) as follows
 where
where  is the ith row, jth column of matrix A(k) and t(i) is type of the ith cell in A(1). The difference between subjects can be controlled by changing the value of C.
In summary, the datasets are generated so that each simulated dataset corresponds to a different data transformation of a single real dataset. The additive transformations of each marker in each cell type were implemented with different intensity Δk for each simulated dataset. In our study, we choose N = 50 and C = 25.
References


