

Abstract
Background: The seasonality of influenza is thought to vary depending on changes in environmental factors, human contact, and travel patterns. During winter holidays, when children are out of school, typical patterns of potential disease-causing contact and travel change. The aim of this research is to understand the impact of winter school holidays on age-specific and spatial flu transmission, and the resulting size and spread of the epidemic. We hypothesize that reduced contacts among children during school holidays will lower their infection rates, infection rates among adults will subsequently decrease as fewer children are sick, and increased travel during the holidays will hasten the spread of flu across the country.
Methods: Using aggregated medical claims data from physician offices and hospitals in the United States, we examined influenza dynamics before, during, and after the winter holidays from 2001 to 2009. We quantified the changes to transmission and characterized holiday-associated changes to epidemic trajectories among children and adults in a spatial context. Informed by this empirical evidence, we used a deterministic, age-specific spatial metapopulation model to compare models with and without holiday-associated behavioral changes to understand the effects of holidays on flu season trajectories and spatial spread.
Results: In analyzing eight seasons of medical claims data, we observed a mean 15% drop in the effective reproductive number immediately after Christmas. Rates of influenza-like illness among children experienced a sharp dip and recovery during and after the holidays, while adults experienced more gradual dips and recoveries during these periods. The model results demonstrated that both child and adult flu incidence dipped during the holiday period, but trends among adults lagged those in children. The peaks of the child and adult flu epidemics were delayed when the holiday was introduced, but the attack rate did not change significantly for either age group. In the medical claims data and the model-generated data with the holiday, the spatial synchrony of epidemic trajectories before and after the holiday remained similar. In the model-generated data without the holiday, however, epidemic trajectories became spatially asynchronous.
Conclusions: Our work suggests that winter holidays delay the epidemic peaks and increase the spatial synchrony of natural trajectories for seasonal influenza in the United States every year. These findings have implications for the design of influenza intervention strategies, such as the proper timing and duration of school closures, and the spatial and demographic reallocation of vaccines.
Introduction
Consideration of age group patterns is an important component to understanding the transmission and relative disease burden of influenza. While infants and the elderly are traditionally considered the high-risk groups for severe flu outcomes [1], distinctive signatures in the relative disease burden between children and adults also provide important epidemiological insights related to epidemic timing and severity in seasonal and pandemic flu settings [2, 3, 4, 5]. Empirical contact surveys have illustrated that individuals tend most to associate with others in a similar age group and school-aged children tend to have the greatest number of potential disease-causing contacts [6, 7], and that social mixing by age is sufficient to capture much of the heterogeneity in contact across populations [8, 9]. In large population settings, school-aged children are thought to drive local transmission of flu due to their large number of contacts, while adults are thought to seed flu in different locations due to their global mobility [10, 11].
Since schools and school-aged children are of particular importance for influenza transmission, temporary school closures are commonly considered as a reactive intervention in pandemic and severe flu seasons [12, 13]. However, empirical studies of the effect of these interventions varies from no significant effect on flu transmission, to reducing transmission by 29% in children alone [14, 15, 16]. Due to these mixed results, the impact on children and the subsequent trickle-down effects to other age groups remains unclear.
While school holidays have similarities to closures, they occur at predetermined times and induce changes to both contact and travel patterns. In the United States, the Christmas holiday occurs in late December and U.S. epidemics typically peak in late February; changes in flu transmission during the winter holidays could crucially affect the resulting flu epidemic [17]. The number of contacts between children decreases as children are out of school for the holiday [18], and travel increases, particularly for children, as people visit their families [19, 20]. Studies suggest that winter school holidays may reduce or delay the risk of influenza among school-aged children by 33–42%, but the trickle-down effects to the remainder of the population are unknown [21, 22]. Other studies have examined the effects of holiday travel on influenza spread [23, 24], but the two processes of contact and travel patterns have not been studied in conjunction.
Our work aims to determine the impact of changing contact and travel patterns during winter holidays on influenza transmission and the resulting epidemic trajectories. With U.S. medical claims data, we examine changes in flu transmission during and after the holidays, and characterize common patterns in the rates of influenza-like illness among school-aged children and working-aged adults during the holiday period across multiple flu seasons. To understand the mechanisms behind these empirical patterns, we create an age-specific spatial metapopulation model to study the interactions among child and adult populations and the importance of air travel in spatial spread. The model allows us to compare a model with holiday-associated behavioral changes at the beginning of the epidemic, to a baseline model where the parameters remain fixed over time. Using a combination of empirical and theoretical approaches, our work considers the impact of school holidays and holiday travel on overall transmission and epidemic trajectories, age-specific patterns, and spatial spread of seasonal influenza across the United States.
Methods
Empirical analyses: medical claims data
Our data comprised weekly case reports of U.S. medical claims for influenza-like illness (ILI) for children (5–19 years old) and adults (20–69 years old) from 2001 to 2009. Claims were submitted from offices, outpatient clinics, inpatient acute care facilities, and emergency room and urgent care facilities, and data were aggregated to the scale of the first three digits of the facility’s zip code (zip3). Patients had ILI if their medical claims diagnoses included: 1) a fever and either respiratory symptoms or febrile viral illness, or 2) prescription of an influenza antiviral drug [25]. In a previous study, these symptomatic profiles of ILI were compared and validated to ILI cases from traditional flu surveillance systems at multiple geographic scales [25]. Medical claims database coverage changed throughout the study period and age-specific populations differed. To adjust for these differences, we calculated the ILI incidence ratio; raw ILI counts were normalized by the number of total weekly visits captured in the medical claims database and by the population size of a given location and age group (See SM section S1.1) [25].
Theoretical analyses: metapopulation model
We used a mathematical model to simulate flu epidemics with and without holiday-associated behavioral changes to contact and travel patterns. Our model was adapted from an age-specific metapopulation model that 1) incorporates contact between children and adults, and 2) is spatially divided into metro areas that are linked through air traffic flows [11, 26]. Infection followed an SIR (Susceptible, Infected, Recovered) disease model, and the entire population began in the Susceptible class. Each simulation was seeded with a single child infection in a different metro area. After the first infection, flu spread throughout the population deterministically in discrete time steps based on contact patterns between and within the two age groups, and across the metro areas through air travel. Infected individuals passed to the Recovered class at a constant rate, and recovered individuals were not able to be reinfected. The simulation ended when less than one infected individual remained. A baseline model was compared to a holiday model, where contact and travel patterns changed for fixed periods of time during a fixed early period of the simulation.
Demographic and contact data
The proportion of children, 24%, and adults, 76%, in each metro area was calculated from the national average, surveyed in the 2010 U.S. Census. Age-specific contact rates from Germany survey data were aggregated to inform the model’s contact matrix [7], and transmission parameters were chosen so that the model infected roughly 20% of the population [27]. The recovery rate corresponded to a two day infectious period, which comes from epidemiological survey data [28].
Travel data
Travel movements were derived from domestic air traffic network data from the U.S. Bureau of Transportation Statistics from January to March 2005. The T100D Market Carriers table had data on the origin airport, the destination airport, and the average number of passengers traveling in a given month [29]. Airports were associated with one of 236 metro areas. The average number of monthly passengers traveling between two metro areas i and j (in either direction), reported in the raw transportation data, was converted to the daily number of passengers Wij traveling between two metro areas and used to determine travel flows between metro areas in the model at each time step. Travel rates were calculated separately for each age group and metro area pair i and j, by considering the population size and age breakdown of metro area i, the daily number of travelers between i and j Wij, and the fraction of children who are travelers r. Children did not travel in the baseline model (r = 0), as in [30, 26], and separate survey data has indicated that as little as 3% of travelers are children and less than 1% of trips made by children are greater than 30 miles during school term time [19].
Experimental design
To mimic holiday-associated behaviors in the model, we altered the age-specific contact and travel parameters during a predetermined holiday period. The percent change during the holiday period for each value in the contact matrix was calculated from survey data that reported age-specific contact rates during the school term and school holidays [18]. The holiday period’s travel network was informed by December 2005 air traffic data, and the fraction of travelers who are children r increases to 15% [19]. The holiday network had a greater volume of travelers and increased travel to more diverse locations, perhaps suggesting that holiday travelers are more likely to visit smaller cities than baseline winter travelers (Figure S2 and Table S2). Sensitivity of epidemic outcomes to holiday period timing was examined by comparing holiday model results where the holiday interventions occurred at three different periods in the model.
Characterizing epidemiological patterns
Effective reproductive number
To understand the effect of the winter holidays on flu transmission, we estimated the effective reproductive number (Rt), the average number of secondary cases generated by each infected individual under the conditions at time t, over seven-day periods for the eight flu seasons from 2001–2002 through 2008–2009. We used an estimated serial interval for flu of 3.6 days with a standard deviation of 1.6 days [31]. These analyses were performed with the EpiEstim package version 1.1–2 developed for the R programming language (R Foundation for Statistical Computing, Vienna, Austria) [32]. ILI case data for the analysis were adjusted using a ratio of weekly total visits to account for holiday-associated changes in health care seeking behavior (e.g., doctor’s office closures, lower probability of seeking care for illness during holidays), and scaled up according to estimates that only 45% of the total population symptomatic with ILI seeks care from a physician (See SM section S1.2) [33, 34].
Age-specific patterns
We made descriptive comparisons of the ILI incidence ratio for the medical claims data among school-aged children and adults over the winter holiday period for the eight flu seasons from 2001–2009. In each flu season, the winter holiday period was defined as the first week of November to the last week of January.
A separate analysis examined the epidemic trajectories of children and adults in the empirical data and model-generated data. Using the medical claims data, we compared the timing of the child and adult epidemic peaks across the eight seasons. Using the model-generated data, we pooled the data across simulations and compared the epidemic peaks for the baseline and holiday models in the total, child, and adult populations.
Spatial patterns
We used the metapopulation model to determine whether holidays might increase the synchronization of epidemics in different metro areas due to changes in travel patterns and volume. Here, we measure global spatial synchrony by examining the distribution of pairwise differences between cumulative flu incidence percentages in a specific location to those percentages aggregated across all locations (e.g., a national cumulative incidence percentage). For instance, global synchrony at time t is high if the distribution of differences at time t is tightly clustered around zero, and low if the distribution has a large variance. These distributions are composed of one data point per location i, where a positive value at time t indicates that location i has a larger cumulative incidence than the national average at time t (i.e., the epidemic in location i is “ahead” relative to other locations), and a negative value indicates that the epidemic in location i is “behind” relative to other locations. We note that these comparisons may only be performed after the completion of an epidemic, when the total size of the epidemic is known.
Spatial synchrony was examined among zip3s for the weekly medical claims data and among metro areas in the time-based metapopulation model simulations. To quantify the change in spatial synchrony over time, we comparison distributions for t = two weeks before Christmas and t = two weeks after Christmas for the medical claims data, the baseline model simulations, and the holiday model simulations. Model simulations results were pooled across all seeds.
Results
Holiday patterns in the medical claims data
During the weeks following Christmas, across the eight flu seasons of medical claims data, there were temporary dips in the overall U.S. ILI incidence ratio, a measure that accounts for holiday-related changes to health care seeking behavior (Figures 1A and S1).
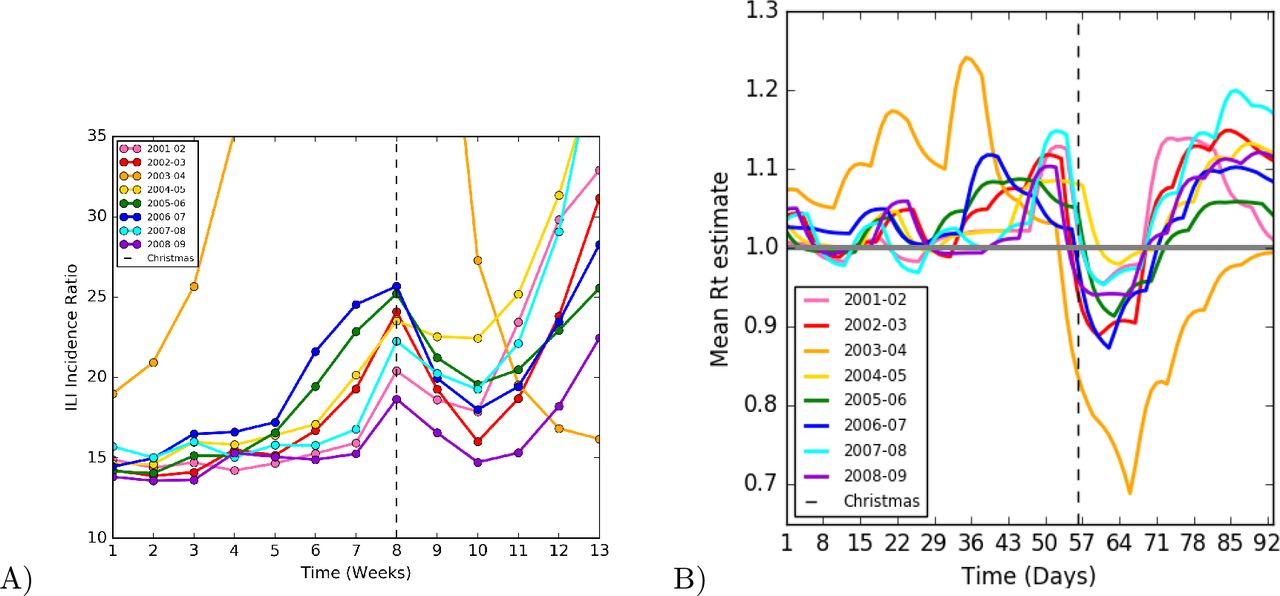
(A) National ILI incidence ratio (ILI cases per total visits per 100,000 population) calculated using ILI medical claims data over time in weeks from the first week in November to the last week in January for flu seasons from 2001 to 2009. The week of Christmas is marked with the vertical dotted line. (B) Effective reproductive number (Rt) over time in days from November 1st to the January 31st for eight flu seasons. Rt was calculated over seven-day windows using ILI medical claims data adjusted for health care facility closures and for care-seeking. The date of Christmas is marked with the dotted line
Effective reproductive number
The effective reproductive number (Rt) decreased by roughly 15% at Christmas and fell below a value of 1, then increased and surpassed a value of 1 after the holidays (Figure 1B). These temporary changes in the incidence ratio and Rt corroborated previous studies that also found that winter holidays reduce flu transmission [21, 22].
Age-specific patterns
Separating ILI data for the two age groups of interest, school-age children (5–19 years of age) and adults (20–69 years of age), revealed nuanced patterns in the medical claims data (Figure 2). Across the eight seasons, incidence of flu among children dropped temporarily during the week of or after Christmas. Adults also experienced a temporary drop in incidence, but descriptively, it appeared to occur in the week(s) after Christmas and have a smaller magnitude. In both age groups, growth in incidence picked up again over the following month, but children had an earlier and more rapid rebound than adults.

Age-specific ILI incidence ratio calculated from ILI medical claims data over time in weeks from the first week in November to the last week in January for eight flu seasons from 2001 to 2009. The week of Christmas is denoted by the vertical dotted line. School-child (5–19 years old) ILI incidence ratio is above, and adult (20–69 years old) ILI incidence ratio is below
Similarly, we examined child and adult flu cases per population across all metro areas in the model-simulated data (Figure 3). In the baseline model, where no behavioral changes were implemented, child and adult flu incidence increased exponentially without interruption. In the holiday model, however, we observed a temporary drop in incidence shortly after the start of the holiday period. As with the medical claims data, the dip in adult incidence was less sudden and smaller in magnitude than the one for child incidence.

Model-generated age-specific flu incidence data (flu cases per 100,000) over time is shown for a typical simulation. The intervention period is denoted by the vertical dotted lines. (A) Model-simulated epidemic data aggregated to the national level for the entire simulation period. The baseline model (yellow line) is compared to the holiday model (purple line). The primary holiday model peak is later and larger than that of the baseline model. (B) Child flu incidence from the baseline model with no holiday introduced (pink line) and with holiday introduced (blue line) is above, and adult flu incidence from the baseline model with no holiday introduced (red line) and with holiday introduced (green line) is below.
The baseline and holiday models allowed us to compare additional epidemic features by age group. The holiday model had a delayed peak as compared to the baseline, and the timing shifts appeared similar for the entire population, children, and adults (Figure 4). Nevertheless, the percentage of the total population that was infected at the end of the epidemic was similar between the baseline and holiday models (18.28% and 17.74%, respectively).

Median time to peak for national, child, and adult baseline and holiday model-simulated flu epidemics is shown for a typical simulation.
Spatial patterns
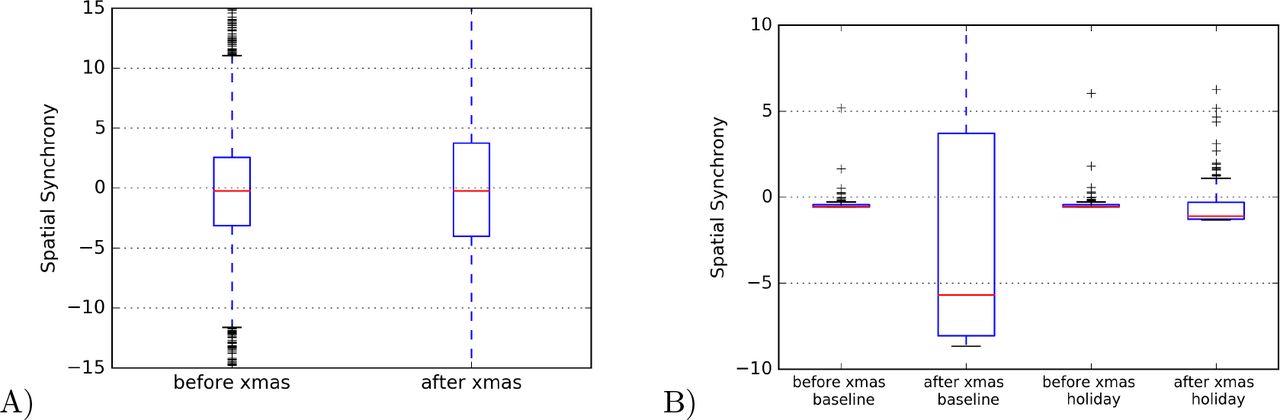
The zip3 regions in the U.S. medical claims dataset were found to be fairly synchronous, or homogeneous, two weeks before Christmas, as the median difference in their cumulative incidences from that of the national were close to zero (Figure 5A). This median did not change after Christmas, however the spread around the mean did increase.
A) The median spatial synchrony across zip3s calculated two weeks before Christmas and two weeks after Christmas. Spatial synchrony equals the difference between one zip3’s cumulative incidence for a given week and that of the national average. A spatial synchrony value of zero indicates complete synchrony of the zip3 epidemic with the national average epidemic. Cumulative incidences were calculated from the empirical ILI data. B) The median spatial synchrony across metro areas for a typical simulation, calculated 14 time steps before and 14 time steps after Christmas. Spatial synchrony was defined as the difference between one metro area’s cumulative incidence for a given week and that of the national average. A spatial synchrony value of zero indicates complete synchrony of the metro epidemic with the national average epidemic. Cumulative incidences were calculated from the model simulated flu epidemics.
The metro areas in the baseline model simulation decreased in spatial synchrony over time (Figure 5B). The median difference in the cumulative incidences of the metro area epidemics from that of the national epidemic began close to zero, or very synchronous, then decreased to −10, or more asynchronous, after 42 time steps. A negative synchrony value indicates the metro area cumulative incidences were lagging behind the national cumulative incidence. In other words, the metro area epidemics increased in heterogeneity. The spread around the median also increased after 30 time steps. However, when the holiday was introduced, the synchrony in the model-simulated epidemics more closely matched that observed in the data. The metro area epidemics began almost completely synchronous, close to zero, and remained very synchronous after the holiday.
Discussion
In this study, we have demonstrated that United States Christmas holiday periods are associated with temporary drops in rates of influenza-like illness and estimated flu transmission. We have also observed that children have sudden dips and quick rebounds in ILI during and after holidays, while adult ILI had smaller delayed decreases that were followed by more gradual rebounds in the postholiday period. In line with other studies, we hypothesized that school closures explain the sudden drops in child ILI during the Christmas week, and adults experience only delayed and mild trickle-down effects of closures [21]. We also hypothesized that ILI in children rebounds more quickly and abruptly due to school resumption and increased travel due to holidays, which is associated with greater potential disease contact. Motivated by empirical data, we used an age-specific spatial metapopulation model to compare models with and without temporary, holiday-associated changes in contact and travel. We found that the holiday model produced age-specific patterns like those in the empirical data, and that the holiday model shifted the epidemic peak forward in time but the total epidemic sizes remained similar. Holiday-associated behavioral changes appeared to weaken or delay the natural progression of increasing asynchrony in epidemics across locations, which was apparent in the baseline model.
Previous work on school holidays during the flu season suggested that a “late holiday” (e.g., occurs later in the epidemic period) reduces total epidemic size while an early holiday reduces the magnitude of the epidemic peak [35]. We observed a temporary dip in flu transmission immediately following the holiday period, which corresponds to other reports of holiday-related slowing of child transmission [21, 22]. The artificial drop transmission after the holidays has been used to detect early warning signals of influenza severity [2], and future work could examine how this early flu testbed might signal other actionable epidemiological information about the flu season.
Our results suggest that holiday-related drops in adult flu incidence are trickle-down effects from larger and more sudden drops in child flu incidence, thus supporting the idea that children primarily drive household transmission [36, 37]. In both empirical and modeling analyses, observational evidence suggested that children and adults have staggered, temporary dips in reported ILI after the winter holidays; the dip was later and smaller in magnitude for adults, supporting prior studies that holiday effects on non-child flu incidence is delayed one week relative to that among children [21]. Nevertheless, the timing of the overall epidemic peak was shifted equally in the holiday model for both children and adults, suggesting that while children may experience greater flu burden and local transmission due to their high contact rates [38, 39, 8, 6], they do not necessarily lead the epidemic wave [40, 41]. These contacts decreased during the holidays, but still remained higher than contacts between adults, and no significant change in attack rate was observed due to the holiday.
Decreased travel due to travel restrictions has been shown to have little to no effect on the spread of pandemic influenza [42, 43, 44]. Non-routine travel has been shown to synchronize county epidemics within one state [45]; our work explores only one synchronizing mechanism of action—a dampening of flu activity that keeps multiple spatial trajectories aligned at low flu incidence rates. Future work should explore the role of holidays in spatial seeding, as previous studies have indicated that the earlier U.S. Thanksgiving holiday may play a role in seeding flu in multiple locations [24]. Finally, our analyses contribute to our understanding of flu epidemiology in other countries, where holidays may have different timing and associated behaviors.
Winter holidays serve as an annual natural experiment on how short-term behavioral changes affect influenza epidemic dynamics and outcomes. Studying these periods can help us to understand how school closures (in the form of both interventions or holidays) and travel restrictions may improve public health in emergency situations [?, 13, ?, ?]. Our results suggest that early closures may delay epidemic peaks without changing overall attack rates, which means that school closures may be used to attenuate stress on health care systems at specific time points, while the overall size of the epidemic may remain similar. Future work to examine the timing and duration of holidays relative to the progression of flu epidemics may better inform the most effective ways to implement a school closure. Similarly, research on holiday periods may enable us to characterize the implications of other population-level short-term behavioral changes. We saw that heightened media coverage during the 2009 H1N1 pandemic preceded increases in care-seeking for flu-like symptoms and vaccination rates [46, 47, 48, 49]. Independent of specific disruptive events, incorporating behavioral changes into models is a growing area of disease modeling, and we propose the study of holiday periods and short-term interventions as natural research questions for these types of models [50].
Future work should consider holiday effects in populations that are poorly represented within medical claims data (e.g., uninsured individuals). These poorly captured populations may engage in systematically different holiday-associated behavioral changes, as lack of health insurance and financial barriers are known to affect health outcomes and care-seeking behavior in multiple contexts [51, 52, 34, 53]. Nevertheless, U.S. medical claims will better represent the entire population in years after the implementation of the Affordable Care Act, which has substantially expanded insurance coverage among adults [54, 55]. In addition, while our holiday model parameters are indeed based on empirical survey data, we have limited knowledge about holiday-associated behavioral changes to contact and travel patterns at a population scale [50, 19, 20, 56]. Moreover, it is difficult to study holiday effects with empirical data because there is no control or counterfactual scenario to compare epidemics without a holiday. Future studies could address this limitation by comparing flu epidemics in geographic locations where flu season holiday timings differ or adapting causal inference methods to the analysis of epidemic trajectories in a spatial context [57]. Finally, the model does not incorporate seasonal environmental fluctuations, such as temperature and humidity, both of which likely play a role in the transmissibility of flu [17, ?, ?, ?]. We posit that if winter holidays push U.S. epidemics later into the spring, environmental conditions may be less favorable to flu transmission, thus potentially reducing overall attack rates. Future work should extend the examination of the interaction between environmental factors and holiday-induced shifts in peak timing from pandemics to seasonal flu epidemics [23, ?, ?].
List of abbreviations
ILI: influenza-like illness
Competing interests
All authors declare that they have no competing interests.
Authors’ contributions
AE parsed the medical claims data, assembled the demographic and contact data, performed analyses, interpreted the results, and wrote the first draft of the manuscript. ECL assembled all other data and performed analyses, and SB and ECL jointly conceived and designed the study, guided the analysis, interpreted the results, and edited the manuscript. All authors read and approved the final manuscript.
Additional Files
Additional file 1 — Supporting Material (SM)
Detailed descriptions about data processing, model parameters, sensitivity analyses, and supporting evidence.
Acknowledgments
This work was supported by the Research and Policy for Infectious Disease Dynamics (RAPIDD) program of the Science and Technology Directorate, Department of Homeland Security (DHS), and the Fogarty International Center, National Institutes of Health (NIH). ECL was supported by the Jayne Koskinas Ted Giovanis Foundation for Health and Policy (JKTG), a private foundation dedicated to effecting change in health care for the public good. The opinions, findings, and conclusions or recommendations expressed in this material are those of the author and not necessarily those of JKTG, its directors, officers, or staff.
References
- [1].↵
- [2].↵
- [3].↵
- [4].↵
- [5].↵
- [6].↵
- [7].↵
- [8].↵
- [9].↵
- [10].↵
- [11].↵
- [12].↵
- [13].↵
- [14].↵
- [15].↵
- [16].↵
- [17].↵
- [18].↵
- [19].↵
- [20].↵
- [21].↵
- [22].↵
- [23].↵
- [24].↵
- [25].↵
- [26].↵
- [27].↵
- [28].↵
- [29].↵
- [30].↵
- [31].↵
- [32].↵
- [33].↵
- [34].↵
- [35].↵
- [36].↵
- [37].↵
- [38].↵
- [39].↵
- [40].↵
- [41].↵
- [42].↵
- [43].↵
- [44].↵
- [45].↵
- [46].↵
- [47].↵
- [48].↵
- [49].↵
- [50].↵
- [51].↵
- [52].↵
- [53].↵
- [54].↵
- [55].↵
- [56].↵
- [57].↵


