

Abstract
Mutations occur at vastly different rates across the genome, and between populations. Here, we measure variation in the mutational spectrum in a sample of human genomes representing all major world populations. We find at least two distinct signatures of variation. One, private to certain Native American populations, is novel and is concentrated at CpG sites. The other is consistent with a previously reported signature characterized by TCC>TTC mutations in Europeans and other West Eurasians. We describe the geographic extent of this signature and show that it is detectable in the genomes of ancient, but not archaic humans. We hypothesize that these two signatures are driven by independent processes and both result from differences in either the rate, or repair efficiency, of damage due to deamination of methylated bases – respectively guanine and cytosine for the two processes. Variation in these processes could be due to environmental, genetic, or life-history variation between populations, and dramatically affects the spectrum of rare variation in different populations.
Introduction
For a process that provides such a fundamental contribution to genetic diversity, the human germline mutation rate is surprisingly poorly understood. Different estimates of the mutation rate-the mean number of mutations per-generation, or per-year-are largely inconsistent with each other [1,2], and similar uncertainty surrounds parameters such as the paternal age effect [3–5], the effect of life-history traits [6,7], and the sequence-context determinants of mutations [5,8]. Here, we investigate a related question. Rather than trying to determine the absolute values of parameters of the mutation rate, we ask how much the relative mutation rate-specifically, the relative rate of different classes of mutations-varies between different human populations.
Motivation for this comes from two sources. First, analysis of tumor genomes has demonstrated a number of different mutational signatures operating at different rates in somatic cells and cancers, many of which can be linked to specific biological processes or environmental exposures [9–11]. It seems plausible that population-specific genetic factors of environmental exposures might similarly lead to variation in germline mutation rates. Second, it is known that some mutations, most notably TCC>TTC, are enriched in Europeans relative to East Asians and Africans [8] though the geographical extent, history, and biological basis for this signal are unclear. By analyzing whole-genome sequence data from diverse world populations, together with high coverage ancient genomes, we aimed to further characterize variation in human mutation rates, to place this variation in a historical context, and to determine the underlying biological or environmental explanations.
Results
We first analyzed data from 300 individuals sequenced to high coverage (mean coverage depth 43X) as part of the Simons Genome Diversity project [12] (SGDP). We classified single nucleotide polymorphisms (SNPs) into one of 96 mutational classes according to the SNP, and the two flanking bases. We represent these by the ancestral sequence and the derived base so for example “ACG>T” represents the ancestral sequence 3’-ACG-5’ mutating to 3’-ATG-5’. In order to increase power to detect population-specific variation, we first focused on variants where there were exactly two copies of the derived allele in the sample (f2 variants). For each individual, we counted the number of f2 mutations in each mutational class that they carried, and normalized by the number of ATA>C mutations (the most common class and one that did not seem to vary across populations in a preliminary analysis). The residual mutation intensities form a 96×300 matrix, and we used non-negative matrix factorization [10,13] (NMF, implemented in the NMF package [14] in R) to identify specific mutational features. NMF decomposes a matrix into a set of sparse factors, here putatively representing different mutational processes, and individual-specific loadings for each factor, measuring the intensity of each process in each individual.
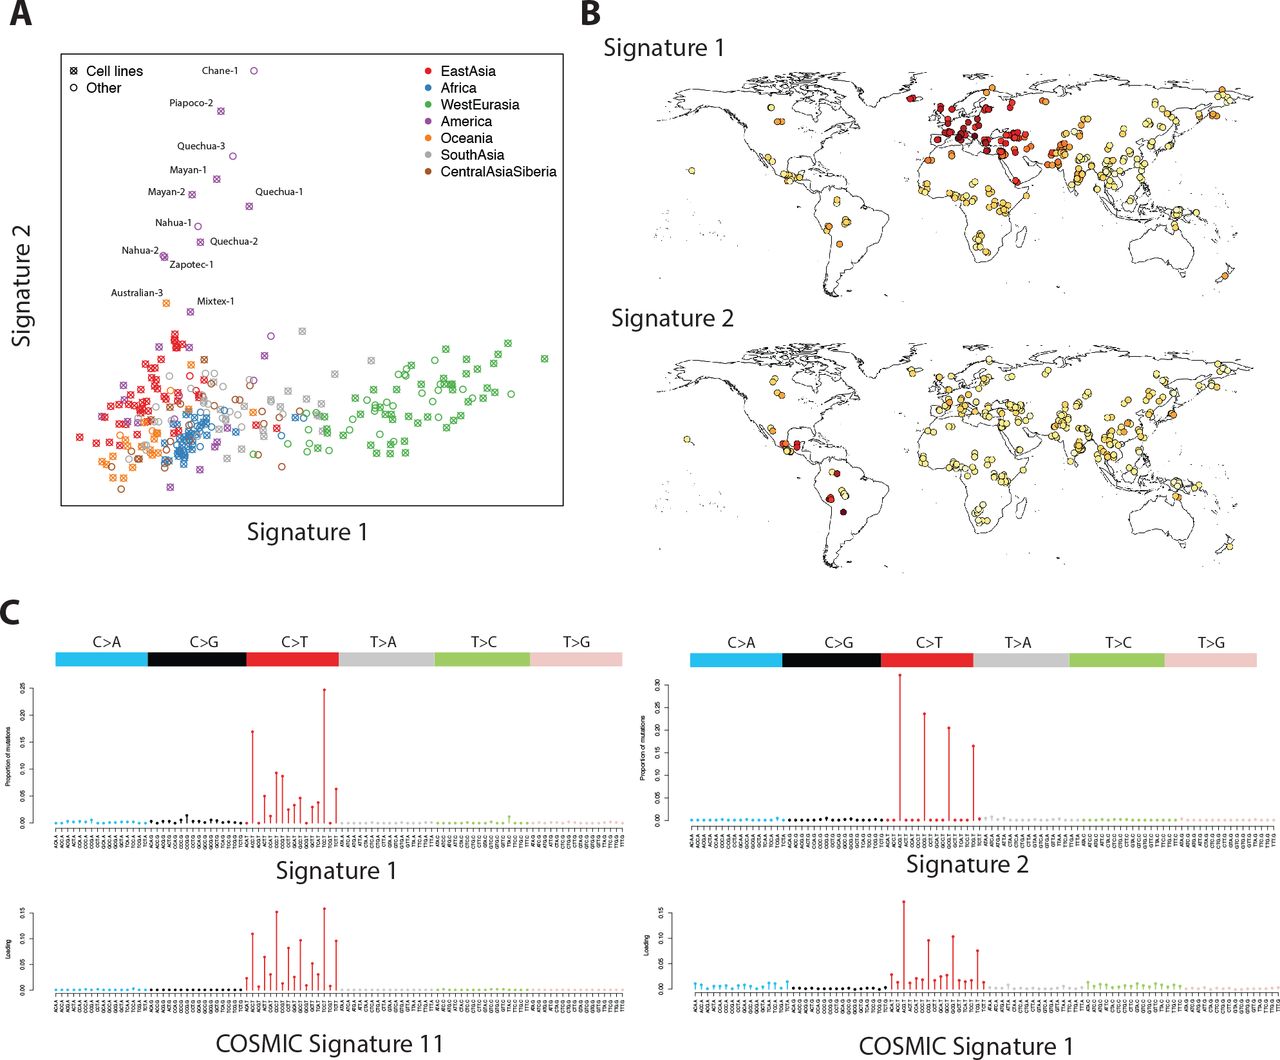
NMF requires us to specify the number of signatures (the factorization rank) in advance. For f2 variants we chose a factorization rank of 4, based on standard diagnostic criteria (Supplementary Fig. 1). This identified four mutational signatures; of which two were uncorrelated with each other, were robust across frequencies, replicated in non-cell-line samples, were consistent across samples from the same populations, and had clear geographic distributions (Figure 1, Supplementary Fig. 2). Signature 1 corresponds to the previously described European signal [8] characterized by TCC>T, ACC>T, CCC>T and TCT>T (possibly also including CCG>T, which overlaps with signature 2). Loadings of this component almost perfectly separate West Eurasians from other populations, with South-West Asians intermediate. This component is seen most strongly in Western and Mediterranean Europe, with decreasing intensity in Northern and Eastern Europe, the Middle East and South-west Asia. This signal is similar to signature 11 from the COSMIC catalog of somatic mutation in cancer [15] (Pearson correlation ρ=0.85) which is most commonly found in melanoma and glioblastoma and is associated with use of chemotherapy drugs which act as alkylating agents, damaging DNA through guanine methylation.

Distribution and characterization of mutational signatures 1 and 2. A: Factor coefficients for these two signatures, for 300 individual samples colored by region. B: Geographic representation of the factor loadings from panel A. Darker colors represent higher loadings. C: Characterization of the signatures in terms of mutation intensity for each of 96 possible classes. Bars are scaled by the frequency of each trinucleotide in the human reference genome. Below, the most highly correlated signatures from the COSMIC database are shown for comparison.
Signature 2 is restricted to some South and Central American populations and, possibly, Aboriginal Australians. It is characterized by NCG>T mutations similar to the signature caused by deamination of methylated cytosine at CpG sites, corresponding to COSMIC signature 1 (ρ=0.96). Interestingly, this signal is found in South America in Andean populations like Quechua and Piapoco, and in Central American populations such as Mayan and Nahua, but not in the Amazonian Surui and Karitiana, nor in North American populations.
The remaining two signatures are more difficult to identify (Supplementary Fig. 2). Signature 3 is characterized by GT>GG mutations, particularly GTG>GGG. It is found in some East Asian and some South American populations but is not consistent within populations and does not have a consistent geographic pattern. All affected samples are derived from cell lines. It does not match any mutational signature seen in COSMIC (maximum ρ=0.05). Plausibly this represents some as-yet uncharacterized sample-specific process or cell-line artifact. Signature 4 is diffuse, possibly representing a background mutation rate and is most correlated with COSMIC signature 5 (ρ=0.52) which is found in all cancers and has unknown aetiology. It is significantly reduced in only a single cell-line derived sample (Quechua-2), so probably represents some unknown cell-line or data processing artifact.
We checked that these signatures were robust when we looked at different frequencies and factorization ranks. For f3 variants with rank 4 we recovered the same signatures as with f2 variants (Supplementary Fig. 3), and retained signatures 1 and 2 when we used rank 3 (Supplementary Fig. 4). At f1 the variation is apparently dominated by cell line artifacts because principal component analysis (PCA) separates cell line from non cell line derived samples (Supplementary Fig. 5A). However, NMF on f1 variants excluding cell line derived samples recovers signatures consistent with signatures 1 and 2 (Supplementary Fig. 5B-C). PCA on f2 variants does not distinguish cell line samples, but does separate samples by geographic region, and recovers factor loadings consistent with NMF-derived signatures 1-3 (Supplementary Fig. 6). To check that our results were not an artifact of the normalization we used, we repeated the analysis normalizing by the total number of mutations in each sample, rather than the number of ATA>C mutations, and obtained equivalent results (Supplementary Figure 7).
Demographic effects such as population size changes confound direct estimates of mutation rate differences. However, the proportion of mutations likely attributable to signature 1 (i.e TCT>T, TCC>T, CCC>T and ACC>T) increases from a mean of 7.8% in Africans to 10.0% (range 8.8–11.1%) in West Eurasians which, with the strong assumption that the only differences in mutation are the ones we detected, would provide a lower-bound for the increase in genome-wide mutation rate of 2.3% (range 1.1–3.6%). A similar calculation for American samples with apparent excess of signature 2 gives a range of increase of 4.9–10.8%.
We replicated these results using data from phase 3 of the 1000 Genomes project [16], confirming that mutations consistent with signature 1 are enriched in populations of European and South Asian ancestry (Figure 2A) and that mutations consistent with signature 2 are enriched in Peruvians (PEL) and Mexicans (MXL)-the two 1000 Genomes populations with the most Native American ancestry (Figure 2B).

Signatures 1 and 2 in the 1000 Genomes. A: Proportions off2 and f3 variants in signature 1 (here defined as TCT>T, TCC>T, CCC>T and ACC>T) in each 1000 Genomes individual, by population. B: Proportions off2 and f3 variants in signature 2 (here defined as NCG>T, for any N) in each 1000 Genomes individual, by population (five outlying samples excluded)
To study the time depth of these signals, we investigated whether signature 1 could be detected in ancient samples by constructing a corrected statistic, that measures the intensity of the mutations enriched in signature 1, normalized to reduce spurious signals that arise from ancient DNA damage (methods). This statistic is enriched to European levels in both an eight thousand year old European hunter-gatherer and a seven thousand year old Early European Farmer [17] but not in a 45,000 year old Siberian [18], nor in the Neanderthal [19] or Denisovan[20] genomes (Figure 3). This statistic is predicted by neither estimated hunter-gatherer ancestry, nor early farmer ancestry, in 31 samples from 13 populations for which ancestry estimates were available [17] (linear regression p-values 0.22 and 0.15, respectively). Thus the effect is not strongly driven by this division of ancestry. If it has an environmental basis, it is not predicted by latitude (linear regression of signature 1 loadings against latitude; p=0.68), but is predicted by longitude (p=6× 10⁻⁸; increasing east to west). We cannot apply the same approach to Signature 2, because post-mortem deamination of methylated CpG sites is common in all ancient DNA, even when treated with uracil-DNA glycosylase [21].

Signature 1, corrected to be more robust to ancient DNA damage (Methods), for f2 variants in the SGDP individuals, by region, and in five high coverage ancient genomes. Solid lines show 5–95% bootstrap quantiles.
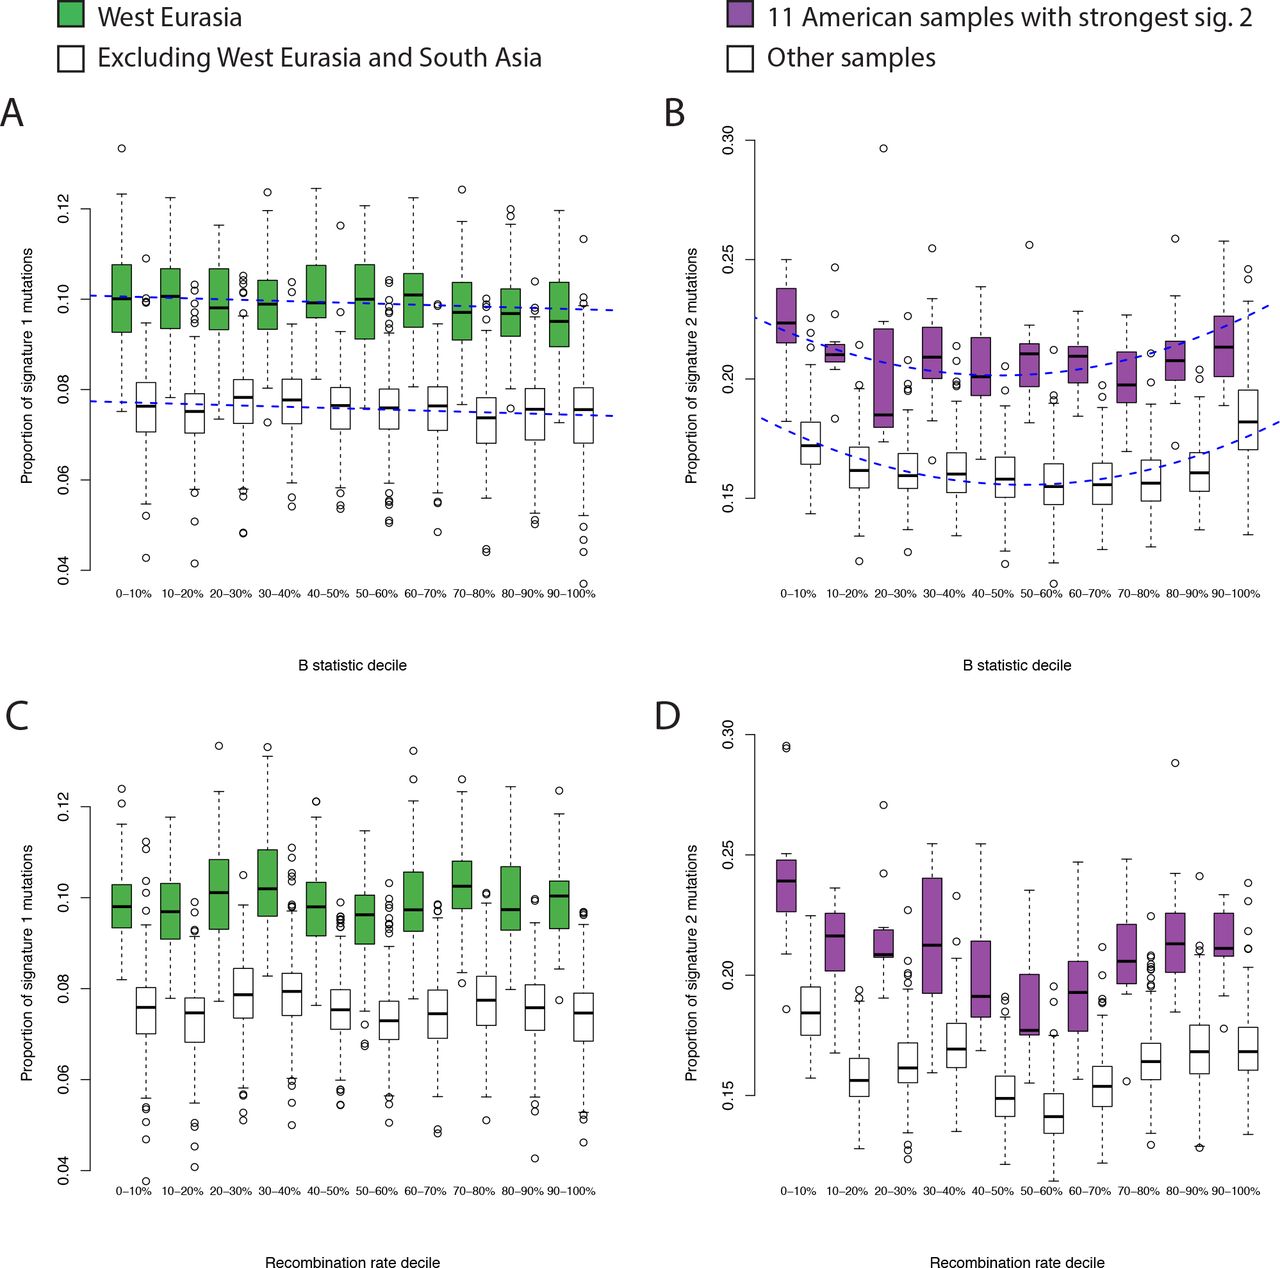
Finally, we investigated the dependence of the two signatures on four genomic features. First we investigated dependence on transcriptional strand. Signature 1 shows a skew whereby the C>T mutation is more likely to occur on the transcribed (i.e. noncoding) strand in West Eurasians, relative to populations from other regions (Figure 4 A&B). Because transcription coupled repair is more likely to repair mutations on the transcribed strand [22] this result, consistent with Harris (2015) [8], suggests that the excess signature 1 mutations in West Eurasians are driven more by G>A than by C>T mutations. Signature 2 shows a global skew where the C>T mutation is more likely to occur on the untranscribed strand, consistent with these mutations resulting from deamination of methylated cytosine, and we do not see a significant difference between individuals with high versus low levels of signature 2 mutations (Figure 4 C,D). Second, we obtained methylation data for a testis cell line, produced by the Encyclopedia of DNA Elements (ENCODE) project [23]. Signature 2 mutations are ~8.5 times as likely to occur in regions of high (>=50%) versus low (<50%) methylation. We do not detect any difference in this ratio between regions, or between individuals with high versus low signature 2 mutation rates, although the number of mutations involved is probably too low to provide much power (Methods; Fisher’s exact test P=0.14). Third, we tested dependence on B statistic [24], a measure of conservation. We found that the relative magnitudes of both signatures 1 and 2 depend on B statistic, but that both these dependencies were independent of the per-population intensities of the signatures (Figure 5 A,B). This, along with a similar result for recombination rate, (Figure 5 C,D) confirm that the differences we detect are truly due to differences in mutation rate, and not some other force like natural selection, recombination or biased gene conversion.
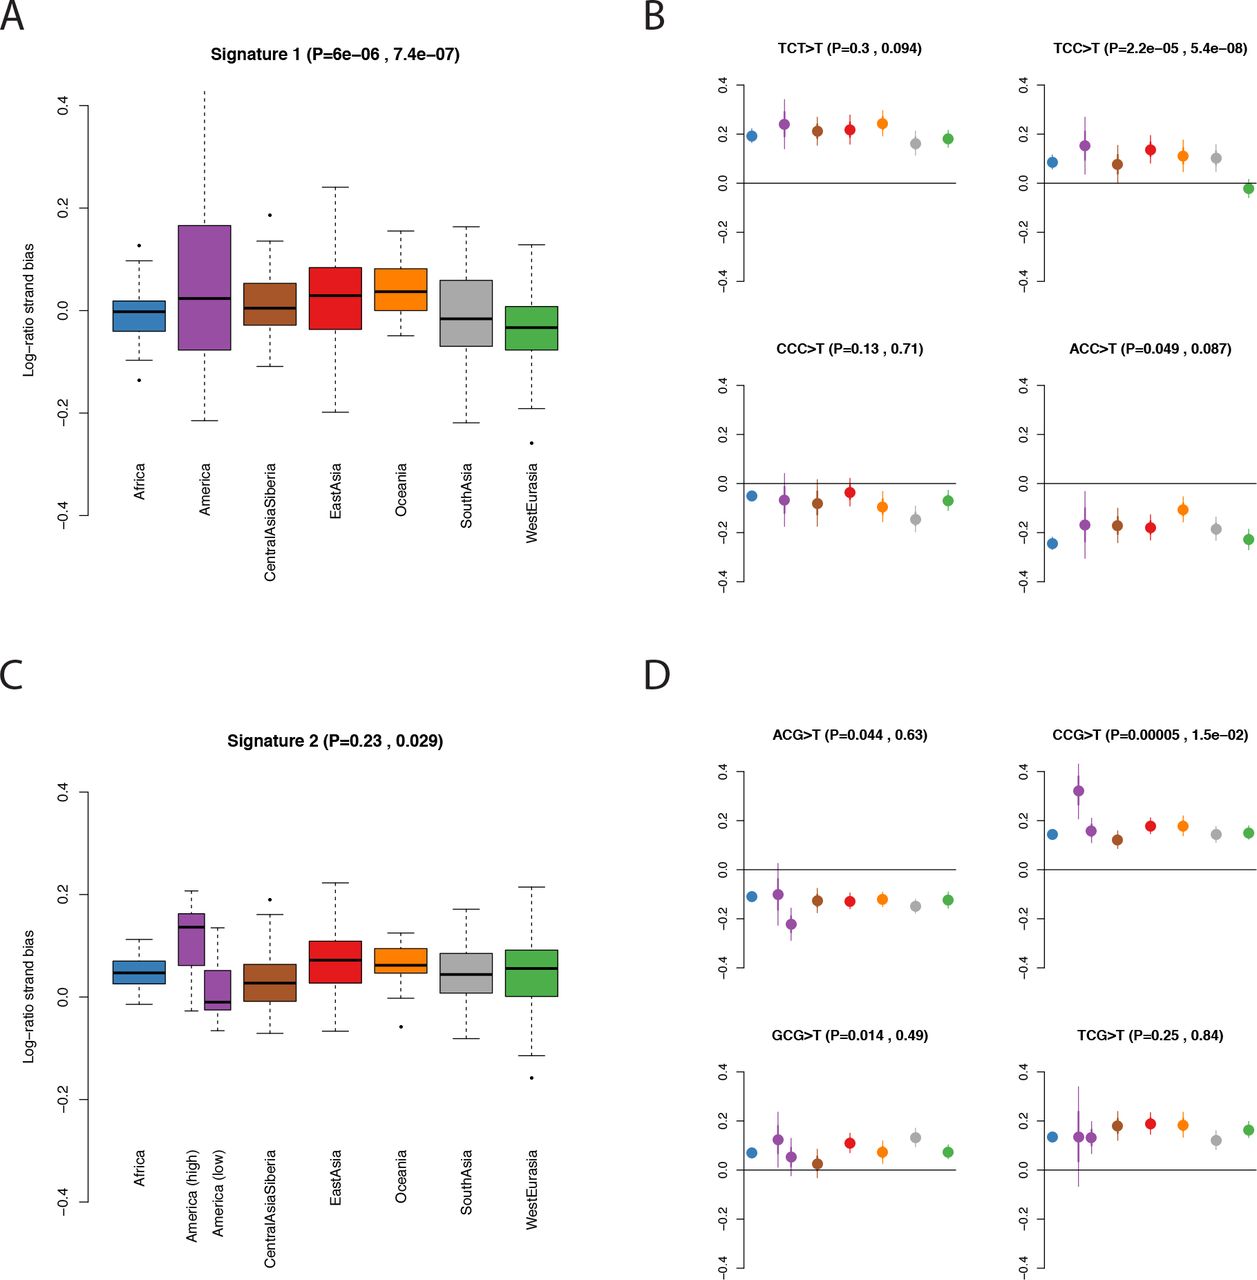
Transcriptional strand bias in mutational signatures. We plot the log of the ratio of mutations occurring on the untranscribed versus transcribed strand. Therefore a positive value indicates that the C>T mutation is more common than the G>A mutation on the untranscribed (i.e. coding) strand. P values in brackets are, respectively, ANOVA P-values for a difference between regions and t-test P-values for a difference between i) West Eurasia and other regions (excluding South Asia) in A&B ii) 11American samples with high rates of signature 2 mutations and other regions in C&D. A: Boxplot of per-individual strand bias for mutations in signature 1 (TCT>T, TCC>T, CCC>T and ACC>T). One sample (S_Mayan-2) with an extreme value (0.48) is not shown. B: Population-level means for each of the mutations comprising signature 1. C,D: as A&B but for signature 2. We separated out the 11 American samples with high rates of signature 2 mutations.

Dependence of mutational signatures on genomic features. A,B: dependence on conservation, measured by B statistic (0=lowest B statistic; highest conservation). A: Comparison of proportions of signature 1 mutations between West Eurasia and other populations (excluding South Asia). Blue dashed lines show a fitted linear model of dependence with no interaction term. B: Comparison of proportions of signature 2 mutations between the 11 American samples with the highest proportions, and all other samples. Blue dashed lines show a fitted quadratic model of dependence with no interaction term. C,D: As A&B, but showing dependence on recombination rate decile computed in 1kb bins.
Discussion
We characterized two independent signals of variation in mutation rates between human populations, however this may not be comprehensive. Our power to detect differences in mutation rates depends on a number of factors, including sample size, and the level of background variation. For example, we would expect to have more power to detect recent variations in Native Americans because they have relatively low background variation. Nonetheless, it is clear that the patterns we did identify are robust, and represent real differences in mutation rates.
We cannot be definitive about the causes of these patterns, but our analyses provide a number of clues. In terms of the immediate mutagenic cause, signature 1 is most similar to COSMIC [15] signature 11 (Pearson correlation ρ=0.85), which is associated with alkylating agents used as chemotherapy drugs, damaging DNA through guanine methylation. The reversal of transcriptional strand bias for this signature in West Eurasians supports the idea that the increased rate of these mutations in West Eurasians is driven by damage to guanine bases, consistent with deamination of methyl-guanine to adenine, leading to the G>A (equivalently C>T) mutations that we observe. Signature 1 is also highly correlated with COSMIC signature 7 (ρ=0.76), caused by ultraviolet (UV) radiation exposure but it is difficult to imagine how this could affect the germline, would not explain our observed increase in ACC>T mutations, would not be expected to reverse the strand bias, and should produce an enrichment of CC>TT dinucleotide mutations in West Eurasians that we do not observe (p=0.41). Harris (2015) [8] suggested that UV might cause germline mutations indirectly through folate deficiency in populations with light skin pigmentation (since folate can be degraded in skin by UV radiation). It is unknown what mutational signature would be caused by this effect, but the fact that we do not observe enrichment of signature 1 in other lightly pigmented populations like Siberians suggests that it is not driving the signal.
Signature 2 seems most likely to be driven by deamination of methylated cytosine at CpG sites, which is the major source of C>T muations at these sites. We find no evidence of any qualitative difference between the CpG mutations in populations with high rates of signature 2 compared to other populations. Therefore we hypothesize that variation in both signatures is driven by differences either in methylation (of guanine and cytosine, respectively) level, rate of deamination of methylated bases, or in the efficiency of repair of damage caused by deamination of methylated bases.
Why these factors would vary between populations is another question and, for this study, a matter for speculation. Possibilities include variation in life-history traits, variation in environment, or systematic variation in mutational or DNA repair processes due to either natural selection or neutral evolution. Over longer timescales, variation in life history traits, for example the timing of reproduction and the onset of fertility, can lead to variation in both total mutation rate and in the mutational spectrum, particularly in the relative rates of CpG and non-CpG mutations [1,6,7,25,26]. While these effects are dramatic and important on the timescale of hominid evolution, we do not think that variation in life-history traits drives the variation that we observed within humans. First, we see little variation within African populations, despite great social and cultural diversity across the populations represented in our study. Second, variation in signature 1 across Eurasia seems very smooth (Figure 1B) and we know of no life-history traits that vary so smoothly across populations. Signature 2 varies less smoothly, and the relative rate of CpG mutations is known to be affected by life-history traits, although the magnitude of the signal seems too large. For example, in the 1000 Genomes project, the proportion of rare C>T mutations at CpG sites (a lower bound for the difference in mutation rate) varies by up to ~5% across populations (Figure 2 B), on the same order as the difference in the proportion of CpG substitutions between human and baboon lineages [26]. Studies of de novo mutations in humans have found no significant effect of paternal age on CpG:non-CpG mutation ratio [4,5], but we cannot exclude the possibility that variation in signature 2 is driven by dramatic variation in some other life history trait.
Other than life-history traits, damage or repair rates might vary either because of inherited variation in DNA repair efficiency or other biochemical processes, or because of external environmental factors. In the first case, a promising approach to detecting a causal locus would be to map mutation rate variation, either in large pedigrees or in an admixed population like African Americans. In the second, we might identify the factor by looking for correlations with environmental features, through mutation accumulation experiments in other species, or comparison with mutational signatures identified in cancer with known causes. So far, however, the ultimate cause of this variation remains unknown.
It is important to understand changes in the mutation rate on the timescale of hominid evolution in order to calibrate demographic models of human evolution [27] and the observation of variation in mutation rates between populations [8] made this calibration even more complicated. One further consequence of our results is that the rate of CpG mutations, often assumed to be almost “clock-like” [7,25,26] may also vary over short timescales, meaning that they may not be as useful for model calibration as previously though. Further work in this area will involve more detailed measurement of mutation rates in diverse populations-to date, most work on somatic, cancer, or de novo germline mutations has been conducted in popualtions of West Eurasian origin-and the extension of these approaches to other populations will be required to fully understand variation in mutation rates and its consequences for demographic modeling.
Methods
Identifying mutational signatures
We used SNPs called in 300 individuals from the Simons Genome Diversity Project [12] (SGDP). Variant sites were called at filter level 1, and then any site that was variable in any sample was genotyped in every sample. We polarized SNPs with the ancestral allele inferred in the human-chimp ancestor, and classified by the two flanking bases in the human reference (hg19). We restricted to sites of given frequencies and merged reverse complement classes to give counts of SNPs occurring in 96 possible mutational classes. We then normalized these counts by the frequency of ATA>ACA mutations. The remaining matrix represents the normalized intensity of each mutation class in each sample, relative to the sample with the lowest intensity. Formally, let Cij be the counts of mutations in class i for sample j. Then, the intensities that we analyze, Xij are given by,

We decomposed this matrix X using non-negative matrix factorization [13] implemented in the NMF R package [14] with the multiplicative algorithm introduced by Lee & Seung (1999) [13], initialized using the nonnegative components from the output of a fastICA analysis[28] implemented in the fastICA package in R (https://cran.r-project.org/web/packages/fastICA/index.html). For the diagnostic plots in Supplementary Fig. 2, we used 200 random starting points to compare the results of different runs. When we initialized the matrix randomly, rather than using fastICA, we obtained a slightly closer fit to the data (root-mean-squared error in X of 0. 024 vs 0.025) and similar factor distributions (Supplementary Fig. 8A), except that all signatures were dominated by CpG mutations (Supplementary Fig. 8B). Removing a constant amount of each CpG mutation from each signature recovered signatures close to the fastICA-initialized signatures (Supplementary Fig. 8C), so we concluded that this was a model-fitting artifact, and did not reflect true signatures. Finally we performed the analysis on a matrix normalized be the total number of mutations in each sample ΣiCij rather than the number of ATA>C mutations. (Supplementary Figure 7).
The ordering of the factors is arbitrary so, where necessary, we reordered for interpretability. To plot mutational signatures and compare with the COSMIC signatures, we rescaled the intensities of each class according to the trinucleotide frequencies in the human reference genome. The scale of the weightings is therefore not easily interpretable. To perform principal component analysis on X, we normalized so that the variance of each row was equal to 1.
Analysis of 1000 Genomes data
We classified 1000 Genomes mutations according to the ancestral allele inferred by the 1000 Genomes project, and counted the number off2 and f3 variants carried by each individual in each mutation class. We ignored SNPs that were multi-allelic or where the ancestral state was not confidently assigned (confident assignment shown by a capital letter in the “AA” tag in the “INFO” field of the vcf file). We excluded the four outlying samples: HG01149(CLM), NA20582 & NA20540 (TSI), NA12275(CEU), NA19728(MXL).
Analysis of ancient genomes
We identified heterozygous sites in five ancient genomes from published vcf files, and restricted to sites where there was a single heterozygote in the SGDP. The corrected signature 1 log-ratio is defined by
 and then normalized so that the distribution in African populations has mean 0 and standard deviation 1. We estimated bootstrap quantiles by resampling the counts Cij for the ancient samples and recomputing M.
Transcriptional strand
We downloaded the knownGenes table of the UCSC genes track from the UCSC genome browser (http://genome.ucsc.edu/). Taking the union of all transcripts in this table, we classified each base of the genome according to whether it was transcribed on the + or − strand, both, or neither (including uncalled bases). These regions totaled 607Mb, 637Mb, 36Mb and 1,599Mb of sequence respectively. We then counted mutations in our dataset that occurred in regions that were transcribed on the + or − strand, ignoring regions where both or neither strand was transcribed.
Methylation status
We downloaded the Testis_BC 1 and 2 (two technical replicates from the same sample) tables from the HAIB Methyl RRBS track from the UCSC genome browser (http://genome.ucsc.edu/). We constructed a list of 33,305 sites where both replicates had >=50% methylation and another list of 166,873 sites where both replicates had <50% methylation. We then classified the CpG mutations in our dataset according to which, if either, of these lists they fell into. Ultimately, there were only 1186 classified mutations in the whole dataset, including 43 in Native American samples and 12 in Native American samples with high rates of signature 2. Therefore, although we found no significant interactions between methylation status and population, it may be simply that we lack power to detect it.
B statistic and recombination rate
We classified each base of the genome according to which decile of B statistic [24] or HapMap 2 combined recombination rate [29] (in 1kb blocks) it fell into and counted mutations in each class.
Code availability
Scripts used to run the analysis are available from https://github.com/mathii/spectrum.
Acknowledgments
We thank Mark Lipson and Priya Moorjani for helpful comments. I.M. was supported by a long-term fellowship from the Human Frontier Science Program LT001095/2014-L. D.R. is a Howard Hughes Medical Institute investigator.


