

Abstract
A quantitative model to genetically interpret the histology in whole microscopy slide images is desirable to guide downstream immuno-histochemistry, genomics, and precision medicine. We constructed a statistical model that predicts whether or not SPOP is mutated in prostate cancer, given only the digital whole slide after standard hematoxylin and eosin [H&E] staining. Using a TCGA cohort of 177 prostate cancer patients where 20 had mutant SPOP, we trained multiple ensembles of residual networks, accurately distinguishing SPOP mutant from SPOP non-mutant patients (test AUROC=0.74, p=0.0007 Fisher’s Exact Test). We further validated our full metaensemble classifier on an independent test cohort from MSK-IMPACT of 152 patients where 19 had mutant SPOP. Mutants and non-mutants were accurately distinguished despite TCGA slides being frozen sections and MSK-IMPACT slides being formalin-fixed paraffin-embedded sections (AUROC=0.86, p=0.0038). Moreover, we scanned an additional 36 MSK-IMPACT patients having mutant SPOP, trained on this expanded MSK-IMPACT cohort (test AUROC=0.75, p=0.0002), tested on the TCGA cohort (AUROC=0.64, p=0.0306), and again accurately distinguished mutants from non-mutants using the same pipeline. Importantly, our method demonstrates tractable deep learning in this “small data” setting of 20-55 positive examples and quantifies each prediction’s uncertainty with confidence intervals. To our knowledge, this is the first statistical model to predict a genetic mutation in cancer directly from the patient’s digitized H&E-stained whole microscopy slide. Moreover, this is the first time quantitative features learned from patient genetics and histology have been used for content-based image retrieval, finding similar patients for a given patient where the histology appears to share the same genetic driver of disease i.e. SPOP mutation (p=0.0241 Kost’s Method), and finding similar patients for a given patient that does not have have that driver mutation (p=0.0170 Kost’s Method).
Significance Statement This is the first pipeline predicting gene mutation probability in cancer from digitized H&E-stained microscopy slides. To predict whether or not the speckle-type POZ protein [SPOP] gene is mutated in prostate cancer, the pipeline (i) identifies diagnostically salient slide regions, (ii) identifies the salient region having the dominant tumor, and (iii) trains ensembles of binary classifiers that together predict a confidence interval of mutation probability. Through deep learning on small datasets, this enables automated histologic diagnoses based on probabilities of underlying molecular aberrations and finds histologically similar patients by learned genetic-histologic relationships.
Conception, Writing: AJS, TJF. Algorithms, Learning, CBIR: AJS. Analysis: AJS, MAR, TJF. Supervision: MAR, TJF.
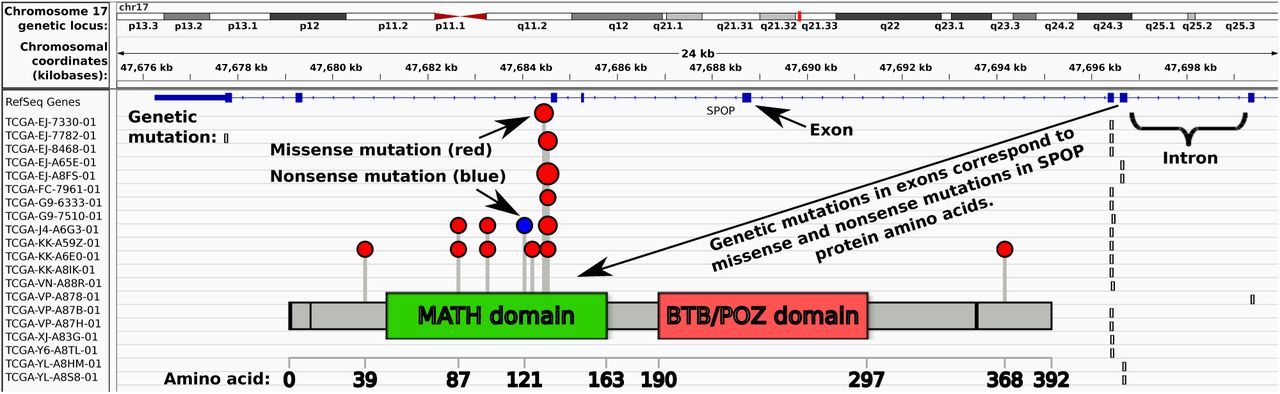
Genetic drivers of cancer morphology, such as E-Cadherin [CDH1] loss promoting lobular rather than ductal phenotypes in breast, are well known. TMPRSS2-ERG fusion in prostate cancer has a number of known morphological traits, including blue-tinged mucin, cribriform pattern, and macronuclei [5]. Computational pathology methods [6] typically predict clinical or genetic features as a function of histological imagery, e.g. whole slide images. Our central hypothesis is that the morphology shown in these whole slide images, having nothing more than standard hematoxylin and eosin [H&E] staining, is a function of the underlying genetic drivers. To test this hypothesis, we gathered a cohort of 499 prostate adenocarcinoma patients from The Cancer Genome Atlas [TCGA]1, 177 of which were suitable for analysis, with 20 of those having mutant SPOP (Figs 1, 2, and S1). We then used ensembles of deep convolutional neural networks to accurately predict whether or not SPOP was mutated in the patient, given only the patient’s whole slide image (Figs 3 and 4 panel A), leveraging spatial localization of SPOP mutation evidence in the histology imagery (Fig 4 panels B and C) for statistically significant SPOP mutation prediction accuracy when training on TCGA but testing on the MSK-IMPACT[7] cohort (Fig 5). Further, we scanned 36 additional SPOP mutant MSK-IMPACT slides, training on this expanded MSK-IMPACT cohort and testing on the TCGA cohort. Our classifier’s generalization error bounds (Fig 5 panels A and B), receiver operating characteristic (Fig 5 panels C1 and D1), and independent dataset performance (Fig 5 panels C2 and D2) support our hypothesis, in agreement with earlier work suggesting SPOP mutants are a distinct subtype of prostate cancer [8]. Finally, we applied our metaensemble classifier to the content-based image retrieval [CBIR] task of finding similar patients to a given query patient (Fig 6), according to SPOP morphology features evident in the patient slide dominant tumor morphology.

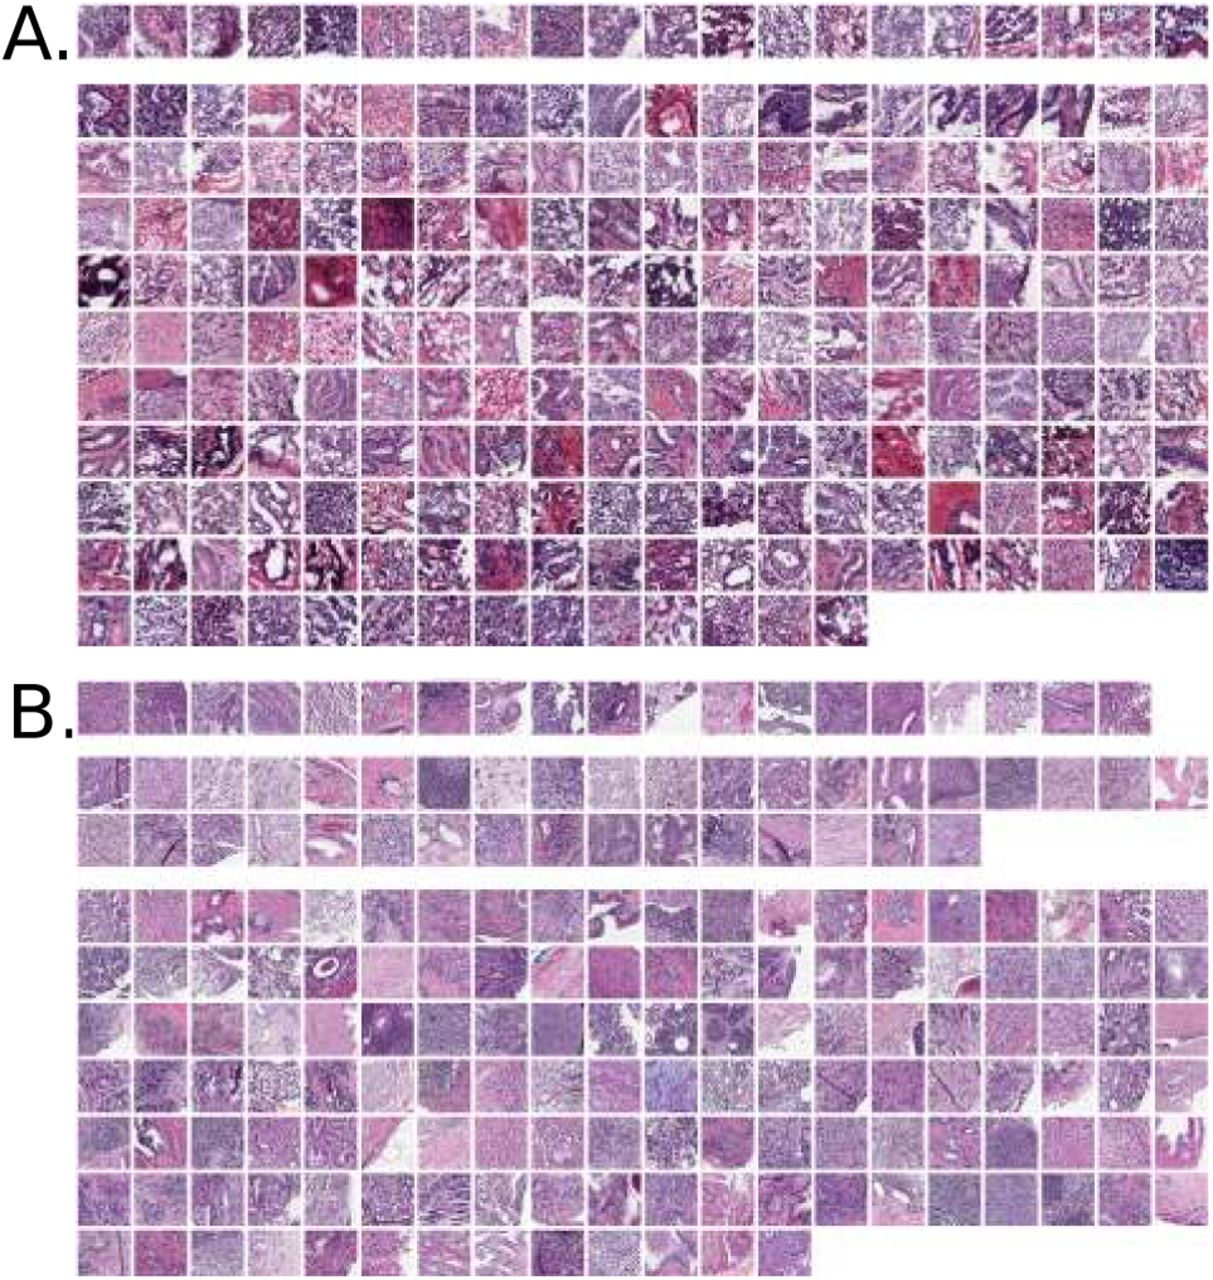
Panel A: TCGA cohort of frozen section images. Top row shows 20 SPOP mutants. Bottom rows are 157 SPOP non-mutants, where 25 patients had 2 and 6 patients had 3 acceptable slides available. Panel B: MSK-IMPACT cohort of formalin-fixed paraffin-embedded sections, providing higher image quality than frozens. Top row shows 19 SPOP mutants. Middle rows show 36 SPOP mutants scanned as added training data for TCGA testing. Bottom rows are 133 SPOP non-mutants.

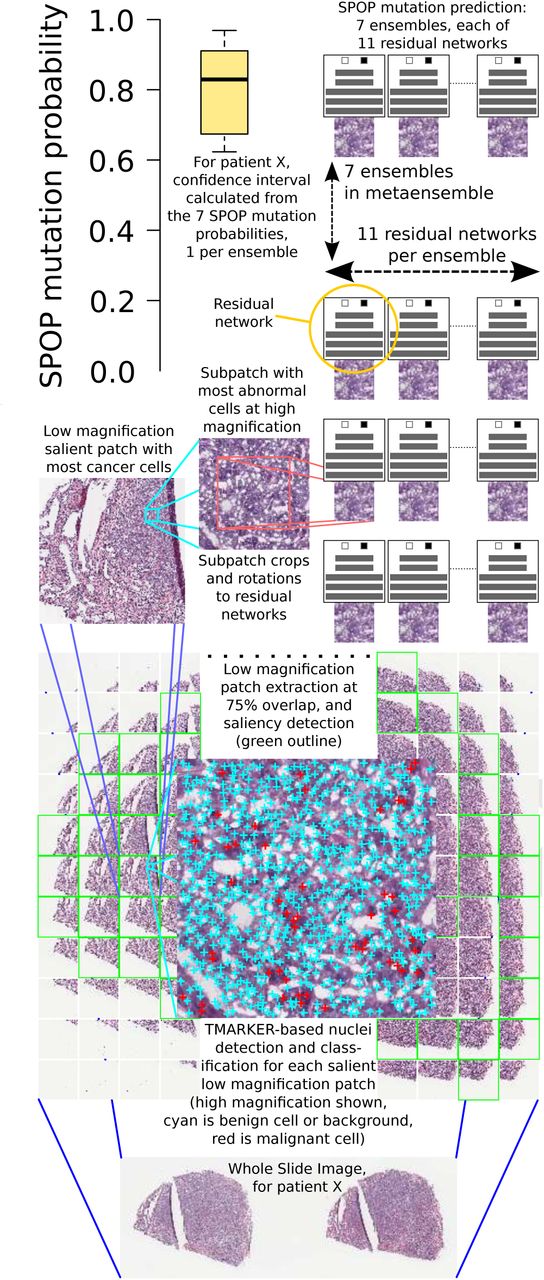
Pipeline: a whole slide image is split into patches (bottom) at low magnification. Salient patches are identified. The salient patch with the most cancer cells is deemed the “dominant tumor” patch and further analyzed. At high magnification, a sliding window within the dominant tumor patch finds the region with maximum abnormal cells. Deep neural networks then predict SPOP mutation and a confidence interval is calculated over these predictions.

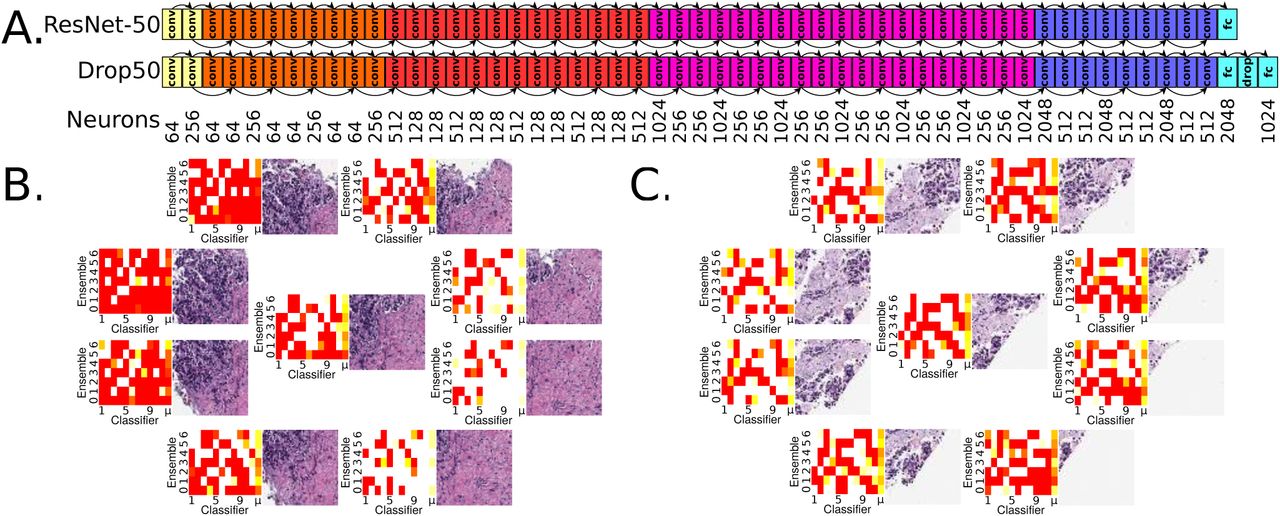
Panel A: ResNet-50 architecture [3], top. Customized Drop50 architecture supports ResNet-50 pretraining, but has additional dropout [4] and fully connected neuron layers. In practice at least one of these architectures converges to a validation accuracy of 0.6 or more. Convolutional layers “conv”, fully-connected layers “fc”, 50% dropout layer “drop”. ResNet-50 has 26,560 neurons and Drop50 has 28,574. All seven trials, each trial being a multiarchitectural ensemble of eleven residual networks, is 2,138,630 neurons total for TCGA training and MSK-IMPACT testing, and 2,132,858 neurons total for MSK-IMPACT training and TCGA testing. Panel B: Region of interest and surrounding octagon patches, each from an 800×800 pixel [px] patch cropped to 512×512px and scaled to 256×256px. At upper left, histological imagery leads to strong SPOP mutation predictions shown in red. At lower right, no such evidence exists and SPOP mutation is not predicted here, indicated in heatmaps as white rather than red. For each of the nine patches, the weighted mean prediction is calculated, shown in the heatmaps as the μ column at right. Each classifier in the ensemble makes a prediction for a patch, and classifiers having greater prediction variance among the nine patches are more weighted in the means for the patches. The metaensemble’s SPOP mutation prediction is 0. 6244, with 95% CI of 0.5218-0.7211 and 99% CI of 0.4949-0.7489, so this patient’s tumor is predicted to have an SPOP mutation at 95% confidence but not 99% confidence. Panel C: Another MSK-IMPACT patient shown for the TCGA-trained metaensemble, suggesting there is greater SPOP mutation histological evidence in the lower right. The metaensemble’s SPOP mutation prediction is 0.5528, with 95% CI of 0.5219-0.5867 and 99% CI of 0.5128-0.5962, so there is 99% confidence of SPOP mutation.

Stricter CIs reduce false negatives and maintain significant Fisher’s Exact p-values, but ignore more predictions as inconclusive (panels C2, C3, D2, D3 – and Alg S3). The metaensemble in panel C1 consists of seven ensembles, with Receiver Operating Characteristics for each shown in Fig S3. The MSK-IMPACT training to TCGA testing performance (0.01 < p < 0.05, panels D2 and D3) is expected due to MSK-IMPACT fixed sections being higher quality than TCGA frozen sections (Fig 1). Freezing distorts the slide by effecting watery and fatty tissues differently. Training on distorted data (TCGA) but testing on undistorted data (MSK-IMPACT) appears robust (0.001 < p < 0.01, panels C2 and C3) as expected, due to the classifiers learning SPOP-discriminative features despite distortions in the data. This is similar in principle to de-noising autoencoders learning to be robust to noise in their data.
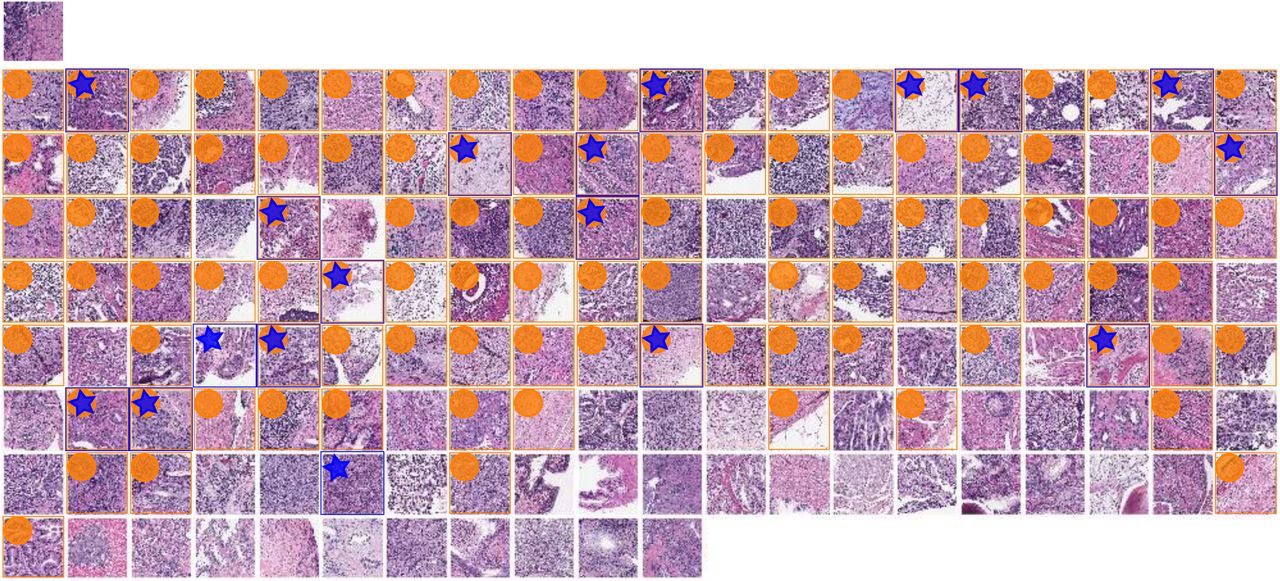
SPOP mutant query image at top left for CBIR using TCGA-trained metaensemble on MSK-IMPACT dataset, showing most similar images in top row, with most similar image leftmost. Less similar images in lower rows, ordered left to right by similarity. One image patch per patient shown. Though the full octagon of patches (Fig 4 panel B, for query) is considered for the query and each retrieved patient, only the center patch is shown here, with a blue surrounding box and star indicating SPOP mutation, while an orange box and circle indicates this retrieved patient’s predicted SPOP mutation 95% CI overlaps with that of the query patient. A 95% CI may in practice usefully limit the number of retrieved results. The most similar patient (top row, leftmost), second most, third, fourth, and fifth have dissimilarity scores of 0.073936, 0.092472, 0.107029, 0.108397, and 0.109131, respectively. The least similar patient (bottom right) has dissimilarity score 0.452150. Mean dissimilarity is 0.219295 with standard deviation 0.075968. Similarity is 1 - dissimilarity. The second most similar patient (top row, second from left) is a mutant, like the query. There are 5 mutants in the top row, 3 in the second, etc, with zero in the bottom row. Patients with SPOP mutation are more similar than patients without SPOP mutation for this query (p=0.02032, one-tailed Mann-Whitney U test).
Previously, pathologists described slide image morphologies, then correlated these to molecular aberrations, e.g. mutations and copy number alterations [9, 10]. Our deep learning approach instead learns features from the images without a pathologist, using one mutation as a class label, and quantifies prediction uncertainty with confidence intervals [CIs] (Fig 3).
Others used support vector machines to predict molecular subtypes in a bag-of-features approach over Gabor filters [11]. The authors avoided deep learning due to limited data available. Gabor filters resemble first layer features in a convolutional network. A main contribution of ours is using pre-training, Monte Carlo cross validation, and heterogeneous ensembles to enable deep learning despite limited data. We believe our method’s prediction of a single mutation is more clinically actionable than predicting broad gene expression subtypes.
Support vector machines, Gaussian mixture modeling, and principal component analyses have predicted PTEN deletion and copy number variation in cancer, but relied on fluorescence in situ hybridization [FISH], a very specific stain [12]. Our approach uses standard H&E, a non-specific stain that we believe could be utilized to predict more molecular aberrations than only the SPOP mutation that is our focus here. However, our method does not quantify tumor heterogeneity.
Tumor heterogeneity has been analyzed statistically by other groups [13], as a spatial analysis of cell type entropy cluster counts in H&E-stained whole slides. A high count, when combined with genetic mutations such as TP53, improves patient survival prediction. This count is shown to be independent of underlying genetic characteristics, whereas our method predicts a genetic characteristic, i.e. SPOP mutation, from convolutional features of the imaging.
Clustering patients according to hand-engineered features has been prior practice in histopathology CBIR, with multiple pathologists providing search relevancy annotations to tune the search algorithm [14]. Our approach relies on neither pathologists nor feature engineers, and instead learns discriminative genetic-histologic relationships in the dominant tumor to find similar patients. We also do not require a pathologist to identify the dominant tumor, so our CBIR search is automated on a whole slide basis. Because the entire slide is the query, we do not require human judgement to formulate a search query, so CBIR search results may be precalculated and stored for fast lookup.
Results
Molecular information as labels of pathology images opens a new field of molecular pathology
Rather than correlating or combining genetic and histologic data, we predict a gene mutation directly from a whole slide image with unbiased H&E stain. Our methods enable systematic investigation of other genotype and phenotype relationships, and serve as a new supervised learning paradigm for clinically actionable molecular targets, independent of clinician-supplied labels of the histology. Epigenetic, copy number alteration, gene expression, and post-translational modification data may all label histology images for supervised learning. Future work may refine these predictions to single-cell resolution, combined with single-cell sequencing, immunohistochemistry, FISH, mass cytometry[15], or other technologies to label corresponding H&E images or regions therein. We suggest focusing on labels that are clinically actionable, such as gains or losses of function.
SPOP mutation state prediction is learnable from a small set of whole slides stained with hematoxylin and eosin
Despite SPOP being one of the most frequently mutated genes in prostate adenocarcinomas[8], from a TCGA cohort of 499 patients only 177 passed our quality control (Alg S1) and only 20 of these had SPOP mutation. Meanwhile in the 152-patient MSK-IMPACT cohort there were only 19 SPOP mutants, and though we could scan an additional 36 SPOP mutant archived slides, there are difficulties in practice acquiring large cohorts of patients with both quality whole slide cancer pathology images and genetic sequencing represented. This challenge increases for rare genetic variants. Moreover, different cohorts may have different slide preparations and appearances, such as TCGA being frozen sections and MSK-IMPACT being higher quality formalin-fixed paraffin embedded sections (Fig 1). Nonetheless, our pipeline (Fig 3) accurately predicts whether or not SPOP is mutated in the MSK-IMPACT cohort when trained on the TCGA cohort (Fig 5), and vice versa. We leverage pretrained neural networks, Monte Carlo cross validation, class-balanced stratified sampling, and architecturally heterogeneous ensembles for deep learning in this “small data” setting of only 20 positive examples, which may remain relevant for rare variants as more patient histologies and sequences become available in the future.
SPOP mutation state prediction is accurate and the prediction uncertainty is bounded within a confidence interval
Our pipeline’s accuracy in SPOP mutation state prediction is statistically significant: (i) within held-out test datasets in TCGA,
(ii) within held-out test datasets in MSK-IMPACT, (iii) from TCGA against the independent MSK-IMPACT cohort (Fig 5), and (iv) vice versa. The confidence interval [CI] calculated using seven ResNet ensembles allows every prediction to be evaluated statistically: is there significant evidence for SPOP mutation in the patient, is there significant evidence for SPOP non-mutation in the patient, or is the patient’s SPOP mutation state inconclusive. Clinicians may choose to follow the mutation prediction only if the histological imagery provides acceptably low uncertainty.
SPOP mutation state prediction is automated and does not rely on human interpretation
Unlike Gleason score, which relies on a clinician’s interpretation of the histology, our pipeline is automated (Fig 3) – though detecting overstain, blur, and mostly background in the slide are not yet automated (Alg S1). The pipeline’s input is the whole digital slide and the output is the SPOP mutation prediction bounded within 95% and 99% CIs. Moreover, our pipeline does not require a human to identify a representative region in the slide, as is done to create tissue microarrays [TMAs] from slides.
SPOP mutation state prediction finds patients that appear to share the same genetic driver of disease
Each ensemble (Fig 3) may be used as a feature to predict patient similarity, where similar patients on average share the same ensemble-predicted SPOP mutation probability (Fig 6). A patient’s histology may be studied in the context of similar patients’ for diagnostic, prognostic, and theragnostic considerations.
Molecular pathology, such as characterizing histology in terms of SPOP mutation state, leads directly to precision medicine
For instance, non-mutant SPOP ubiquitinylates androgen receptor [AR], to mark AR for degradation, but mutant SPOP does not. Antiandrogen drugs, such as flutamide and enzalutamide, promote degradation of AR to treat the cancer, though mutant AR confers resistance [16, 17].
SPOP mutation state prediction provides information regarding other molecular states
SPOP mutation is mutually exclusive with TMPRSS2-ERG gene fusion [8], so our SPOP mutation predictor provides indirect information regarding the TMPRSS2-ERG state and potentially others.
Discussion
We summarize a whole slide with a maximally abnormal subregion within the dominant tumor, such that the vast majority of the slide is not used for deep learning. Tissue microarrays take a similar though manual approach, using a small circle of tissue to represent a patient’s cancer. In a sense, our patch extraction, saliency prediction, and TMARKER-based cell counting pipeline stages together model how a representative patch may be selected to identify the dominant cancer subtype in the slide overall, ignoring other regions that may not have the same genetic drivers. This subregion has many desirable properties: (i) it is salient at low magnification, i.e. diagnostically relevant to a pathologist at the microscope [18], (ii) it has the maximum number of malignant cells at low magnification, which is a heuristic to locate the dominant tumor, presumably enriched for cells with driver mutations such as SPOP due to conferred growth advantages and reflected in the bulk genetic sequencing we use as mutation ground truth, (iii) it has the maximum number of abnormal cells at high magnification, which is a heuristic to locate a subregion with most nuanced cellular appearance, presumably concentrated with cellular-level visual features that can discriminate between cancers driven by SPOP versus other mutations, and (iv) at 800×800 pixels, it is large enough at high magnification to capture histology, e.g. gland structure.
A holistic approach that considers for deep learning patches spatially distributed widely throughout the slide, rather than only the dominant tumor, could improve performance and provide further insight. Gleason grading involves such a holistic approach, identifying first and second most prevalent cancer morphologies in a whole slide. The complexities of multiple and varying counts of representatives per slide are future work.
We use multiple classifier ensembles to predict the SPOP mutation state. Though each residual network [3] classifier tends to predict SPOP mutation probability in a bimodal distribution, i.e. being either close to 0 or close to 1, averaging these classifiers within an ensemble provides a uniform distribution representing the SPOP mutation probability (Fig S2).
Deep learning typically requires large sets of training data, yet we have only 20 patients with SPOP mutation, nearly an order of magnitude fewer than the 157 patients without somatic SPOP mutation in the TCGA cohort. Deep learning in small data is a challenging setting. We confront this challenge by training many residual networks [ResNets] on small draws of the data (Alg S2), in equal proportions of SPOP mutants and SPOP non-mutants, then combining the ResNets as weak learners, to produce a strong learner ensemble [19, 20], similar in principle to a random forest ensemble of decision trees [21]. Empirically, the great depth of ResNets appears to be important because CaffeNet [22] – a shallower 8-layer neural network based on AlexNet [23] – so rarely achieved validation accuracy of 0.6 or more predicting SPOP mutation state than an ensemble could not be formed.
Pretraining the deep networks is essential in small data regimes such as ours, and we use the ResNet-50 model pretrained on ImageNet [3]. We used both the published ResNet-50 and our customized ResNet-50 that included an additional 50% dropout [4] layer and a 1024-neuron fully-connected layer. In practice, for difficult training set draws, often at least one of these architectures converged to validation accuracy of 0.6 or more. For data augmentation, the 800×800px images at high magnification were trimmed to the centermost 512×512px in 6 degree rotations, scaled to 256×256px, flipped and unflipped, then randomly cropped to 224×224 within Caffe [22] for training. Learning rates varied from 0.001 to 0.007, and momentums from 0.3 to 0.99. Test error tended to be worse with momentum less than 0.8, though low momentum allowed convergence for difficult training sets. Learning rates of 0.001, 0.0015, or 0.002 with momentum of 0.9 was typical. We used nVidia Titan-X GPUs with 12GB RAM for training. At 12GB, one GPU could train either ResNet architecture using a minibatch size of 32 images.
Materials and Methods
Please see Section S1 for discussion of (i) digital slide acquisition and quality control, (ii) region of interest identification, (iii) data augmentation, (iv) deep learning, and (v) cross validation.
Ensemble aggregation
To estimate generalization error, the 11 classifiers in a trial were selected by highest validation accuracy to form an ensemble, and a metaensemble from 7 independent trial ensembles. A 95% basic bootstrapped CI2 indicated generalization accuracy from these 7 trials was 0.58-0.86 on TCGA (Fig 5 panel A) and 0.61-0.83 on MSK-IMPACT (Fig 5 panel B), – both significantly better than 0.5 chance. On TCGA, metaensemble AUROC was 0.74 (p=0.00024), accuracy was 0.70, and Fisher’s Exact Test p=0.00070 (Fig 5 panel C1). On MSK-IMPACT, metaensemble AUROC was 0.75 (p=0.00017), accuracy was 0.73, and Fisher’s Exact Test p=0.00010 (Fig 5 panel D1). These two single-dataset estimates indicate the method performs significantly better than chance on unseen data. We formed tuned ensembles (Fig S4), where 11 classifiers in a trial were selected by highest ensemble test accuracy, which no longer estimates generalization error but promotes correct classification on average across ensembled classifiers for each test example (Fig 5, panels A and B, white versus gray at right).
Independent evaluation
We tested the TCGA-trained metaensemble of 7 tuned 11-classifier ensembles on the MSK-IMPACT cohort, and vice-versa. Each patient had one slide. For each slide, a central region of interest and surrounding octagon of patches were found, for nine patches per slide (Fig 4 panels B and C). We hypothesized that SPOP mutation leads to 1-2 nine-patch-localized lesions, meaning adjacent patches have similar classifier-predicted SPOP mutation probability. Therefore, we first calculated the SPOP mutation prediction weighted mean over all classifiers in an ensemble, with classifiers having greater nine-patch prediction variance being more weighted in the mean. Second, of the nine patches we formed all possible groups of three adjacent patches and assigned to a group the minimum SPOP mutation prediction weighted mean of any patch in the grouped three, then took the second-greatest group as a classifier’s overall patient cancer SPOP mutation prediction. Within an ensemble, we weighted a classifier’s overall prediction by the classifier’s nine-patch mutation prediction variance, because classifiers with high variance (e.g. mostly mutant, but 1-3 of nine non-mutant) reflect the lesion hypothesis better than classifiers that predict all non-mutant (0) or all mutant (1). Thus on MSK-IMPACT, the TCGA metaensemble assigned stochastically greater scores to mutants than non-mutants (AU-ROC 0.86) and accurately distinguished mutants from non-mutants (Fisher’s Exact p=0.00379) (Fig 5 panel C2). Moreover on TCGA, the MSK-IMPACT metaensemble assigned stochastically greater scores to mutants than non-mutants (AUROC 0.64) and accurately distinguished mutants from non-mutants (Fisher’s Exact p=0.03056) (Fig 5 panel D2).
CBIR evaluation
The metaensemble consists of seven ensembles. Each ensemble predicts SPOP mutation probability as a uniformly distributed random variable (Fig S2). Each ensemble is tuned to a different test set (Sec S2 and Table S1), so we treat each ensemble’s prediction as a feature, for seven 32-bit SPOP CBIR features total. For CBIR, a patient’s dissimilarity to the query patient is the mean of absolute differences in these seven features, e.g. a dissimilarity of 0.2 means on average an ensemble predicts the patient’s SPOP mutation probability is 0.2 different than the query. A similarity score is 1 minus dissimilarity. We evaluated the TCGA-trained metaensemble on each of the 19 SPOP mutants in MSK-IMPACT (Fig 1), for each mutant calculating a CBIR p-value, with a low p-value indicating it is not due to chance alone that dissimilarities of mutants were lower than non-mutant dissimilarities (Fig 6). To conduct a metaanalysis of these 19 dependent p-values, we may use neither (a) Fisher’s Method [24] because our p-values are not independent, nor (b) Empirical Brown’s Method [25] because 100 p-values are required for convergence, so we used Kost’s Method3 [26]. Kost’s Method found an overall p=0.024076 (14.6 degrees of freedom [d.f.]), so it is not due to chance alone that our CBIR returns SPOP mutant patients with lower dissimilarity scores than non-mutants for each SPOP mutant patient query. Similarly, our CBIR tool returned non-mutant patients with lower dissimilarity than SPOP mutants for each of the 133 MSK-IMPACT non-mutant patients (p=0.016960 Kost’s Method, 22.2 d.f.).
Acknowledgments
AJS was supported by NIH/NCI grant F31CA214029 and the Tri-Institutional Training Program in Computational Biology and Medicine (via NIH training grant T32GM083937). TJF was supported by an MSK Functional Genomics Initiative grant. This research was funded in part through the NIH/NCI Cancer Center Support Grant P30CA008748. We gratefully acknowledge NVIDIA corporation for GPU support under the GPU Research Center award to TJF. TJF is a founder, equity owner, and Chief Scientific Officer of Paige.AI.
Footnotes
Authors declare no conflicts of interest.
↵1 TCGA data courtesy the TCGA Research Network http://cancergenome.nih.gov/
↵2 We used the R boot library for basic bootstrap CIs. Canty and Ripley 2016: https://cran.r-project.org/web/packages/boot/index.html
↵3 We used Kost’s Method from R package EmpiricalBrownsMethod https://www.bioconductor.org/packages/devel/bioc/vignettes/EmpiricalBrownsMethod/inst/doc/ebmVignette.html
References


