

Abstract
Across a large variety of Mendelian disorders, 50 to 75% of undiagnosed patients do not receive a genetic diagnosis by whole exome sequencing indicative of underlying regulatory variants. In contrast, whole genome sequencing allows the discovery of all genetic variants, but their significant number, coupled with a poor understanding of the non-coding genome, makes their prioritization challenging. Here, we demonstrate the power of directly sequencing transcriptomes by providing a genetic diagnosis for 11% (5 of 47) of unsolved mitochondrial disease patients and strong candidates for other patients. We found a median of 1 aberrantly expressed gene, 5 aberrant splicing events, and 6 mono-allelically expressed rare variants in patient-derived fibroblasts and established disease-causing roles for each kind. Private exons often arose from sites that are weakly spliced in other individuals, providing an important clue for future variant prioritization. One such intronic exon-creating variant was found in three unrelated families in the complex I assembly factor TIMMDC1, which we consequently established as a novel disease-associated gene. In conclusion, our study expands the diagnostic tools for detecting non-exonic variants of Mendelian disorders and provides examples of intronic loss-of-function variants with pathological relevance.
To investigate RNA sequencing (RNA-seq) as a diagnostic tool for Mendelian disorders, we considered mitochondrial disorders for three reasons. First, mitochondrial disorders represents the most frequent inborn errors of metabolism affecting 1 in 4,300 birth1. Second, the genetic basis is large with causative defects identified in approximately 300 genes and a presumably large number of additional disease-associated genes still awaiting identification2. Third, for the majority of patients, disease mechanisms can be assayed in dermal fibroblasts even though the disease may manifest in different tissues3. This allows rapid demonstration of the necessary and sufficient role of candidate variants by complementation assays4. It also indicates that disease-causing expression defects, if any, should be detectable in these cells.
We selected 105 patient fibroblast cell lines, 47 from cases without genetic diagnosis. These patients serve as good controls for each other, since, as for other rare disorders, it is unlikely that many share a single genetic cause. RNA-seq identified 12,680 transcribed genes across all samples (Online Methods). We systematically searched for three possible causes for the rare disorder: i) genes with aberrant expression level5–7, ii) genes with aberrant splicing8 and iii) mono-allelic expression of rare variants9 (Fig. 1). Once normalized for technical biases, sex, and biopsy site (Supplementary Fig. 1), the samples typically presented few aberrantly expressed genes (median of 1, Fig. 2a) with unusually large (|Z-score| > 3) and significant differential expression (Hochberg adjusted P-value < 0.05). When searching for aberrantly expressed genes encoding mitochondrial proteins, we found MGST1 in one and TIMMDC1 in two samples, significantly reduced (Fig. 2b-d and Supplementary Fig. 2). For both genes, no variant was reported to be disease-associated and no case of potential bi-allelic rare variant is listed in our inhouse database comprising more than 1,200 whole-exomes from mitochondriopathy patients and from 10,000 controls. To evaluate the consequences of reduced RNA expression on the protein level we performed quantitative proteomics from a second aliquot of cells taken at the same time as the transcript aliquot in a total number of 31 patients. With 2% remaining of MGST1 and lack of detection of TIMMDC1 in the respective samples, the quantification unraveled an even stronger effect on protein level, indicating a loss of function (Fig. 2e and Supplementary Fig. 3). MGST1, a microsomal glutathione S-transferase, is involved in the oxidative stress defense10. Consequently, the loss of expression of MGST1 is a likely cause of the disease of the patient, who suffers from an infantile-onset neurodegenerative disorder similar to a recently published case with another defect in the reactive oxygen species (ROS) defense system (Supplementary Information)11, but also suggested a treatment with antioxidants. Both TIMMDC1 patients presented with muscular hypotonia, developmental delay and neurological deterioration leading to death in the first 3 years of life (Supplementary Information). Consistent with the described function of TIMMDC1 as a respiratory chain complex I assembly factor12,13, we found isolated complex I deficiency in muscle (Supplementary Fig. 2), and globally decreased levels of complex I subunits in fibroblasts by quantitative proteomics (Fig. 2e and Supplementary Fig. 2) and western blot (Fig. 2f). Re-expression of TIMMDC1 in these cells increased complex I subunit levels (Fig. 2f). These results not only validate TIMMDC1-deficiency as disease causing but also provide compelling evidence for an important function of TIMMDC1 in complex I assembly.

The approach we followed started with RNA sequencing of fibroblasts from unsolved WES patients. Three strategies to facilitate diagnosis were pursued: Detection of aberrant expression (i.e. depletion), aberrant splicing (i.e. exon creation) and mono-allelic expression of the alternative allele (i.e. A as alternative allele). Candidates were validated by proteomic measurements, lentiviral transduction of the wildtype (wt) allele or, in particular cases, by specific metabolic supplementation.

(a) Aberrantly expressed genes (Hochberg corrected P-value < 0.05 and |Z-score| > 3) for each patient fibroblasts. (b) Gene-wise RNA expression volcano plot of nominal P-values (- log10 P-value) against Z-scores of the patient #35791 compared against all other fibroblasts. Absolute Z-scores greater than 5 are plotted at ±5, respectively. (c) Same as (b) for patient #73804. (d) Sample-wise RNA expression is ranked for the genes TIMMDC1 (top) and MGST1 (bottom). Samples with aberrant expression for the corresponding gene are highlighted in red (#73804, #35791, and #66744). (e) Gene-wise comparison of RNA and protein fold changes of patient #35791 against all other fibroblast cell lines. Subunits of the mitochondrial respiratory chain complex I are highlighted (red squares). Reliably detected proteins that were not detected in this sample are shown separately with their corresponding RNA fold changes (points below solid horizontal line). (f) Western blot of TIMMDC1, NDUFA13, NDUFB3, and NDUFB8 protein in three fibroblast cell lines without (#62346, #91324, #NHDF) and three with a variant in TIMMDC1 (#35791, #66744, #96687), and fibroblasts re-expressing TIMMDC1 (“-T”) (#35791-T, #66744-T, #96687-T). UQCRC2 was used as loading control. MW, molecular weight; CI, complex I subunit; CIII, complex III subunit. (g) Blue native PAGE blot of the control fibroblasts re-expressing TIMMDC1 (NHDF-T), the control fibroblasts (NHDF), patient fibroblasts (#96687), and patient fibroblast re-expressing TIMMDC1 (#96687-T). Immunodecoration for complex I and complex III was performed using NDUFB8 and UQCRC2 antibodies, respectively. CI, complex I subunit; CIII, complex III subunit.
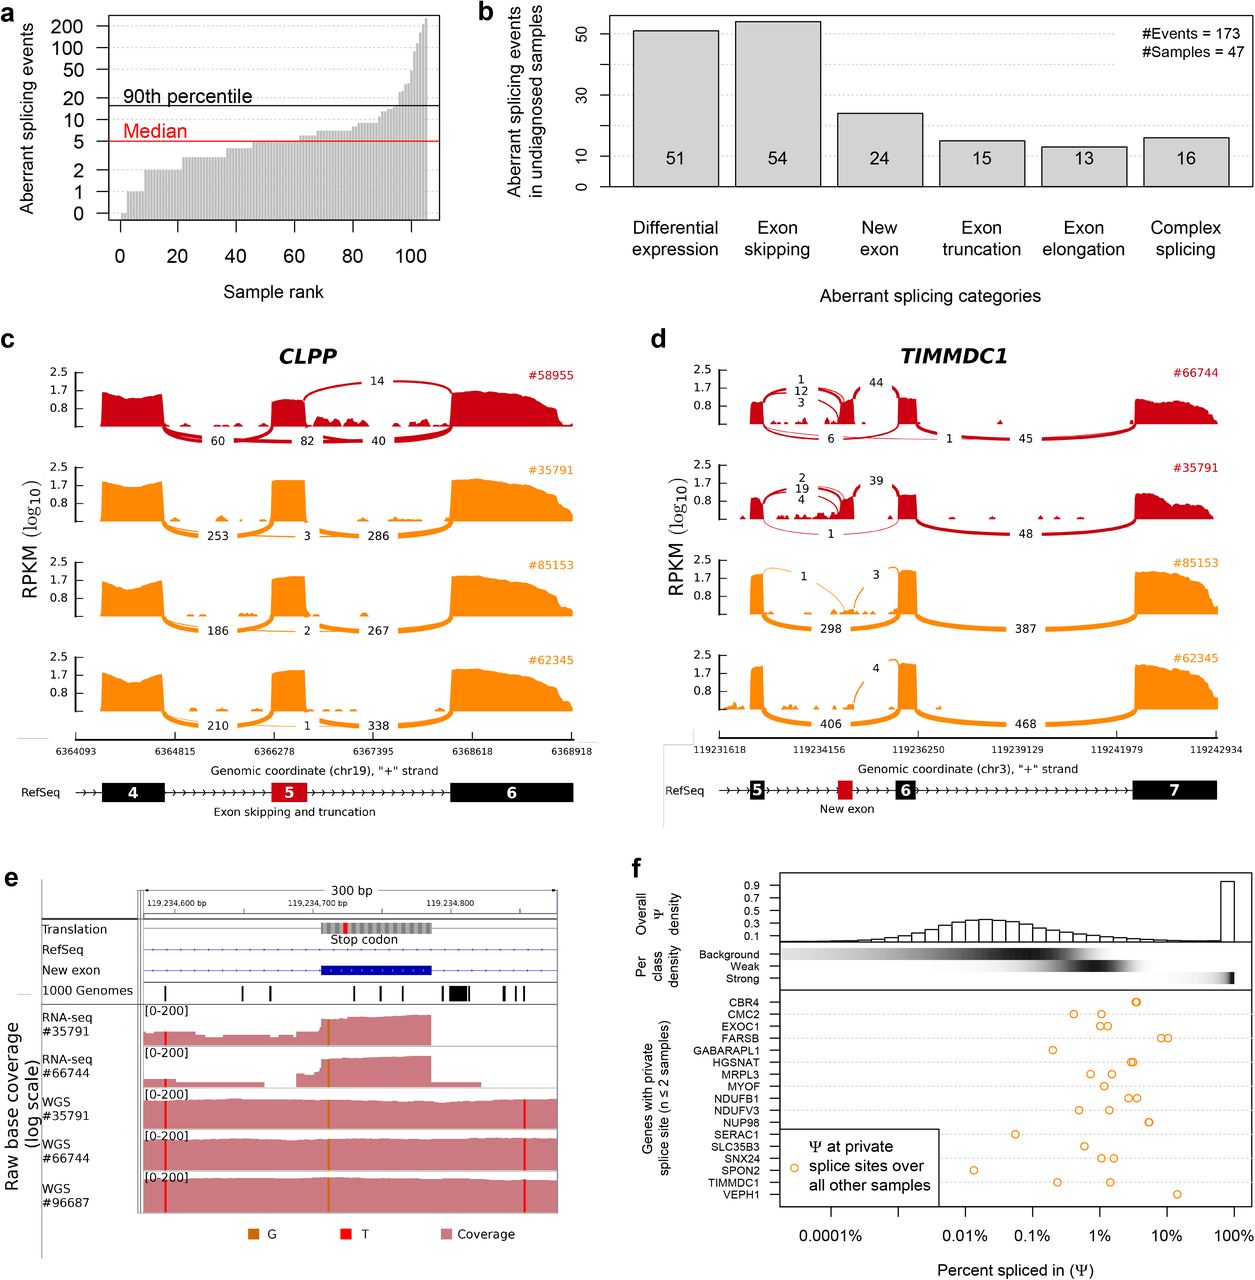
We identified aberrant splicing events by testing for differential splicing in each patient against all others using an annotation-free algorithm to detect splice sites (Online Methods, median of 5 abnormal events per sample, Fig. 3a). Among the 173 aberrant splicing events detected in the undiagnosed patients, the most abundant events were, apart from differential expression of isoforms, exon skipping followed by the creation of new exons (Fig. 3b). Two genes encoding mitochondrial proteins, TIMMDC1 and CLPP, were among the 10 most significant genes (Supplementary Table 1). Out of 136 exon-junction reads overlapping the acceptor site of CLPP exon 6 for patient #58955, 82 (percent spliced in Ψ = 60%) skipped exon 5, and 14 (Ψ = 10%) showed a 3’-truncated exon 5, in striking contrast to other samples (Fig. 3c). The likely genetic cause of these two splice defects is a rare homozygous variant (c.661G>A, 1.2 × 10⁻⁵ frequency in the ExAC14 of the last nucleotide of exon 5 uniquely found in this patient (Supplementary Fig. 4). Both splice defects are predicted to result in truncated CLPP and western blots corroborated the complete loss of full-length CLPP (Supplementary Fig. 4). CLPP codes for a mitochondrial ATP-dependent endopeptidase15. CLPP-deficiency causes Perrault-syndrom16,17 resembling the clinical presentation of the patient including microcephaly, deafness, and severe psychomotor retardation confirming the molecular diagnosis (Supplementary Information).

(a) Aberrant splicing events (Hochberg corrected P-value < 0.05) for all fibroblasts. (b) Aberrant splicing events (n=173) grouped by their splicing category in undiagnosed patients (n=47). (c) CLPP Sashimi plot of exon skipping and truncation events in affected and unaffected fibroblasts (red and orange, respectively). The RNA coverage is given as the log10 RPKM-value and the number of split reads spanning the given intron is indicated on the exon-connecting lines. At the bottom the gene model of the RefSeq annotation is depicted. The aberrantly spliced exon is colored in red. (d) Same as in (c) for TIMMDC1. At the bottom the newly created exon is depicted in red within the RefSeq annotation track. (e) Coverage tracks (light red) for patients #35791, #66744, and #91324 based on RNA and whole genome sequencing. For patient #91324 only WGS is available. The homozygous SNV c.596+2146A>G is present in all coverage tracks (vertical orange bar). The top tracks show the genomic annotation: genomic position on chromosome 3, DNA sequence, amino acid translation (grey, stop codon in red), the RefSeq gene model (blue line), the predominant additional exon of TIMMDC1 (blue rectangle), and the SNV annotation of the 1000 Genomes Project (each black bar represents one variant). (f) Percent spliced in (Ψ) distribution for different splicing classes and genes. Top: Histogram giving the genome-wide distribution of the 3’ and 5’ Ψ-values based on all reads over all samples. Middle: The shaded horizontal bars represent the densities (black for high density) of the background, weak and strong splicing class, respectively (Methods). Bottom: Ψ-values of the predominant donor and acceptor splice sites of genes with private splice sites (i.e found dominant in at most two samples) computed over all other samples.
Split read distribution indicated that both TIMMDC1-deficiency patients expressed almost exclusively a TIMMDC1 isoform with a new exon in intron 5 (Fig. 3d). This new exon introduces a frameshift yielding a premature stop codon (p.Gly199_Thr200ins5*, Fig. 3e). Moreover, this new exon contained a rare variant (c.596+2146A>G) not listed in The 1000 Genomes Project18,19. Whole genome sequencing (WGS) demonstrated that this variant is homozygous in both patients (Fig. 3e). WGS of 60 further pediatric cases revealed an additional family with three affected siblings and similar clinical symptoms carrying the same homozygous intronic variant (Fig. 3e, Supplementary Fig. 2). Two siblings died before the age of 10 years. The younger brother (#96687), now 6 years, presented, similar to the patients described above, with muscle hypotonia, failure to thrive and neurological impairment (Supplementary Information). Western blot analysis confirmed TIMMDC1-deficiency (Fig. 2f) and impaired complex I assembly which was restored after re-expression of TIMMDC1 (Fig. 2g). The discovery of the same intronic TIMMDC1 variant in three unrelated families from three different ethnicities convincingly demonstrated the causality of this variant for the TIMMDC1 loss-of-function.
In almost all non-TIMMDC1-deficiency samples, we noticed a few split reads supporting inclusion of the new exon (Fig. 3d), consistent with an earlier report that many cryptic splice sites are not entirely repressed but active at low levels20. Splicing defects are increasingly recognized to play a major role in Mendelian21 and common disorders8. We set out to quantify this phenomenon and to ask how frequent private exons originate from weakly spliced exons, independently of their possible association with disease. Therefore, we modeled the distribution of Ψ for the 1,603,042 splicing events detected genome-wide in 105 samples as a mixture of three components. This classified splicing frequencies per splice site as strong (20%, Ψ > 0.053), weak (16% < Ψ <), or background (64%, Ψ < 0.0016, Online Methods, Fig. 3f and Supplementary Fig. 5). Strikingly, the majority (70%) of the 30 private exons we discovered originated from weak splice sites (Fig. 3f bottom). Our finding shows that weakly spliced cryptic exons are loci more susceptible to turn into strongly spliced sites than other intronic regions. Hence, these results suggest that the prioritization of deep intronic variants of unknown significances gained through WGS could be improved by annotating weak splice sites and their resulting cryptic exon.
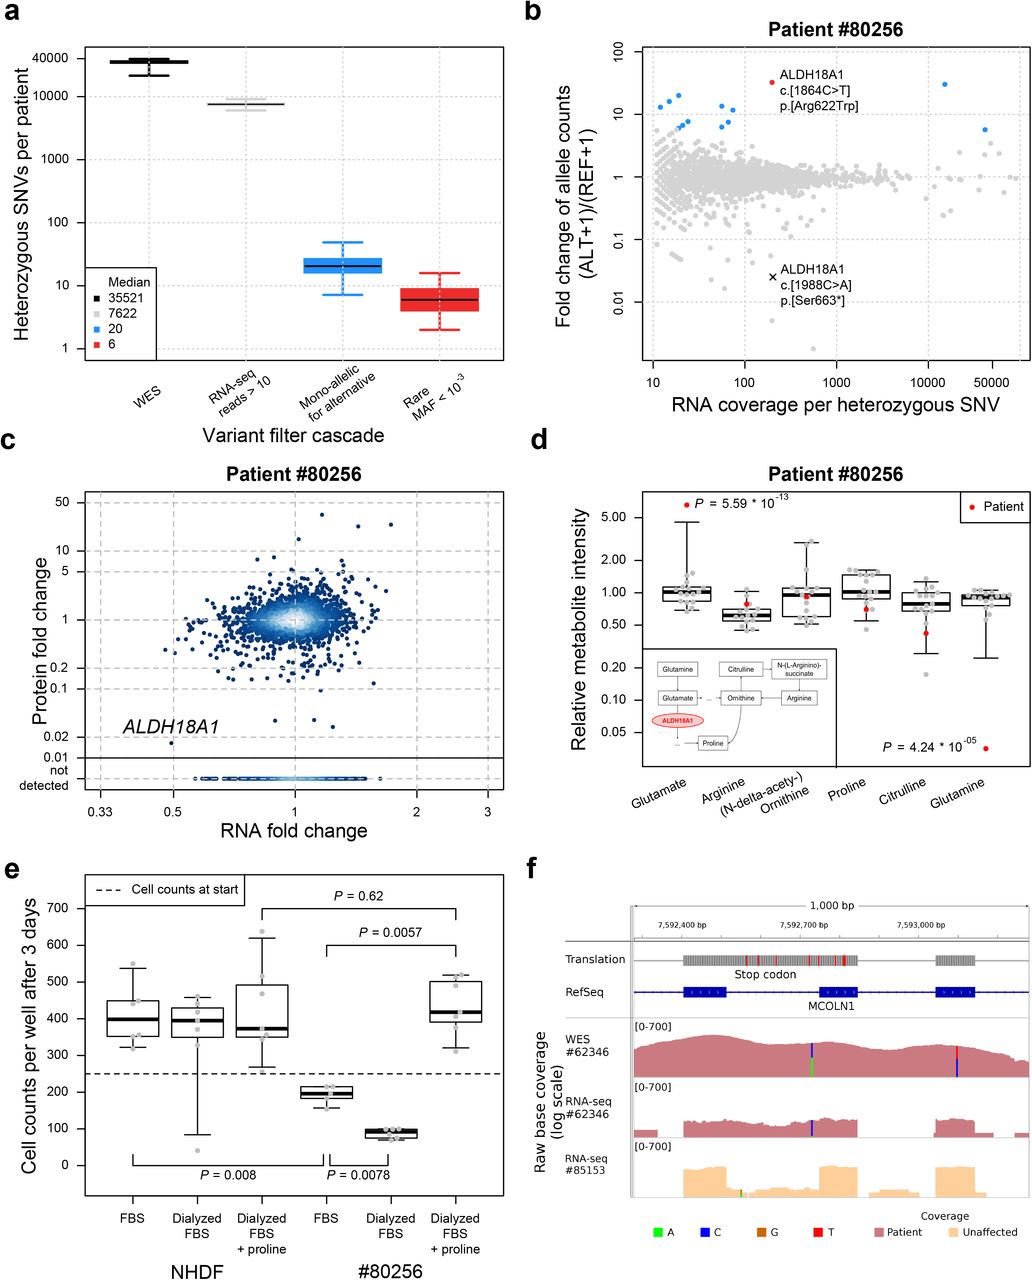
As a third approach to discover regulatory variants, we searched for mono-allelic expression (MAE) of rare variants. Out of 35,521 heterozygous SNVs detected by WES, 7,622 were sufficiently covered by RNA-seq to call MAE (more than 10 reads), 20 showed MAE of which 6 were rare (numbers as median per patient, Fig. 4a). One patient (#80256) showing significant mono-allelic expression of a rare SNV of unknown significance in ALDH18A1 (c.1864C>T, p.Arg622Trp), encoding an enzyme involved in mitochondrial proline metabolism22,23, was compound heterozygous with a nonsense variant (c.1988C>A, p.Ser663*) (Fig. 4b and Supplementary Fig. 6). Since the clinical presentation of the patient was not consistent with reported ALDH18A1-deficiency cases, the patient had remained without diagnosis. Although the detected allele was expressed at its normal level, the quantitative proteome investigation showed severe reduction down to 2% of ALDH18A1 (Fig. 4c), indicating that the rare variant may affect translation or protein stability. Metabolomics profile of blood plasma was in accordance with a defect in proline metabolism (Fig. 4d) and the following changes in urea cycle. Patient fibroblasts showed a growth defect that was rescued by supplementation of proline, validating impaired proline metabolism as disease cause (Fig. 4e). In another patient (#62346) with two mutations in MCOLN1 (c.681-19A>C, p. Lys227_Leu228ins16* and c.832C>T, p.Gln278*), we found MAE of the intronic variant. The allele with the nonsense mutation was not detected, most likely due to nonsense-mediated decay. In contrast, the intronic variant was detected at low levels expressed as part of a retained intron, which introduced a nonsense codon (Fig. 4f and Supplementary Fig. 7). Mutations in MCOLN1 are associated with mucolipidosis24, which resembles the clinical presentation of the patient (Supplementary Information) and established the genetic diagnosis.

(a) Distribution of heterozygous single nucleotide variants (SNVs) across samples for different consecutive filtering steps. Heterozygous SNVs detected by exome sequencing (black), SNVs with RNA-seq coverage of at least 10 reads (gray), SNVs where the alternative allele is mono-allelically expressed (alternative allele frequency > 0.8 and Benjamini-Hochberg corrected P-value < 0.05, blue), and the rare subset of those (ExAC minor allele frequency < 0.001, red). (b) Fold change between alternative (ALT+1) and reference (REF+1) allele read counts for the patient #80256 compared to total read counts per SNV within the sample. Points are colored according to the groups defined in (a). (c) Gene-wise comparison of RNA and protein fold changes of the patient #80256 against all other patients’ fibroblasts. The position of the gene ALDH18A1 is highlighted. Reliably detected proteins that were not detected in this sample are shown separately with their corresponding RNA fold changes (points below solid horizontal line). (d) Relative intensity for metabolites of the proline biosynthesis pathway (inlet) for the patient #80256 and 16 healthy controls of matching age. Equi-tailed 95% interval (whiskers), 25th, 75th percentile (boxes) and median (bold horizontal line) are indicated. Data points belonging to the patient are highlighted (red circles and triangles, if Student’s t-test P-value < 0.05). (e) Cell counts under different growth conditions for the normal human dermal fibroblast (NHDF) and patient #80256. Both fibroblasts were grown in fetal bovine serum (FBS), dialyzed FBS (without proline) and dialyzed FBS with proline added. Boxplot as in (d). P-values are based on a two-sided Wilcoxon test. (f) Intron retention for MCOLN1 in patient #62346. Tracks from top to bottom: genomic position on chromosome 19, amino acid translation (red for stop codons), RefSeq gene model, coverage of whole exome sequencing of patient #62346, RNA-seq based coverage for patients #62346 and #85153 (red and orange shading, respectively). SNVs are indicated by non-reference colored bars with respect to the corresponding reference and alternative nucleotide.
Altogether, our study demonstrates the power of RNA sequencing in combination with stringent filter criteria for genetic diagnosis by discovering a new disease-associated gene, by providing a diagnosis for 11% (5 of 47) of unsolved cases, and by identifying strong candidates for other patients (Fig 5a). To our surprise, most identified variants are intronic, affected splicing and caused loss of function (Fig 5b). We further show that private exons often arise from loci with weak splicing of about 1%. We use fibroblast cell lines since the disease-affected tissue was not available, which is typical in clinical practice. Non-affected tissues have the advantage that the regulatory consequences on other genes are limited and therefore the causal defects are more likely to stand out as outliers25. In conclusion, we foresee RNA sequencing as an essential companion of genome sequencing to address unsolved cases.

(a) Discovery and validation of hidden variant effects in TIMMDC1, MGST1, CLPP, ALDH18A1, and MCOLN1 by RNA sequencing. The median number (± median absolute deviation) of candidate genes is given per detection strategies. Dotted check, not significant. (b) Schematic representation of variant causing splicing defects for TIMMDC1 (top, new exon red box), CLPP (middle, exon skipping and truncation), and MCOLN1 (bottom, intron retention). Variants are depicted by a red star.
Methods
Exome sequencing
Exome sequencing was essentially performed as described previously1. In brief, exonic regions were enriched using the SureSelect Human All Exon kit from Agilent (Supplemental Table 2) followed by sequencing as 100 bp paired-end runs on a Illumina HiSeq2000 and Illumina HiSeq2500 (AG_50MB_v4 and AG_50MB_v5 exome kit samples) or as 76 bp paired-end runs on the Illumina GAIIx (AG_38MB_v1 and AG_50MB_v3 exome kit samples).
Processing of Exome sequencing files
Read alignment to the human reference genome (UCSC Genome Browser build hg19) was done using Burrows-Wheeler Aligner2 (v.0.7.5a). Single-nucleotide variants and small insertions and deletions (indels) were detected with SAMtools3,4(version 0.1.19). Variants with a quality score below 90, a genotype quality below 90, a mapping quality below 30, and a read coverage below 10 were discarded. The reported variants and small indels were annotated with the most severe entry by the Variant Effector Predictor5 based on The Sequence Ontology term ranking 6. Variants with a frequency < 0.001 within the ExAC database7 were defined as rare. Variants within a 5 bp window around a splice site were considered as splice site variants.
Cell culture
Primary patient fibroblast cell lines, normal human dermal fibroblasts (NHDF) from neonatal tissue (Lonza), and 293FT cells (Thermo Fisher Scientific) were cultured in high glucose DMEM (Life Technologies) supplemented with 10% FBS, 1% penicillin/streptomycin, and 200 μM uridine at 37 °C and 5% CO2. All fibroblast cell lines have been tested negative for mycoplasma contamination.
RNA sequencing
Non-strand specific, polyA-enriched RNA sequencing was performed as described earlier8. Briefly, RNA was isolated from whole-cell lysates using the AllPrep RNA Kit (Qiagen) and RNA integrity number (RIN) was determined with the Agilent 2100 BioAnalyzer (RNA 6000 Nano Kit, Agilent). For library preparation, 1 μg of RNA was poly(A) selected, fragmented, and reverse transcribed with the Elute, Prime, Fragment Mix (Illumina). End repair, A-tailing, adaptor ligation, and library enrichment were performed as described in the Low Throughput protocol of the TruSeq RNA Sample Prep Guide (Illumina). RNA libraries were assessed for quality and quantity with the Agilent 2100 BioAnalyzer and the Quant-iT PicoGreen dsDNA Assay Kit (Life Technologies). RNA libraries were sequenced as 100 bp paired-end runs on an Illumina HiSeq2500 platform.
Processing of RNA sequencing files
RNA-seq reads were demultiplexed and mapped with STAR9 (version 2.4.2a) to the hg19 genome assembly (UCSC Genome Browser build). In addition to the default parameters we detected gene fusions and increased sensitivity for novel splice junctions (chimSegmentMin=20, twopassMode=“Basic”). Analysis was restricted to the 27,682 UCSC Known Genes10 (genome annotation version hg19) of chromosomes 1 to 22, M, X, or Y. Per gene, reads that are paired with mates from opposite strands and that overlapped completely within the gene on either strand orientation were counted using the summarizeOverlaps function of the R/Bioconductor GenomicAlignments11 package (parameters: mode=intersectionStrict, singleEnd=FALSE, ignore. strand=TRUE, fragments=FALSE). If the 95th percentile of the coverage across all samples was below 10 reads the gene was considered “not expressed” and discarded from later analysis.
Computing RNA fold changes and differential expression
Before testing for differential expression between one patient of interest and all others, we controlled for technical batch effect, sex, and biopsy site as inferred from the expression of hox genes (Supplementary information, Supplementary Table 3). We modeled the RNA-seq read counts Ki,j of gene i in sample j with a generalized linear model using the R/Bioconductor DESeq2 package12,13:

Where NB is the negative binomial distribution; αi is a gene specific dispersion parameter; Sj is the size factor of sample j;  is the intercept parameter for gene i. The value of
  is 1 for all RNA samples j of the patient of interest, thereby allowing for biological replicates, and 0 otherwise. The resulting vector
  represents the log2-fold changes for one patient against all others. Z-scores were computed by dividing the fold changes by the standard deviation of the normalized expression level of the respective gene. The P-values corresponding to the
  were corrected for multiple testing using the Hochberg family-wise error rate method14.
Splicing
The Leafcutter15 software was utilized to detect aberrant splicing. Each patient was tested against all others. To adjust Leafcutter to the rare disease setting, we modified the parameters to detect rare clusters, capture local gene fusion events and to detect junctions unique to a patient (minclureads=30; maxintronlen=500,000; mincluratio=1e-5, Supplementary Table 4). Furthermore, one sample was tested against all other samples (min_samples_per_group=1; min_samples_per_intron=1). The resulting P-values were corrected for multiple testing using a family-wise error rate approach14.
The significant splice events (adjusted P-value < 0.05) detected in the undiagnosed patients were visually classified as exon skipping, exon truncation, exon elongation, new exon, complex splicing (any other splicing event or a combination of the aforementioned ones) and false positives.
For further analysis, only reads spanning a splice junction, so called split reads, were extracted with a mapping quality of greater than 10 to reduce the false positive rate due to mapping issues. Each splice site was annotated as belonging to the start or end of a known exon or to be entirely new. For the reference exon annotation the GENCODE release 24 based on GRCh37 was used16. The percent spliced in (Ψ) values for the 3’ and 5’ sites were calculated as described earlier17:

Where D is a donor site and A is an acceptor site. n(D,A) denotes the number of reads spanning the given junction. D’ and A’ represent all possible donor and acceptor sites, respectively.
Classification of splice sites into background, weak and strong was done by modeling the distribution of the Ψ5 and Ψ3-values with three components. Identifiability of the three components was facilitated by considering three groups of junctions depending on previous annotation of splice sites: ‘no side is annotated’, ‘one side is annotated’ and ‘both sides are annotated’. Specifically, the number of split reads n(D,A) of a junction conditioned on the total number of reads  , for Ψ5, and
  , for Ψ3, was modeled as:
 where c is the component index, s the number of annotated sites and BetaBin the beta-binomial distribution. Hence, the components were modeled to have the same parameters αc, βc in all three groups but their mixing proportions πs,c to be group-specific. Fitting was performed using the expectation-maximization algorithm. For the initial step, the data points were classified as background (ψ < 0.001), weak spliced (ψ < 0.1) and canonical (ψ >=0.1). After convergence of the clustering the obtained parameters were used to estimate the probability for each junction side to belong to a given class.
Detection of Mono-allelic expression
For mono-allelic expression analysis only heterozygous single nucleotide variants with only one alternative allele detected from exome sequencing data were used. The same quality filters were used as mentioned in the exome sequencing part, but no frequency filter was applied. To get allele counts from RNA sequencing for the remaining variants the function pileLettersAt from the R/Bioconductor package GenomicAlignments11 was used. The data was further filtered for variants with coverage of at least 10 reads on the transcriptome.
The DESeq2 package12,13 was applied on the final variant set to estimate the significance of the allele-specific expression. Allele-specific expression was estimated on each heterozygous variant independently of others (i.e. without phasing the variants). For each sample, a generalized linear model was fitted with the contrast of the coverage of one allele against the coverage of the other alleles (condition). Specifically, we modeled j the number of reads of variant i in sample j as:

Where NB is the negative binomial distribution; the dispersion parameter α was fixed for all variants to α = 0.05, which is approximately the average dispersion over all samples based on the gene-wise analysis; sj is the size factor of each condition;  is the intercept parameter for variant i. The value of
  is 1 for the alternative alleles and 0 otherwise. The resulting
  represents the log2-fold changes for the alternative allele against the reference allele. The independent filtering by DESeq2 was disabled (independentFiltering=FALSE) to keep the coverage outliers among the results. To classify a variant as mono-allelically expressed a cutoff of
  was used. This corresponds to an allele frequency ≥ 0.8.
Mass spectrometric sample preparation
Mass spectrometric sample preparation was done as described earlier18. Briefly, cells were lysed in SDC lysis buffer (1% sodium deoxycholate, 10 mM TCEP, 40 mM CAA, 100 mM Tris pH 8.5), boiled for 10 min at 95°C, sonicated and diluted 1:1 with water for LysC and trypsin digestion. The dilution buffer contained appropriate amounts of proteolytic enzyme to ensure a ratio of 1:50 (μg enzyme / μg protein). Digestion was performed at 37°C overnight. Peptides were acidified, loaded on SDB-RPS (poly-styrenedivinylbenzene) material and eluted. Eluted peptides were collected in autosampler vials and dried using a SpeedVac centrifuge (Eppendorf, Concentrator plus, 5305 000.304). Peptides were resuspended in buffer A* (2% ACN, 0.1% TFA) and were sonicated (Branson Ultrasonics, Ultrasonic Cleaner Model 2510).
Mass spectrometric data acquisition
2 μg of peptides per sample were loaded for 100 min gradients separated on a 50 cm column with 75 μm inner diameter in-house packed with 1.9 μm C18 beads (Dr. Maisch GmbH). Reverse phase chromatography was performed at 50°C with an EASY-nLC 1000 ultra-high pressure system (Thermo Fisher Scientific) coupled to the Q Exactive HF19 mass spectrometer (Thermo Fisher Scientific) via a nanoelectrospray source (Thermo Fisher Scientific). Peptides were loaded in buffer A (0.1% volume/volume formic acid) and eluted with a nonlinear gradient. Operational parameters were real-time monitored by the SprayQC software20. Raw files were analysed by the software MaxQuant21 (version 1.5.3.2) and peak lists were searched against the Homo sapiens Uniprot FASTA database (Version 2014/4) and a common contaminants database (247 entries) by the Andromeda search engine22. Label-free quantification was done using the MaxLFQ algorithm23 (for detailed parameters see Supplementary Table 5) integrated into MaxQuant.
Processing of proteome intensities
The LFQ intensities and gene names were extracted for 6,566 protein groups from the MaxQuant output file proteinGroups.txt. For protein groups with more than one member, the first member was chosen to represent the group as single protein with a distinct gene name (similar to earlier studies24). MaxLFQ intensities of 0 actually represent non-quantified peaks and were therefore replaced with missing values (NA). The 10 samples that had a frequency of missing values higher than 50% were considered bad quality and discarded. Furthermore, proteins were discarded because they had no gene name assigned (n=198), were not the most abundant among their duplicates (n=295), were not expressed in any sample (n=93), because their 95th percentile was not detected (n=549), which was also considered as not expressed, analogously to RNA filtering. Finally, 5,431 proteins and 31 samples were considered for further analysis (Supplementary Table 6).
Computing protein fold changes and differential expression
Since the mass spectrometric measurements of all samples were done in a single run, no technical artifacts could be found with a hierarchical clustering. Protein differential expression for each patient compared to the others was tested using moderated T-test approach as implemented in the R/Bioconductor limma package25. The transcriptome covariates for sex and HOX effects were used in the linear model for normalization.
Metabolomics
Blood levels of metabolites of the proline pathway and urea cycle were determined as part of a non-targeted metabolomics experiment on 143 patients (including #80256) with mitochondrial diseases and 97 healthy controls. We used a metabolomics platform that has been established by Metabolon Inc. and is based mass spectrometry coupled to liquid (LC-MS/MS). Sample preparation, analytical protocols, identification of metabolites, and processing of the raw ion counts have been described in detail previously26–28.
Briefly, plasma samples, which were stored at −80°C prior to analysis, were thawed on ice. For metabolite extraction and protein precipitation, 475 μL methanol, containing four recovery standards to monitor the extraction efficiency, were added to 100 μL of the plasma. After centrifugation, the supernatant was split into 4 aliquots of 100 μL each onto two 96-well microplates. The first 2 aliquots were used for LC-MS/MS analysis in positive and negative electrospray ionization mode. Two further aliquots were kept as a reserve. The extracts were dried on a TurboVap 96 (Zymark, Sotax, Lörrach, Germany). Prior to LC-MS/MS in positive ion mode, the samples were reconstituted with 50 μl 0.1% formic acid. Whereas samples analyzed in negative ion mode were reconstituted with 50 μl 6.5 mM ammonium bicarbonate, pH 8.0. Reconstitution solvents for both ionization modes contained internal standards that allowed monitoring of instrument performance and also served as retention reference markers. To minimize human error, liquid handling was performed on a Hamilton Microlab STAR robot (Hamilton Bonaduz AG, Bonaduz, Switzerland).
LC-MS/MS analysis was performed on a linear ion trap LTQ XL mass spectrometer (Thermo Fisher Scientific GmbH, Dreieich, Germany) coupled with a Waters Acquity UPLC system (Waters GmbH, Eschborn, Germany). Two separate columns (2.1 x 100 mm Waters BEH C18, 1.7 μm particle-size) were used either for acidic (solvent A: 0.1% formic acid in water, solvent B: 0.1% formic acid in methanol) and or for basic (A: 6.5 mM ammonium bicarbonate, pH 8.0, B: 6.5 mM ammonium bicarbonate in 95% methanol) mobile phase conditions, optimized for positive and negative electrospray ionization, respectively. After injection of the sample extracts, the columns were developed in a gradient of 99.5% A to 98% B over an 11 min run time at 350 μL/min flow rate. The eluent flow was directly run through the ESI source of the LTQ XL mass spectrometer. The mass spectrometer analysis alternated between MS and data-dependent MS/MS scans using dynamic exclusion and the scan range was from 80-1000 m/z.
Metabolites were identified by Metabolon, Inc. from the LC-MS/MS data by automated multiparametric comparison with a proprietary library, containing retention times, m/z ratios, and related adduct fragment spectra.
To account for instrument inter-day differences, the raw ion counts detected for each metabolite were divided by their median per run-day. Furthermore, a log transformation of base 10 was applied as measured metabolite levels mostly follow a log-normal distribution.
Transduction and Transfection
Overexpression of TIMMDC1 in fibroblast cell lines was performed by lentivirus-mediated expression of the full-length TIMMDC1 cDNA (DNASU Plasmid Repository) using the ViraPower HiPerform Lentiviral TOPO Expression Kit (Thermo Fisher Scientific)29. TIMMDC1 cDNA was cloned into the pLenti6.3/V5-TOPO expression vector and cotransfected into 293FT cells with the packaging plasmid mix using Lipofectamine 2000. After 24 h, the transfection mix was replaced with high glucose DMEM supplemented with 10% FBS. After further 72 h, the viral particle containing supernatant was collected and used for transduction of the fibroblast cell lines. Selection of stably expressing cells was performed using 5 μg/mL Blasticidin (Thermo Fisher Scientific) for 2 weeks.
Immunoblotting
Total fibroblast cell lysates were subjected to whole protein quantification, separated on 412% precast gels (Lonza) by SDS-PAGE electrophoresis and semi-dry transferred to PVDF membranes (GE Healthcare Life Sciences). The membranes were blocked in 5% non-fat milk (Bio Rad) in TBS-T for 1 h and immunoblotted using primary antibodies against CLPP (Abcam, ab56455), MCOLN1 (Abcam, ab28508), NDUFA13 (Abcam, ab110240), NDUFB3 (Abcam, ab55526) NDUFB8 (Abcam, ab110242), TIMMDC1 (Abcam, ab171978), and UQCRC2 (Abcam, ab14745) for 1 h at RT or ON at 4°C. Signals were detected by incubation with HRP-conjugated goat anti-rabbit and goat anti-mouse secondary antibodies (Jackson Immuno Research Laboratories) for 1 h and visualization using ECL (GE Healthcare Life Sciences).
Blue native PAGE (BN-PAGE)
Fresh fibroblast cell pellets were resuspended in PBS supplemented with 0.25 mM PMSF and 10 U/mL DNAse I and solubilized using 2 mg digitonin/mg protein. The mixture was incubated on ice for 15 min followed by addition of 1 mL PBS and subsequent centrifugation for 10 min at 10000 g and 4°C. The pellet was resuspended in 1x MB (750 mM ε-aminocaproic acid, 50 mM bis-Tris, 0.5 mM EDTA, pH 7.0) and subjected to whole protein quantification. Membrane proteins were solubilized at a protein concentration of 2 μg/μL using 0.5% (v/v) n-dodecyl-β-d-maltoside (DDM) for 1 h on ice and centrifuge for 30 min at 10000 g at 4°C. The supernatant was recovered and whole protein amount was quantified. Serva Blue G (SBG) was added to a final concentration of 0.25% (v/v) and 60 μg protein were loaded on NativePAGE 416% Bis-Tris gels (Thermo Fisher Scientific). Anode buffer contained 50 mM Bis-Tris, pH 7.0, blue cathode buffer contained 15 mM Bis-Tris, 50 mM Tricine, pH 7.0, 0.02% SBG. Electrophoresis was started at 40 V for 30 min and continued at 130 V until the front line proceeded 2/3 of the gel. Subsequently, blue cathode buffer was replaced by clear cathode buffer not containing SBG (15 mM Bis-Tris, 50 mM Tricine, pH 7.0). Proteins were wet transferred to PVDF membranes and immunoblotted using primary antibodies against NDUFB8 to visualize complex I and UQCRC2 to visualize complex III.
Proline supplementation growth assay
We modified a method established earlier30. For the comparative growth assay, equal number of cells (n=250) from patient and control were seeded in 96-well plates and cultured in DMEM containing 10% of either normal or dialyzed FBS. Medium with normal FBS contains small molecules, whereas medium with dialyzed FBS is free of molecules with a molecular weight smaller than 10,000 mw (Proline-free medium). To confirm the effect of Proline deprivation, DMEM containing dialyzed FBS was supplemented with 100 μM L-Proline to rescue the growth defect. After paraformaldehyde fixation, nuclei were stained with 4’,6-diamidino-2-phenylindole (DAPI) and cell number was determined using a Cytation3 automated plate reader (BioTek, USA).
Cellular ROS production
Intensity of hydroethidine (HEt) oxidation products as a measure of cellular ROS production was quantified in living skin fibroblasts using epifluorescence microscopy as described previously31.
Author contributions
Project planning: T.M., J.G., H.P. Experimental design: H.P. Review of phenotypes, sample collection and biochemical analysis: C.L., B.F., A.D., V.T., A.L., D.G., R.T., D.G., J.A.M., A.R., P.F., F.D., and T.M. Investigation L.S.K., D.M.B., and C.M. Data curation and analysis: L.S.K., D.M.B., C.M., T.M.S., and H.P. Cell biology experiments: L.S.K., R.K., A.I., C.T., E.K., and B.R. Exome, genome, and RNA sequencing; L.S.K., R.K., E.G., T.S., P.L. and T.M.S. Exome analysis: L.S.K., R.K.,T.B.H., and H.P. Quantitative proteomics: L.S.K. and G.P. Metabolomic studies: L.S.K., G.K., A.A., and J.A. Manuscript writing: L.S.K., D.M.B., C.M., G.P., J.G., and H.P. Visualization L.S.K., D.M.B., and C.M. Critical revision of the manuscript: all authors.
Competing financial interests
The authors declare that they have no competing interests.
Materials & Correspondence
Correspondence and material requests should be addressed to:
Holger Prokisch (prokisch{at}helmholtz-muenchen.de) or Julien Gagneur (gagneur{at}in.tum.de).
Supplemental tables and codes are available online at http://i12g-gagneurweb.informatik.tu-muenchen.de/public/paper/mitoMultiOmics
Acknowledgements
We are grateful to the participating families. Further we thank Dr. Lina Florentin for providing DNA samples of the parents of #35791. This study was supported by the German Bundesministerium für Bildung und Forschung (BMBF) through the E-Rare project GENOMIT (01GM1603 and 01GM1207, HP and TM, FWF I 920-B13 for JAM, and J41J11000420001 for DG), through the Juniorverbund in der Systemmedizin “mitOmics” (FKZ 01ZX1405C, TBH, JG), and the DZHK (German Centre for Cardiovascular Research, LSK, TM). The study was furthermore supported by the Deutsche Forschungsgemeinschaft (German Research Foundation) within the framework of the Munich Cluster for Systems Neurology (EXC 1010 SyNergyDFG, TM) and a Fellowship through the Graduate School of Quantitative Biosciences Munich (QBM) supports DMB. HP, VT, and JAM are supported by EU FP7 Mitochondrial European Educational Training Project (317433). HP and JG are supported by EU Horizon2020 Collaborative Research Project SOUND (633974). RWT is supported by a Wellcome Trust Strategic Award (096919/Z/11/Z) and the MRC Centre for Neuromuscular Diseases (G0601943). DG is supported by Telethon-Italy (GGP15041). We thank the Pierfranco and Luisa Mariani Foundation and the Cell lines and DNA Bank of Paediatric Movement Disorders and Mitochondrial Diseases of the Telethon Genetic Biobank Network (GTB09003).


