

Abstract
Transcriptional regulatory changes have been shown to contribute to phenotypic differences between species, but many questions remain about how gene expression evolves. Here we report the first comparative study of nascent transcription in primates. We used PRO-seq to map actively transcribing RNA polymerases in resting and activated CD4+ T-cells in multiple human, chimpanzee, and rhesus macaque individuals, with rodents as outgroups. This approach allowed us to measure transcription separately from post-transcriptional processes. We observed general conservation in coding and non-coding transcription, punctuated by numerous differences between species, particularly at distal enhancers and non-coding RNAs. We found evidence that transcription factor binding sites are a primary determinant of transcriptional differences between species, that stabilizing selection maintains gene expression levels despite frequent changes at distal enhancers, and that adaptive substitutions have driven lineage-specific transcription. Finally, we found strong correlations between evolutionary rates and long-range chromatin interactions. These observations clarify the role of primary transcription in regulatory evolution.
Following decades of speculation that changes in the regulation of genes could be a potent force in the evolution of form and function1–3, investigators have now empirically demonstrated the evolutionary importance of gene regulation across the tree of life4–12. Changes in gene expression are primarily driven by mutations to non-coding DNA sequences, particularly those that bind sequence-specific transcription factors13. Accordingly, adaptive nucleotide substitutions at transcription factor binding sites (TFBSs)9,10,14–16 and gains and losses of TFBSs17–25 both appear to make major contributions to the evolution of gene expression. These events are believed to modify a variety of rate-limiting steps early in transcriptional activation26. In addition, transcriptional activity is generally correlated with various epigenomic and structural features, including post-translational modifications to core histones, the locations of architectural proteins such as CTCF, and the organization of topological associated domains. Like TFBSs, these features display general conservation across species, yet do exhibit some variation, with differences between species roughly proportional to evolutionary distance27. Moreover, differences between species in these features correlate with differences in gene expression8,24,28–30.
Nevertheless, many open questions remain about the roles of TFBSs, chromatin organization, and posttranscriptional regulation in the evolution of gene expression. For example, there is a surprisingly limited correlation between differences in binding events and differences in mRNA expression levels31–33. Possible reasons for this discordance include non-functional TF binding31,32,34, compensatory gains and losses of TFBSs20,35–38, difficulties associating distal enhancers with target genes39, and a dependency of TF function on chromatin or chromosomal organization40. In addition, some changes in mRNA expression appear to be “buffered” at the post-transcriptional level41–43. Finally, it remains unclear to what degree epigenomic differences between species are causes and to what degree they are effects of differences in gene expression.
One reason why it has been difficult to disentangle these contributions to gene expression is that expression is typically measured in terms of the abundance of mRNA, which is subject to post-transcriptional processing44 and therefore is an indirect measure of the transcription of genes by RNA polymerase II. An alternative and complementary approach is to measure the production of nascent RNAs using Precision Run-On and sequencing (PRO-seq) and related technologies45–50. These nascent RNA sequencing methods directly measure active transcription and are highly sensitive to immediate and transient transcriptional responses to stimuli51. In addition, they can detect active regulatory elements as well as target genes, because these elements themselves display distinctive patterns of transcription, which are highly underrepresented in RNA-seq data owing to their rapid degradation34,52,53. Indeed, the latest nascent RNA sequencing methods, such as PRO-seq46, in combination with new computational tools for regulatory element prediction54, serve as powerful single-assay systems for both identifying regulatory elements and measuring transcription levels.
With these advantages in mind, we undertook a genome-wide comparative analysis of transcription in primates using PRO-seq. Our comparison of PRO-seq data across species revealed overall conservation in the transcription of both coding and non-coding elements, but also uncovered numerous differences between species. Together, our observations provide new insights into the evolution of transcription in primates.
Patterns of transcription in resting and activated CD4+ T-cells
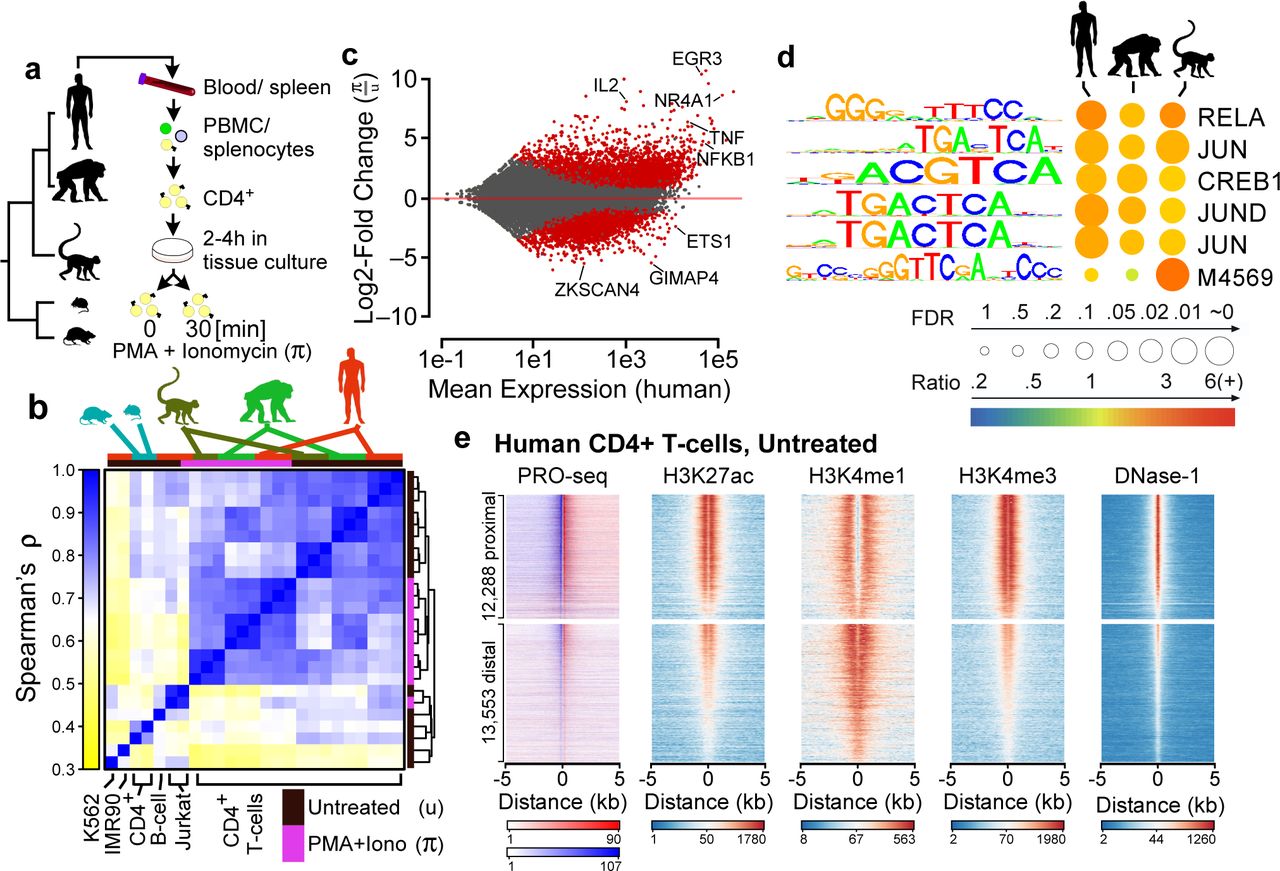
We developed nucleotide-resolution maps of RNA polymerase in CD4+ T-cells isolated from five mammalian species. Samples were collected under resting and activated conditions from three unrelated individuals representing each of three primate species—humans, chimpanzees, and rhesus macaques—spanning ∼25-30 million years of evolution (MYR) (Fig. 1a). To compare with studies that focus on longer evolutionary branch lengths, we also collected resting samples from a single individual in each of two rodent species—mouse and rat—which together serve as an outgroup to the primates (∼80 MYR divergence). We used flow cytometry to validate the purity of isolated CD4+ cells (Supplementary Fig. 1). In addition, we used measurements of transcriptional activity of T-cell subset markers for T-helper type 1 (Th1), Th2, Th17, T-regulatory, and T-follicular helper cells to demonstrate that the population of CD4+ T-cell subsets within the total CD4+ population was largely similar across species (Supplementary Fig. 2).

(a) CD4+ T-cells were isolated from the blood or spleen of individuals from five vertebrate species, including human, chimpanzee, rhesus macaque, mouse, and rat. (b) Hierarchical clustering of PRO-seq signal intensities in gene bodies groups CD4+ T-cell samples first by treatment condition and second by species. The color scale represents Spearman’s rank correlation between normalized transcription levels in active gene bodies. Colored boxes (top) represents the species and treatment condition of each sample. (c) MA plot shows the log2 fold-change following π treatment in human CD4+ T-cells (y-axis) as a function of the mean transcription level in GENCODE annotated genes (x-axis). Red points indicate statistically significant changes (p < 0.01). Several classical response genes that undergo well-documented changes in transcript abundance following CD4+ T-cell activation (e.g., IL2, IFNG, TNFα, and EGR3) are marked. (d) Enrichment of TF binding motifs in TREs that increase transcription levels following π treatment in the indicated species compared to TREs whose transcription abundance does not change. Table shows the Bonferroni corrected p-value, based on a Fisher’s exact test (circle size), and the fold-enrichment over a group of unchanged background sequences (color scale). Motif logos and the candidate transcription factor or Cis-BP motif ID are shown. (e) Heatmaps show the distribution of PRO-seq (red and blue indicate transcription on the plus and minus strand, respectively), ChIP-seq for H3K27ac, H3K4me1, and H3K4me3, and DNaseI-seq signal intensity. Plots are centered on transcriptional regulatory elements (TREs) predicted in untreated human CD4+ T-cells using dREG-HD (see Online Methods). All plots are ordered based on the maximum dREG score in the window.
PRO-seq46,49 libraries were sequenced to a combined depth of ∼1 billion uniquely mapped reads (∼78-274 million per species) (Supplementary Table 1). According to a principal component analysis, the first, second, and third sources of variation in the complete dataset were, respectively, the rodent vs. primate species, variation across the primate species, and the treatment condition (Supplementary Fig. 3). Similarly, hierarchical clustering of these data grouped the primate samples first by cell type or treatment condition and subsequently by species, with the rodent samples as outgroups that were more similar to untreated primate CD4+ T-cells than to other samples included in the comparison (Fig. 1b). The correlation between untreated samples decreased linearly with evolutionary time (Supplementary Fig. 4), consistent with reports that differences between species arise, on average, at a roughly constant evolutionary rate27,55.
To gain further insight into the evolution of the response to CD4+ T-cell stimulation, we compared transcriptional activity under resting and activated conditions within and between species. Here we focused on 42,556 GENCODE-annotated transcription units (TUs) best supported by PRO-seq data for human CD4+ T-cells56. In humans, we found that PMA and ionomycin (π) significantly altered the transcription levels of 6,940 (13%) of these TUs (p < 0.01, deSeq257; Fig. 1c). Parallel analyses in chimpanzee and rhesus macaque revealed many similarities in transcriptional changes following π treatment (Supplementary Fig. 5a-b). We identified a core set of 3,157 TUs that undergo evolutionarily conserved transcriptional changes in all three species following 30 min. of π-treatment, including many of the classical response genes (e.g., IFNG, TNFα, IL2, and IL2RA), as well as numerous novel genes and lincRNAs (Supplementary Fig. 5a-c). Active transcriptional regulatory elements (TREs) undergoing changes following π-treatment were enriched for a similar set of transcription factor binding motifs across species, including those for NF-kB and the AP-1 heterodimers FOS and JUN, which are known to be activated by canonical T-cell receptor signaling (Fig. 1d; Supplementary Note 1). Thus, the core regulatory principles responsible for T-cell signaling and activation appear to remain broadly conserved across primate evolution.
Rapid evolutionary changes in transcribed enhancers
We used dREG54 to identify 30,357 active TREs in human CD4+ T-cells, based on patterns of enhancer-templated RNA (eRNA) or upstream antisense (uaRNA) transcription evident from PRO-seq data (Online Methods). We classified these predicted TREs as either protein-coding promoters or candidate enhancers based on their proximity to gene annotations. The predicted TREs in each group were highly concordant with other marks of regulatory function in human CD4+ T-cells used previously to define groups of candidate enhancers, including acetylation of histone 3 lysine 27 (H3K27ac), mono- and trimethylation of histone 3 lysine 4 (H3K4me1 and H3K4me3), and DNase-I-seq signal58 (Fig. 1e). Notably, dREG identified >83% of DNase-I hypersensitive sites (DHS) marked by H3K27 acetylation in human CD4+ T-cells, consistent with prior work suggesting that transcription patterns alone can recover the majority of active enhancers defined by independent criteria34,52,54. Furthermore, we identified 88% and 91% of DHSs marked, respectively, by H3K9ac and H4K16ac, two other markers of regulatory function. Taken together, these data suggest that PRO-seq patterns reveal the locations of TREs with high sensitivity. In the analysis that follows, we will refer to these dREG-identified distal TREs as “enhancers” for simplicity.
Extending our dREG analysis to untreated CD4+ T-cells from additional species revealed 71,748 TREs that were active in untreated T-cells in at least one species (ranging between 27,581 and 39,387 TREs in each species). We defined two types of changes between species: (1) changes in the abundance of Pol II at TREs that were present across all species, and (2) complete gains or losses in at least one species (see Supplementary Note 2, Supplementary Fig. 6, and Online Methods). We found that 52% of enhancers showed evidence of changes in Pol II transcriptional activity in at least one of the three primate species and 81% showed changes at the longer evolutionary distance between primates and rodents (Fig. 2a), similar to recent observations in other systems10,24 (Supplementary Note 3). Enhancers were predicted to be completely gained or lost at nearly eight times the rate of promoters (35% of enhancers; 12% of promoters; p < 2.2e-16 by Fisher’s exact test), consistent with recent observations based on H3K27ac and H3K4me324. By contrast, TREs induced by π treatment were much more likely to be conserved, and showed similar conservation at promoters and enhancers (Fig. 2a).

(a) The fractions of TREs active in untreated CD4+ T-cells that are present in the human reference genome and are conserved across all species (blue), are not detectable and are therefore inferred as gains or losses (teal-white) or undergo significant changes (green) in at least one species, or fall in regions for which no ortholog occurs in at least one of the indicated genomes (pink). Inferred gains or losses are colored according to the FDR corrected p-value associated with changes in RNA polymerase abundance (deSeq2). Plots labeled “Primate” illustrate frequency of changes in a three-way comparison of human, chimpanzee, and rhesus macaque focusing on the untreated condition, whereas those labeled “Mammal” summarize a five-way comparison also including rat and mouse. π treatment denotes a comparison between human untreated and PMA+Ionomycin treated CD4+ T-cell samples. (b) Boxplots show the ChIP-seq signal near dREG sites classified as conserved, gains, losses, or complete losses for the indicated chromatin or DNA modification in units of reads per kilobase. The box represents the 25th and 75th percentile. Whiskers represent 1.5 times the interquartile range, and points outside of this range are not shown.
Next we tested whether evolutionary changes in transcriptional activity correlate with the enrichment of other marks of active enhancers. Predicted lineage-specific human enhancers were enriched for both active and repressive enhancer marks (Fig. 2b; Supplementary Fig. 7). Whereas apparent human gains were enriched for high levels of the active enhancer marker H3K27ac, sites with reduced transcriptional activity in humans showed much lower enrichments of H3K27ac. Furthermore, locations at which the dREG signal was completely lost in a human-specific fashion displayed levels of H3K27ac approaching those of randomly selected background sites (Fig. 2b). Intriguingly, many of the losses on the human branch retained H3K4me1, which marks both active and inactive enhancers59,60, and these losses displayed higher levels of chromatin marks associated with transcriptional repression than a random background (Fig. 2b), indicating that, at least in some cases, an active ancestral primate enhancer retains a ‘poised’ chromatin state in human, despite losing both transcriptional activity and H3K27ac. Thus, evolutionary changes in poised and active marks may commonly occur as distinct events.
Transcriptional changes correlate with DNA sequence differences
To investigate whether changes in TRE activity are accompanied by changes in DNA sequence, we compared phyloP sequence conservation scores61 at transcriptionally conserved TREs with phyloP scores at TREs that display evolutionary changes in transcription. Because signatures of sequence conservation in TREs are likely to be most pronounced in transcription factors binding sites (TFBS), we restricted our sequence conservation analyses to matches to 567 clusters of TF binding motifs selected based on their distinct DNA binding specificities (see Online Methods)62,63. We required that motif matches were present in dREG sites, and adopted a threshold at which nearly half of the motifs discovered were bona fide TFBSs, as measured by ChIP-seq (positive predictive value [PPV]= 0.47).
TFBSs found in transcriptionally conserved dREG sites showed a marked enrichment for higher phyloP scores relative to surrounding regions, indicating local sequence conservation (Fig. 3a). By contrast, TFBSs in lineage-specific dREG sites had substantially reduced enrichments in phyloP scores (Fig. 3a, cyan/blue). Notably, TFBSs in dREG sites lost on the human lineage showed enhanced conservation compared with those in human-specific gains. This observation is consistent with losses evolving under conservation in other mammalian species (which contribute to the phyloP scores) and gains emerging relatively recently. Each of these patterns was robust to corrections for potentially confounding differences in the distribution of sites, as well to choices of motif score thresholds (Supplementary Fig. 8a). Relaxing the motif score threshold to provide sensitivity for larger numbers of TFBSs at the expense of specificity, revealed patterns of conservation that correlate with the information content of positions within the DNA sequence motif (Supplementary Fig. 8b), further supporting TF binding as the functional property driving sequence conservation at these sites. Together, these analyses support the hypothesis that the sequences in TFBSs are a primary driver of transcriptional differences between species.

(a) Mean phyloP scores near TFBSs that are conserved (red), gained (blue), or lost (cyan) on the human branch. Motifs (score > 10) are at least 100 bp from the nearest annotated exon. (b) UCSC Genome Browser track shows transcription near SGPP2 and FARSB in untreated (U) and PMA+ionomycin (π) treated CD4+ T-cells isolated from the indicated primate species. PRO-seq tracks show transcription on the plus (red) and minus (blue) strands. Axes for the PRO-seq data are in units of reads per kilobase per million mapped (RPKM). Transcription units inferred from the PRO-seq data are shown above the plot. dREG tracks show the distribution of dREG signal. The Green et. al. (ref64) selective sweep scan track (top) represents the enrichment of derived alleles in modern human where Neanderthal has the ancestral allele. Points below the line represent a statistically significant number of derived alleles in modern human (line indicates a Z-score of -2). Net synteny tracks show the position of regions that have one-to-one orthologs in the chimpanzee and rhesus macaque genomes. (c) Luciferase signal driven by the SGPP2 promoter or the internal enhancer in MCF-7 cells using DNA from each primate species. Bars show the mean fold-induction following 3 hours of stimulation with TNFα. Error bars represent the standard error of the mean. Red ** denotes p < 1e-3 by a two-tailed t-test. (d) Transcription of SGPP2 using primers targeting intron 1 following 0 or 40 min. of TNFα treatment after silencing the indicated TRE using dCAS9-KRAB. Bars represent the median of three independent biological replicates of two gRNAs targeting the promoter, three targeting the internal enhancer, and four targeting the upstream enhancer. Error bars represent the standard error. Red * denotes p < 5e-2 and ** p < 5e-3 by a two-tailed t-test. (e) INSIGHT estimates of the fraction of nucleotides under selection (ρ), the expected density of segregating polymorphisms under weak negative selection (E[Pw]/kbp), or the expected density of human nucleotide substitutions driven by positive selection (E[Dp]/kbp) in human populations in the indicated class of sites. Red * denotes conditions significantly enriched over random background sequences (p < 0.01; two-tailed ?2-test).
We searched for examples of DNA sequence differences that might be responsible for transcriptional changes following π treatment, hypothesizing that they might be characterized more easily than sequences responsible for transcription in the untreated condition, because these transcriptional changes were likely driven by a limited number of master TFs64 (Fig. 1e). In one example, we found nucleotide substitutions in three apparent NF-kB binding sites in the proximal promoter and an internal enhancer of SGPP2 that correlate with differences in SGPP2 expression (Fig. 3b; Supplementary Fig. 9). Two of these putative binding sites were bound by NF-kB in human cell lines according to ChIP-seq data from ENCODE. Moreover, substitutions observed in human were found to disrupt the same position in the motif as NF-kB binding QTLs65 (see Online Methods), and showed a general trend toward higher NF-kB binding in the human alleles (Supplementary Fig. 9). To test the hypothesis that observed DNA sequence changes produced differential transcriptional activity, we cloned DNA from each primate species into a reporter vector driving luciferase activity in an MCF-7 cell model, which recapitulates the primary transcriptional features of the SGPP2 locus66 (Supplementary Fig. 9). Differences in basal luciferase activity were generally concordant with those observed between species (Supplementary Fig. 10). Moreover, both the proximal promoter of SGPP2 and the internal enhancer both activated luciferase expression more strongly following NF-kB activation when human DNA was cloned, but not with orthologous DNA from the other primates (Fig. 3c).
To determine whether these TREs affect the expression of SGPP2 in its native genomic context, we silenced each TRE by using CRISPRi, which targets a catalytically dead CAS9 fused to the Krüppel-associated box repressor (dCAS9-KRAB), to specifically tri-methylate lysine 9 of histone 3 (H3K9me3)67. Three independent single-guide RNAs (sgRNAs) targeting the internal enhancer and two designed for the proximal promoter reduced SGPP2 transcription to 50-60% of its resting level (p = 1.5e-3 and 2.6e-2, respectively, by a two-tailed t-test; Fig. 3d), consistent with these TREs directly contributing to SGPP2 expression in MCF-7 cells. Three sgRNAs targeting the upstream enhancer also had a significant effect on SGPP2 expression (p = 1.8e-4). Notably, the genome assemblies for chimpanzee and rhesus macaque harbor deletions of this upstream TRE that appear likely to affect its activity (Supplementary Fig. 9). However, although silencing individual enhancers reduced the transcription level of SGPP2 following NF-kB activation, silencing individual enhancers was insufficient to completely abolish induction of SGPP2 (Fig. 3d). Taken together, our findings show that at least two of the three TREs regulating SGPP2 drove expression patterns matching PRO-seq data in a reporter assay, but none completely explained SGPP2 activation in situ. These observations suggest that that multiple causal substitutions in NF-kB binding sites may work in concert to achieve human-specific activation of SGPP2.
In several cases, as with SGPP2, we observed numerous nucleotide substitutions within individual or clustered TFBSs. These clusters of substitutions are highly unlikely to occur by chance and suggest that positive selection may have driven adaptation of these binding sites. Indeed, SGPP2 falls in a region recently identified as having an excess of derived alleles in modern humans compared with the sequenced Neanderthal (Fig. 3d)68, potentially consistent with recent positive selection driving evolutionary changes in SGPP2 transcription. To more directly measure the impact of positive selection, we used INSIGHT69 to compare patterns of within-species polymorphism and between-species sequence divergence in TREs that had undergone human lineage-specific transcriptional changes. This analysis indicated that dREG sites are most strongly influenced by weak negative selection (Fig. 3f), based on an excess of low-frequency derived alleles in human populations, as has been reported previously for regulatory sequences9. Nevertheless, TREs with lineage-specific transcriptional changes in human CD4+ T-cells showed reduced weak negative selection and were strikingly enriched for adaptive nucleotide substitutions (p < 0.01 INSIGHT likelihood ratio test; Fig. 3f), consistent with positive selection at these sites. We estimate a total of at least 121 adaptive substitutions since the human/chimpanzee divergence within TFBSs that undergo transcriptional changes in human CD4+ T-cells. Despite limited power to detect the specific contributions of many individual TFs at our stringent motif match score threshold, we did note significant excesses of putatively adaptive substitutions in the predicted binding sites of several TFs, including motifs recognized by forkhead box family, POU-domain containing, and ELF/ETS family (Supplementary Fig. 11; p < 0.01, INSIGHT likelihood ratio test). These estimates highlight the substantial contribution of adaptive evolutionary changes in TFBSs that may influence the transcriptional activity of TREs.
Correlation between protein-coding and non-coding transcription
We noticed that evolutionary changes in protein-coding gene transcription frequently correlate with changes in non-coding transcription units (TU) located nearby. To examine this pattern more generally, we adapted our recently reported hidden Markov model (HMM)70 to estimate the location of TUs genome-wide, based on patterns of aligned PRO-seq reads and the location of TREs. Using this method, we annotated 54,793 TUs active in CD4+ T-cells of at least one of the primate species, approximately half of which overlap existing GENCODE annotations or their associated upstream antisense RNAs (Supplementary Fig. 12a). A cross-species comparison of the transcription levels for various TU classes (Fig. 4a) revealed that non-coding RNAs evolve in expression most rapidly and protein-coding genes evolve most slowly. GENCODE-annotated lincRNAs undergo evolutionary changes in expression about as frequently as the unannotated non-coding RNAs predicted by our HMM, which are likely enriched for bi-directionally unstable eRNA species. The broad similarity in evolutionary conservation between these two non-coding RNA classes may be consistent with observations that some lincRNAs function as enhancers for nearby protein-coding genes, and that stable accumulation of the transcript is dispensable for this biological function71.

(a) The fraction of each indicated class of RNAs that undergo changes in transcription in human CD4+ T-cells (see Online Methods). The relationships among the indicated classes of transcription units are depicted at top. (b) Scatterplot shows the magnitude of changes in transcription predicted for protein-coding genes using changes in the transcription of nearby non-coding RNAs (y-axis) as a function of changes observed (x-axis). The line has a slope of 1 and an intercept of 0.
We next measured the extent to which non-coding and protein-coding transcriptional activities are correlated through evolutionary time. We found that evolutionary changes in protein-coding gene expression among any of the primate species were highly correlated with those at both upstream (Pearson’s R = 0.85, p < 2.2e-16) and internal ( R = 0.66, p < 2.2e-16) antisense transcripts of the same genes. Moreover, changes in the transcriptional activity of gene promoters correlate with changes in the activity of matched distal enhancers defined by various criteria: namely, enhancers to which the promoters loop according to cell-type matched ChIA-PET data ( R = 0.45-0.61, p < 2.2e-16; depending on analysis assumptions)72, enhancers located nearby the promoters (R = 0.69, p < 2.2e-16), or enhancers that share the same topological associated domain as the promoter ( R = 0.62, p < 2.2e-16)73. Using a generalized linear model to integrate expression changes in multiple types of TUs, we can explain 74% of the variance in gene transcription levels when we observe differences between species ( R2 = 0.74 in a held-out set of sites, p < 2.2e-16; Fig. 4b) based on the activities of looped TREs, nearby TREs in the same topological associated domain, internal antisense TUs, and the upstream antisense TU. Thus evolutionary changes that result in differences in Pol II recruitment to protein-coding genes are well correlated across all interacting TREs, indicating a shared evolutionary pressure at proximal and distal TREs.
Rates of Enhancer Evolution Vary with Evidence for Gene Interactions
Despite this overall positive correlation, transcription at enhancers evolves rapidly and is frequently unaccompanied by transcriptional changes at nearby protein-coding genes. For example, CCR7 transcription is highly conserved among both primate and rodent species (Fig. 5a; Supplementary Fig. 2) in spite of several apparent changes in enhancer activity within the same locus (gray vertical bars). These findings are consistent with recent observations that changes in enhancers within densely populated loci often do not have appreciable effects on the transcription of genes within the locus36,37.

(a) UCSC Genome Browser tracks show transcription, dREG signal, and ChIA-PET loop interactions near the CCR7 superenhancer in the human genome. PRO-seq tracks show transcription on the plus (red) and minus (blue) strands in units of RPKM. Net synteny tracks show regions of one-toone orthology with the chimpanzee and rhesus macaque genomes. (b) Scatterplot shows the percentage of TREs conserved among all three primate species (y-axis) as a function of distance, either upstream or downstream, from the nearest annotated protein-coding transcription start site (x-axis). The size of each point represents the amount of data in the corresponding distance bin. The percentage of all dREG sites that are conserved in each indicated class of TRE. TREs are separated into three bins based on the distance relative to the nearest transcription start site. Error bars reflect a 1,000-sample bootstrap.
To explain this effect, we searched for genomic features correlated with conservation of transcription at enhancers, focusing on untreated CD4+ T-cells in order to leverage the large amount of public data available for this cell type. Not surprisingly, one of the features most strongly correlated with transcriptional conservation at enhancers is the distance from the nearest transcription start site of a protein-coding gene (Fig. 5b). In particular, more than half of enhancers located within 10 kbp of an annotated TSS are shared across all three primate species, whereas for distal enhancers located between 100 kbp to 1 Mbp from a TSS that fraction drops to roughly a third. This relationship is driven by lineage-specific gains or losses of enhancer activity, and to a lesser extent by changes in TRE activity levels, rather than by differences in the alignability of orthologous DNA (Supplementary Fig. 13).
These simple distance-based observations, however, ignore the critical issue of chromatin interactions between enhancers and promoters. To account for such loop interactions, we extracted 6,520 putative TRE interactions from Chromatin Interaction Analysis with Paired End Tag sequencing (ChIA-PET) data recognizing loops marked with H3K4me2 in human CD4+ T-cells72. We found that 55% of enhancers that participate in these loops were conserved between primate species compared to only 47% of non-looped enhancers (Fig. 5c; p = 5.6e-4, Fisher’s exact test). Moreover, higher transcriptional conservation at looped enhancers does not depend on the distance to the transcription start site. Parallel analysis of promoter-capture Hi-C data74 revealed that the strength of chromatin interaction was correlated with evolutionary conservation of distal TREs, corroborating the result obtained using ChIA-PET (p < 1e-3, bootstrap test). We observed similar levels of conservation at recently defined super-enhancers75, although this conservation may simply reflect an enrichment for loop interactions (48% of TREs in super-enhancers loop according to ChIA-PET, compared to 15% of all TREs). Looped enhancers were also enriched for elevated phyloP scores relative to either non-looped enhancers or randomly selected DNA sequences ( Supplementary Fig. 14; phyloP > 0.75; p < 2.2e-16, Wilcoxon Rank Sum Test). That the enhancers participating in loop interactions are more highly conserved at both the transcription and DNA-sequence levels indicates that these enhancers have a disproportionately large effect on fitness, presumably owing to a more direct role in transcriptional regulation.
Enhancer-Promoter Interactions Contribute to Constraint on Gene Transcription Levels
Distal loop interactions do not fully account for the disparity between enhancers and promoters in evolutionary rates—even looped enhancers still evolve significantly faster than promoters (p = 3e-3, Fisher’s exact test). We hypothesized that redundancy in enhancers may help to explain rapid enhancer evolution. More specifically, we asked whether redundancy makes protein-coding genes regulated by multiple distal TREs, such as CCR7 (Fig. 5a), more robust to enhancer turnover than those influenced by fewer distal TREs. Indeed, we found that evolutionary conservation of promoter TRE transcription is remarkably strongly correlated with the number of loop interactions a promoter has with distal sites (Fig. 6a, weighted Pearson’s correlation = 0.87; p < 1e-3 by a bootstrap test). A similar trend was observed between the number of loop interactions made by a target promoter and DNA sequence conservation in transcription factor binding motifs at the promoter, although the effect was weaker and did not meet our criteria for statistical significance (Fig. 6b, weighted Pearson’s correlation = 0.65; p = 0.07 by a bootstrap test).

(a-b) Scatterplot shows promoter conservation (a) or DNA sequence conservation (b) as a function of the number of loop interactions made by that site to distal sites across the genome (x-axis). (c-d) TRE conservation (c) or DNA sequence conservation (d) as a function of the number of loop interactions made by the sequence at the distal end of the loop interaction (x-axis). In all panels the size of each point is proportional to the number of examples in the corresponding bin, following the scale shown in the center.
But how does redundancy in distal TREs relate to the evolutionary conservation of the distal TREs themselves? If redundant distal TREs compensate for one another in some way, perhaps each one will be less, rather than more, conserved when their associated promoters have larger numbers of loop interactions. To address this question, we examined the rate of conservation of looped distal TREs as a function of the number of loops in which their gene-proximal partners participated. We found that DNA sequence conservation in putative TFBSs negatively correlates with the number of loops at the proximal end (Fig. 6d; weighted Pearson’s correlation = –0.80; p = 2e-3 by a bootstrap test). We noted a similar trend toward a negative correlation between the conservation of distal TRE transcription and the number of loop interactions (weighted Pearson’s correlation = –0.67; p = 0.059, two-sided bootstrap test, Fig. 6c). These results suggest that each associated distal TFBS is individually less essential at genes having larger numbers of loop interactions with distal sites, and they are therefore consistent with a model in which such TFBSs are more freely gained and lost during evolution. Taken together, our results imply that distance, looping, and redundancy of enhancers all contribute to constraints on the evolutionary rates of changes in gene transcription.
Discussion
We have carried out the first comparative analysis of primary transcription in any phylogenetic group, focusing on CD4+ T-cells in primates. Using PRO-seq and various computational tools, we estimated the locations and abundance of transcription units with high resolution and accuracy. In comparison to previous studies in primates29,33,76–78, this approach separated primary transcription from post-transcriptional processing, allowing us to study eRNAs, lincRNAs, and other rapidly degraded non-coding RNAs, as well as protein-coding genes. We found clear relationships between the DNA sequences of TFBSs and differential transcription across species and treatment conditions. We also found evidence that some transcriptional changes in humans were driven by adaptive evolution in nearby binding sites. Overall, our study provides new insights into the mode and tempo of recent evolutionary changes in transcription in primates.
Perhaps our most striking observation is that many non-coding transcription units, particularly eRNAs and lincRNAs, have undergone rapid evolutionary changes in comparison to protein-coding genes. Similar observations have been reported previously for lincRNAs79, but, to our knowledge, the observation for eRNAs is new, and it raises a number of questions. First, why are some enhancers more conserved than others? In particular, we find that enhancers proximal to, or that loop to, annotated promoters tend to be most constrained (Fig 5b-c). These enhancers may simply be most crucial for activating their target genes, but other factors may also contribute to their constraint. For example, perhaps these enhancers are enriched for tissue-specific functions, and are less constrained due to reduced pleiotropy80. Or perhaps many of them simply are not functional at all, and are transcribed as a by-product of other processes.
Second, how do protein-coding genes maintain stable transcription levels across species despite the rapid turnover of associated enhancers? One possibility is that many rapidly evolving enhancers are either not functional or act on targets other than the ones we have identified. However, several of our findings argue against this possibility; for example, we find that even looped enhancers, for which we have direct evidence of a promoter interaction, evolve significantly faster than promoters, and that eRNA conservation is strongly correlated with the number of loop interactions at associated promoters (Fig. 6). An alternative explanation, which appears more plausible to us, is that stabilizing selection on transcription levels drives enhancers to compensate for one another as they undergo evolutionary flux. This explanation would be compatible with reports from model systems36,38. Our finding that sequence conservation at distal enhancers is negatively correlated with the number of loop interactions at associated promoters (Supplementary Fig. 14) is also consistent with this explanation. The possibility of pervasive stabilizing selection on transcription levels in primates has been noted previously based on RNA-seq data81, but our data allow for more direct observations of both active transcription and associated regulatory elements.
A third question is, if most transcribed enhancers do indeed influence gene expression, then why are so many of them weakly maintained by natural selection? At present, we can only speculate on the answer to this question. One possibility is that some of the apparent turnover events we have observed actually represent enhancers that have simply switched cell types in activity, as has been reported in some cases19. But it is also possible that selection tends to act diffusely on enhancers across an entire locus, rather than strongly on individual enhancers, as has been proposed in cancer evolution82. Our observation that multiple DNA sequence changes at the SGPP2 locus appear functional provides some initial support this this hypothesis. It will be possible to evaluate these hypotheses more rigorously as better data describing enhancers and enhancer-promoter interactions across many cell types become available for these and other groups of species.
Methods
Multiple species PRO-seq library generation
Isolation of primate CD4+ T-cells
All human and animal experiments were done in compliance with Cornell University IRB and IACUC guidelines. We obtained peripheral blood samples (60-80 mL) from healthy adult male humans, chimpanzees, and rhesus macaques. Informed consent was obtained from all human subjects. To account for within-species variation in gene transcription we used three individuals to represent each primate species. Blood was collected into purple top EDTA tubes. Human samples were maintained overnight at 4C to mimic shipping non-human primate blood samples. Blood was mixed 50:50 with phosphate buffered saline (PBS). Peripheral blood mononuclear cells (PBMCs) were isolated by centrifugation (750x g) of 35 mL of blood:PBS over 15 mL Ficoll-Paque for 30 minutes at 20C. Cells were washed three times in ice cold PBS. CD4+ T-cells were isolated using CD4 microbeads (Miltenyi Biotech, 130-045-101 [human and chimp], 130-091-102 [rhesus macaque]). Up to 108 PBMCs were resuspended in binding buffer (PBS with 0.5% BSA and 2mM EDTA). Cells were bound to CD4 microbeads (20uL of microbeads/107 cells) for 15 minutes at 4C in the dark. Cells were washed with 1-2 mL of PBS/BSA solution, resuspended in 500uL of binding buffer, and passed over a MACS LS column (Miltenyi Biotech, 130-042-401) on a neodymium magnet. The MACS LS column was washed three times with 2mL PBS/BSA solution, before being eluted off the neodymium magnet. Cells were counted in a hemocytometer.
Isolation of CD4+ T-cells from mouse and rat
Spleen samples were collected from one male mouse (FVB) and one male rat (Albino Oxford) that had been sacrificed for IACUC-approved research not related to the present study. Dissected spleen was mashed through a cell strainer using a sterile glass pestle and suspended in 20 mL RPMI-1640. Cells were pelleted at 800xg for 3 minutes and resuspended in 1-5mL of ACK lysis buffer for 10 minutes at room temperature to lyse red blood cells. RPMI-1640 was added to a final volume 10 times that used for ACK lysis (10-40 mL). Cells were pelleted at 800xg for 3 minutes, counted in a hemocytometer, and resuspended in RPMI-1640 to a final concentration of 250,000 cells per ml. CD4+ T-cells were isolated from splenocytes using products specific for mouse and rat (Miltenyi Biotech, 130-104-453 [mouse], 130-090-319 [rat]) following instructions from Miltenyi Biotech, and as described above.
T-cell treatment and PRO-seq library generation
CD4+ T-cells were allowed to equilibrate in RPMI-1640 supplemented with 10% FBS for 2-4 hours before starting experiments. Primate CD4+ T-cells were stimulated with 25ng/mL PMA and 1mM Ionomycin (P/I or π) or vehicle control (2.5uL EtOH and 1.66uL DMSO in 10mL of culture media). We selected the minimum concentrations which saturate the production of IL2 and IFNG mRNA after 3 hours of treatment (data not shown). A 30 min. treatment duration was selected after observing a sharp increase in ChIP-qPCR signal for RNA Pol II phosphorylated at serine 5 on the C-terminal domain on the IFNG promoter at 30 min. (data not shown). To isolate nuclei, we resuspended cells in 1 mL lysis buffer (10 mM Tris-Cl, pH 8, 300 mM sucrose, 10 mM NaCl, 2 mM MgAc2, 3 mM CaCl2 and 0.1% NP-40). Nuclei were washed in 10 mL of wash buffer (10 mM Tris-Cl, pH 8, 300 mM sucrose, 10 mM NaCl and 2 mM MgAc2) to dilute free NTPs. Nuclei were washed in 1 mL, and subsequently resuspended in 50 μL, of storage buffer (50 mL Tris-Cl, pH 8.3, 40% glycerol, 5 mM MgCl2 and 0.1 mM EDTA), snap frozen in liquid nitrogen and kept for up to 6 months before making PRO-seq libraries. PRO-seq libraries were created exactly as described previously46. In most cases, we completed library preps with one member of each species (usually one human, chimpanzee, and rhesus macaque) to prevent batch effects from confounding differences between species. Samples were sequenced on an Illumina Hi-Seq 2000 or NextSeq500 at the Cornell University Biotechnology Resource Center.
Mapping PRO-seq reads
We mapped PRO-seq reads using standard informatics tools. Our PRO-seq mapping pipeline begins by removing reads that fail Illumina quality filters and trimming adapters using cutadapt with a 10% error rate83. Reads were mapped with BWA84 to the appropriate reference genome (either hg19, panTro4, rheMac3, mm10, or rn6) and a single copy of the Pol I ribosomal RNA transcription unit (GenBank ID# U13369.1). Mapped reads were converted to bigWig format for analysis using BedTools85 and the bedGraphToBigWig program in the Kent Source software package86. The location of the RNA polymerase active site was represented by the single base, the 3’ end of the nascent RNA, which is the position on the 5’ end of each sequenced read. After mapping reads to the reference genome, three samples (one human, U and PI, one chimpanzee, U and PI, and one rhesus macaque, U and PI) were identified as having poor data quality on the basis of the number of uniquely mapped reads, and were excluded from downstream analysis.
Mapping 1:1 orthologs between different species
During all comparative analyses, the genomic coordinates of mapped reads, dREG scores, and other parameters of interest were converted to the human assembly (hg19) using CrossMap87. We converted genomic coordinates between genome assemblies using reciprocal-best (rbest) nets88. Reciprocal-best nets have the advantage that comparisons between species are constrained to 1:1 orthologues. This constraint on mapping is enforced by requiring each position to map uniquely in a reciprocal alignment between the human reference and the other species in the comparison. We downloaded rbest nets for hg19-mm10, hg19-panTro4, hg19-rn6 from the UCSC Genome Browser. We created rbest nets for hg19-rheMac3 using the doRecipBets.pl script provided as part of the Kent Source software package.
Analysis of transcriptional regulatory elements
Defining a consensus set of transcriptional regulatory elements
We predicted TREs using dREG54 separately in each species’ reference genome. dREG uses a support vector regression model to score each site covered in a PRO-seq dataset based on its resemblance to features associated with transcription start sites in a reference training dataset. The dREG model was trained to recognize DNase-I-hypersensitive sites that also show substantial evidence of GRO-cap data in six PRO-seq or GRO-seq datasets measuring transcription in resting K562 cells. dREG scores were computed in the reference genome of each species in order to provide as much information as possible on the native context of each locus. In all cases, we combined the reads from all individuals for each species in order to maximize power for the discovery of TREs. In the primate species, treated and untreated CD4+ T-cells were analyzed separately.
We then defined a consensus set of TRE annotations, each of which bore the signature of an active TRE in at least one species and treatment condition. To define such a set, dREG scores were first converted to human reference genome (hg19) coordinates using CrossMap and the reciprocal-best nets. The advantage of converting dREG scores between the reference genome is that individual bases transfer more completely than genomic intervals using CrossMap and related tools. We then identified TREs in each species separately by thresholding the dREG scores. In all analyses, we selected a threshold of 0.3, which corresponds to a predicted false discovery rate of <7% compared with other sources of genomic data in human CD4+ T-cells. In addition, parallel analyses at separate thresholds (0.25 and 0.35) provided results that were in all cases consistent with those reported in the main manuscript (Supplementary Table 2). The set of overlapping TREs from each species were reduced to a single element containing the union of all positions covered by the set using bedops, and sites within 500 bp of each other were further merged. We assigned each putative TRE the maximum dREG score for each species and for each treatment condition.
Identifying differences in TREs between species
Differences in TRE transcription in 3-way (human-chimp-rhesus macaque) or 5-way (human-chimp-rhesus macaque-mouse-rat) species comparisons were identified using a combination of heuristics and statistical tests. Starting with the consensus set of TREs in hg19 coordinates, we first excluded potential one-to-many orthologs, by eliminating TREs that overlapped gaps in the reciprocal-best nets that were not classified as gaps in the standard nets. The remaining TREs were classified as unmappable when no orthologous position was defined in the rbest nets. Complete gains and losses were defined as TREs that were mappable in all species and for which the dREG score was less than 0.05 in at least one species and greater than 0.30 in at least one other species (see Supplementary Note 1). Gains and losses were assigned to a lineage based on an assumption of maximum parsimony under the known species phylogeny. We defined a set of TREs that displayed high-confidence changes in activity by comparing differences in PRO-seq read counts between species using deSeq2 and thresholding at a 1% false discovery rate (as described below). Changes in TRE activities were compared to histone modification ChIP-seq, DNase-I-seq, and DNA methyl immunoprecipitation data from the Epigenome Roadmap project58.
TRE classification
For some analyses, TREs were classified as likely promoters or enhancers on the basis of their distance from known protein-coding gene annotations (GENCODE v.19). TRE classes of primary interest include (see also Supplementary Fig. 7): (1) Promoters: near an annotated transcription start site (<100 bp); (2) Enhancers: distal to an annotated transcription start site (>5,000 bp)
Covariates that correlate with TRE changes
We compared the frequency at which evolutionary changes in transcription occur at TREs in a variety of different genomic contexts. We examined the rate of change as a function of distance from the nearest annotated transcription start site in GenCode v.19. TREs were binned by distance in increments of 0.02 on a log10 scale and we evaluated the mean rate at which evolutionary changes in TRE transcription arise in each bin. We also compared the rate of changes in TRE transcription across a variety of functional associations, including loop interactions, within the same topological associated domain, and in super-enhancers. H3K4me2 ChIA-PET data describing loop interactions were downloaded from the Gene Expression Omnibus (GEO) database (GSE32677) and the genomic locations of loops were converted from hg18 to hg19 coordinates using the liftOver tool. We also analyzed a separate dataset profiling loop interactions based on promoter capture Hi-C data in human CD4+ T-cells taken from the supplementary materials of ref. 74. Topological associated domains (TADs) based on Hi-C data for GM12878 cells were also downloaded from GEO (GSE63525). Super-enhancers in CD4+ T-cells were taken from the supplementary data for ref. 75. In all cases we excluded sites with potential one-to-many orthology in any of the species included in the comparison (typically just the three primates). Potential one-to-many orthologs were defined based on differences in the standard and reciprocal-best nets for each species pair.
Refining the location of active TREs using dREG-HD
During analyses of transcription factor binding motifs we further refined the location of TREs to the region between divergent paused RNA polymerase using a strategy that we call dREG-HD (manuscript in preparation, preliminary version available at https://github.com/Danko-Lab/dREG.HD). Briefly, we used an epsilon-support vector regression (SVR) with a Gaussian kernel to map the distribution of PRO-seq reads to smoothed DNase-I signal intensities. Training was conducted on randomly chosen positions within dREG peaks extended by 200bp on either side. Selection of feature vectors was optimized based on Pearson correlation coefficients between the imputed and experimental DNase-I score over the validation set. PRO-seq data was normalized by sequencing depth and further scaled such that the maximum value of any prediction dataset is within 90 percentile of the training examples. We chose a step size to be 60bp and extending 30 steps on each direction. The final model was trained using matched DNase-I and PRO-seq data in K562 cells.
Next we identified peaks in the imputed DNase-I hypersensitivity profile by fitting the imputed DNase-I signal using a cubic spline and identifying local maxima. We optimized two free parameters that control the (1) smoothness of spline curve fitting, and (2) threshold on the imputed DNase-I signal intensity. Parameters were optimized to achieve an appropriate trade-off between FDR and sensitivity on the testing K562 dataset. Parameters were tuned using a grid optimization over free parameters.
DNA sequence analysis
Finding candidate transcription factor binding motifs
All motif analyses focused on 1,964 human TF binding motifs from the CisBP database62 clustered using an affinity propagation algorithm into 567 maximally distinct DNA binding specificities (see ref 63). Scores, which reflect a loge-odds ratio comparing each candidate motif model to a third-order Markov background model, were calculated using the RTFBSDB package63. We selected two separate motif thresholds for different analyses. Scores >10 were used in analyses which mix multiple TF binding motifs, and strike a tradeoff that focuses on minimizing false positives at the expense of sensitivity. We dropped the cutoff score to motifs >8 in analyses that use individual motifs in order to increase statistical power. For each of these thresholds, we estimated the mean genome-wide positive predictive values to be 0.47 and 0.38, respectively, for motif cutoffs of 10 and 8, by comparing motifs to ChIP-seq peak calls in K562 cells. During comparative analyses we scanned each primate reference genome separately with each motif to allow the detection of a putative binding site in any of the species included in the analysis, and then moved scores to a human (hg19) reference genome using the CrossMap tool. We chose this strategy because changes in TRE activity may reflect changes in binding in any of the primate species. For example, human gains may be explained by either a new binding site for a transcriptional activator in the human genome, or a loss in binding of a transcriptional repressor that was bound in both primate species.
Motif enrichment in TREs that change during CD4+ T-cell activation
Motifs enriched in up- or down-regulated dREG-HD TREs during CD4+ T-cell activation (p < 0.01) were selected using Fisher’s exact test with a Bonferroni correction for multiple hypothesis testing. Up- or down-regulated TREs were compared to a background set of >2,500 GC-content matched TREs that do not change transcription levels following π treatment (log-2 fold change <0.5-fold in magnitude and p > 0.25) using the enrichmentTest function in RTFBSDB63. To test for motif robustness, the background resampling was repeated 100 times and motifs were selected that achieve a significant result in >90%.
DNA sequence conservation analysis
For our evolutionary conservation analysis, we used phyloP scores61 based on the 100-way genome alignments available in the UCSC Genome Browser (hg19). In all cases, bigWig files were obtained from the UCSC Genome Browser and processed using the bigWig package in R. We represented evolutionary conservation as the mean phyloP score in each identified TFBS in the indicated set of dREG-HD sites.
Enrichment of DNA sequence changes in motifs
We identified single-nucleotide DNA sequence differences at sites at which two of three primate species share one base and the third species diverges. We intersected these species-specific divergences with matches to transcription factor binding motifs found within dREG-HD sites that undergo transcriptional changes between primate species. Because many motifs in Cis-BP are similar to one another, we first partitioned the motifs using clustering (as described above), and examined enrichments at the level of these clusters. Motifs were ranked by the Fisher’s exact test p-value of the enrichment of species divergences in dREG-HD sites that change transcription status (where changes in DNA sequence and transcription occur on the same branch) to dREG-HD sites that do not change. We also compute the enrichment ratio, which we define as the number of species divergences in each TF binding motif in dREG-HD sites that change on the same branch normalized to the same statistic in sites that do not change.
INSIGHT analysis
We examined the modes by which DNA sequences evolve in human lineage-specific dREG-HD sites or DHSs using INSIGHT69. We passed INSIGHT either complete DHSs, dREG-HD sites, or TFBS within dREG-HD sites that undergo the changes (see Identifying differences in TREs between species) indicated in the comparison. Human gains and losses, for example, were comprised of 4,384 dREG-HD sites with 9,924 separate regions (median length of 16 bp) after merging overlapping TFBSs with a log-odds score greater than 10. We also analyzed 24 transcription factors each of which has more than 900 occurrences in dREG-HD sites that change on the human branch (log-odds score >8). All analyses were conducted using the INSIGHT web server (http://compgen.cshl.edu/INSIGHT/) with the default settings enabled.
bQTL analysis
Frequency shift estimates for all variants in Teranchi et al. (2016) were provided by the Frasier lab and converted to a queryable database filtered to include only variants with coverage by 25 reads (75th percentile) or more to avoid noise at low read counts. For each sequence/variant query, a set of four equivalent sequences/alternate allele pairs was constructed by swapping which allele was the reference and getting the reverse complement for both alleles. For example, given a sequence:variant:position combination of AATCGAA:C:3, the other queries produced were AACCGAA:T:3 (allele swap), TTCGATT:G:5 (reverse complement), and TTCGGTT:A:5 (reverse complement allele swap). Frequency shifts were computed by taking the post-ChIP frequency minus the pre-ChIP frequency for the human reference allele. Since k-mers longer than 7 had few hits, we allowed for wildcards (N) in longer sequences that would match any base. Wildcards were introduced into a k-mer by matching the k-mer sequence to the NF-kB motif and replacing the 3 lowest information content positions with N(s). Systematic shifts from 0 were tested using a one-tailed t-test. P-values for systematic differences at multiple sites were combined using Fisher’s method.
De novo discovery of transcription units
Identification of transcription units (TU) using a three-state hidden Markov model
We inferred transcription units (TU) using a three-state hidden Markov model (HMM) similar to those we have recently published51,70. Each TU begins at a TRE identified using dREG and continues through the entire region inferred to be transcribed, which can covers tens- to hundreds- of kilobases. Three states were used to represent background (i.e., outside of a transcription unit), the TU body, and a post-polyA decay region. The HMM transition structure is shown in Supplementary Fig. 13a. We allow skipping over the post-polyA state, as unstable transcripts do not have these two-phase profiles. We took advantage of dREG as a potential signal for transcription initiation by incorporating the dREG score (maximum value in the interval from a given positive read-count position until the next, clamped to the zero-one interval) as a transition probability from the background to the transcription body state. PRO-seq data is generally sparse, so we applied a transformation that encoded only non-zero positions and the distance between such consecutive positions (Supplementary Fig. 13a). Our model described this transformed data using emissions distributions based on two types of variables. The first type of emission variable defines the PRO-seq read counts in non-zero positions. These counts were modeled using Poisson distributions in the background and post-polyA states, and using a Negative Binomial distribution in the transcription body state. The negative binomial distribution can be seen as a mixture of Poisson distributions with gamma-distributed rates and therefore allows for variation in TU expression levels across the genome. The second type of emission variable describes the distribution of distances in base pairs between positions having non-zero read counts. This distribution was modeled using a separate geometric distribution for each of the three states. Maximum likelihood estimates of all free parameters were obtained via Expectation Maximization, on a per-chromosome basis. TU predictions were then obtained using the Viterbi algorithm with parameters fixed at their maximum-likelihood values. Finally these predictions were mapped from the transformed coordinates back to genomic coordinates. Source code for our implementation is publicly available on GitHub: https://github.com/andrelmartins/tunits.nhp.
Inferring TU boundaries in the common great ape ancestor
We identified the most likely TU locations in the great ape ancestor by maximum parsimony. TUs were identified and compared in human reference coordinates (hg19) for all species. We used the bedops package to find the intersection between the predicted TU intervals in each pair of species (i.e., human-chimp, humanrhesus macaque, and chimp-rhesus macaque). Intersections (>= 1bp) between pairs of species were merged, resulting in a collection of TUs shared by any two pairs of species, and therefore likely to be a TU in the human-chimp ancestor. All steps were applied independently on the plus and minus strands. These steps identified 37,626 putative TUs active in CD4+ T-cells of the primate ancestor. We added 17,167 TUs that did not overlap ancestral TUs but were found in any one of the three primate species.
Transcription unit classification
TUs were classified by annotation type using a pipeline similar to ones that we have described recently51,70,89. Before classifying TUs we applied a heuristic to refine TUs on the basis of known annotations. TUs that completely overlap multiple gene annotations were broken at the transcription start site provided that a dREG site overlapped that transcription start site. Classification was completed using a set of rules to iteratively refine existing annotations, as shown in Supplementary Fig. 13A. Unless otherwise stated, overlap between a TU and a transcript annotation was defined such that >50% of a TU matched a gene annotation and covers at least 50% of the same annotation. TUs overlapping GENCODE annotations (>50% overlap, defined as above) were classified using the biotype in the GENCODE database into protein coding, lincRNA (lincRNA or processed transcript), or pseudogene. The remaining transcripts were classified as annotated RNA genes using GENCODE annotations, the rnaGenes UCSC Genome Browser track (converted from hg18 to hg19 coordinates), and miRBase v2090. As many RNA genes are processed from much longer TUs, we required no specific degree of overlap for RNA genes. Upstream antisense (i.e., divergent) TUs were classified as those within 500bp of the transcription start site of any GENCODE or higher level TU annotation (including lincRNAs). Antisense transcripts were defined as those with a high degree of overlap (>50%) with annotated protein coding genes in the opposite orientation. The remaining transcripts with a high degree of overlap (>50%) to annotated repeats in the repeatmasker database (rmsk) were classified as repeat transcription. Finally, any TUs still remaining were classified as unannotated, and were further divided into those which are intergenic or that partially overlapping existing annotations.
Comparing transcription between conditions and species
Comparing transcription before and after CD4+ T-cell activation
We compared π treated and untreated CD4+ T-cells within each of the primate species using gene annotations (GENCODE v19). We counted reads in the interval between 500 bp downstream of the annotated transcription start site and either the end of the gene or 60,000 bp into the gene body (whichever was shorter). This window was selected to avoid (1) counting reads in the pause peak near the transcription start site, and (2) to focus on the 5’ end of the gene body affected by changes in transcription during 30 minutes of π treatment assuming a median elongation rate of 2 kb/ minute51,91. We limited analyses to gene annotations longer than 500 bp in length. To quantify transcription at enhancers, we counted reads in the window covered by each dREG-HD site plus an additional 250 bp on each end. Differential expression analysis was conducted using deSeq257.
Comparing transcription between species
Read counts were compared between different species in hg19 coordinates. In all analyses, reads were transferred to the hg19 reference genome using CrossMap with rbest nets. Our analysis focused on transcription units or on the union of dREG sites across species. We focused our analysis of transcription units on the interval between 250 bp downstream of the annotated transcription start site and either the end of the gene or 60,000 bp into the gene body (whichever was shorter). We limited our analyses to TUs longer than 500 bp in length. Reads counts were obtained within each transcription unit, gene annotation, or enhancer, abbreviated here as a ‘region of interest’ (ROI), that has confident one-to-one orthology in all species examined in the analysis. This strategy of focusing on blocks of one-to-one orthology avoids errors caused by systematic differences in mappability or repeat content of species-specific genomic segments. We broke each each ROI into segments that have conserved orthology between hg19 and all species examined in the analysis, which included either a three-way (human-chimp-rhesus macaque) or five-way (human-chimp-rhesus macaque-mouse-rat) species comparison. We defined intervals of one-to-one orthology as those represented in levels 1, 3, and 5 of the reciprocal best nets (with gaps defined in levels 2, 4, and 6)88. Reads that map to regions that have orthology defined in all species were counted using the bigWig package in R using reads mapped to hg19 coordinates. Final counts for each ROI were defined as the sum of read counts within the regions of orthology that intersect that ROI. ROIs without confident one-to-one orthologs in all species analyzed were discarded. Our pipeline makes extensive use of the bigWig R package, Kent source tools, as well as the bedops and bedtools software packages85,92. Differential expression was conducted between species using the deSeq2 package for R, as described above.
MCF-7 G11 cell culture
MCF7 G11 tamoxifen resistant cells, were a gift from Dr. Joshua LaBaer. Cells were maintained in DMEM with 5% FBS, antibiotics, and 1uM tamoxifen. MCF-7 G11 dCas9-KRAB stable cell lines were made (as described below) and were maintained in DMEM with 5% FBS, antibiotics, and 1uM tamoxifen. MCF-7 G11 dCas9-KRAB sgRNA stable cell lines were maintained in DMEM with 5% FBS, antibiotics, 1uM tamoxifen, and 150ug/ul Hygromycin B.
Luciferase assays
Genomic DNA was isolated from human, chimp, and rhesus macaque PBMCs depleted for CD4+ cells using a Quick-DNA Miniprep Plus Kit (#D4068S; Zymo research) following the manufacturer’s instructions. Putative enhancer regions were amplified from the genomic DNA, restriction digested with KpnI and MluI, and cloned into the pGL3-promoter vector (Promega). The same orthologous regions were amplified from all three species with identical primers where possible or species-specific primers covering orthologous DNA in diverged regions. Vectors were co-transfected with pRL-SV40 Renilla (Promega) in a 10:1 ratio (500ng pGL3 to 50ng pRL-SV40) in MCF7 G11 cells cultured in 1uM tamoxifen. Transfected cells were treated with either 25ng/ml TNFa or water 21 hours after transfection. 24 hours post-transfection, luminescence was measured in triplicate using the Dual-Luciferase® Reporter Assay System (Promega).
Silencing endogenous TREs using dCAS9-KRAB
Cloning signle-guide RNAs (sgRNAs)
Single-guide RNAs (sgRNAs) were designed using the CRISPR design tool (http://crispr.mit.edu) and sequences are shown in Supplementary Table 3. Forward and reverse sgRNAs were synthesized separately by IDT and annealed. T4 Polynucleotide Kinase (NEB) was used to phosphorylate the forward and reverse sgRNA during the annealing. 10x T4 DNA Ligase Buffer, which contains 1mM ATP, was incubated for 30 minutes at 37°C and then at 95C for 5 minutes, decreasing by 5°C every 1 minute until 25°C. Oligos were diluted 1:200 using Molecular grade water. sgRNAs were inserted into the pLenti SpBsmBI sgRNA Hygro plasmid from addgene (#62205) by following the authors protocol93. The plasmid was linearized using BsmBI digestion (NEB) and purified using gel extraction (QIAquick Gel Extraction Kit). The purified linear plasmid was then dephosphorylated using Alkaline Phosphatase Calf Intestinal (CIP) (NEB) to ensure the linear plasmid did not ligate with itself. A second gel extraction was used as before to purify the linearized plasmid. The purified dephosphorylated linear plasmid and phosphorylated annealed oligos were ligated together using the Quick Ligation Kit (NEB). The ligated product was transformed into One Shot Stbl3 Chemically Competent E. coli (ThermoFisher Scientific). 100ul of the transformed bacteria were plated on Ampicillin (200ug/ml) plates. Single colonies were picked, sequenced, and the plasmid was isolated using endo free midi-preps from Omega.
Transfection of MCF-7 G11 cell lines
We used lentivirus to transfect MCF-7 cells. Lentivirus was made using lipofectamine 3000 from Invitrogen. Phoenix Hek cells (grown in DMEM with 10% FBS and antibiotics) were seeded in a 6-well plate at 400,000 cells/plate. Cells were grown until ∼90% confluent. 1ug of pHAGE_EF1a_dCas9-KRAB plasmid from addgene (#50919) plasmid or the pLenti SpBsmBI sgRNA Hygro (addgene #62205) containing each sgRNA, 0.5ug of psPAX (addgene #12260), and 0.25ug pMD2.G (addgene #12259) were mixed.
MCF-7 G11 cells were plated at ∼200,000 cells/well in a 6-well plate. 24 hours later 3ml/well of virus was mixed with 10ug/ml polybrene and incubated for 5 minutes at room temperature. This mix was added to the cells and centrifuged for 40 minutes at 800g at 32C (Viju Vijayan Pillai, personal communication). 12-24 hours later the virus was removed and fresh media was added. 24-48 hours later the cells were selected with 2ug/ml puromycin for 2 weeks. The MCF-7 G11 dCas9-KRAB stable cell lines was grown and maintained in puromycin. A second lentiviral infection was done using the stable MCF-7 G11 dCas9-KRAB cells. The same protocol was used. 24-48 hours later the cells were selected with 150ug/ml Hygromycin B. New stable cell lines were grown and maintained in hygromycin B.
TNFa treatment
Prior to TNFa treatment, cells were grown for 3 days in DMEM with 5% FBS, antibiotics, tamoxifen and hygromycin. Cells were then left untreated or treated for 40 min with 25ng/ml TNFa. RNA was extracted using TRIzol Reagent (Invitrogen). We reverse transcribed 1ug of RNA and used this as input for real-time quantitative PCR (RT-PCR) to analyze SGPP2 expression. Primers for SGPP2 were designed targeting a sequence in intron 1, upstream of the intronic enhancer. Raw Cp values were transferred to units of expression using a standard dilution curve comprised of a mixture of cDNA from each sample within the biological replicate. We included four serial dilutions, each of which covered a two-fold difference in expression. Each sample was further normalized for differences in RNA content by primers recognizing the 18S rRNA control. The ratio between normalized SGPP2 expression in each sgRNA-transfected MCF-7 cell line and the empty vector control was log-2 transformed and tested for differences from 0 using a two-sided t-test.
Data availability
PRO-seq data was deposited into the Gene Expression Omnibus database under accession number GSE85337.
Code availability
All data analysis scripts and software are publicly available on GitHub: https://github.com/Danko-Lab/CD4-Cell-Evolution.
Author contributions
LAC, BAM, CGD, EJR, and ETW performed CD4+ T-cell extraction, validation, and PRO-seq experiments. CGD, ZW, TC, ALM, LAC, and ND analyzed the data. CGD, AS, JTL, WLK, and SAC supervised data collection and analysis. CGD and AS wrote the paper with input from the other authors.
Competing financial interests
The authors declare no competing financial interests.
Author information
PRO-seq data was deposited into the Gene Expression Omnibus database under accession number GSE85337. All data analysis scripts and software are publicly available on GitHub: https://github.com/Danko-Lab/CD4-Cell-Evolution.
Acknowledgements
We thank M. Jin for assistance in establishing the magnetic separation of CD4+ T-cells, L. Core, H. Kwak, N. Fuda, and I. Jonkers for assistance troubleshooting the PRO-seq library prep, and A. Wetterau for preparing nuclei for mouse and rat CD4+ T-cells. Work in this publication was supported by generous seed grants from the Cornell University Center for Vertebrate Genomics (CVG), the Center for Comparative and Population Genetics (3CPG), NHGRI (National Human Genome Research Institute) grant HG009309 to CGD, NHLBI (National Heart, Lung, and Blood Institute) grant UHL129958A to CGD and JTL, NIGMS (National Institute of General Medical Sciences) grant GM102192 to AS, NHGRI (National Human Genome Research Institute) grant HG0070707 to AS and JTL, NIH/NIDDK DK058110 to WLK, and CPRIT RP160319 to WLK. The content is solely the responsibility of the authors and does not necessarily represent the official views of the US National Institutes of Health. Finally, we would like to thank the anonymous human and non-human primate donors who gave blood in support of this study.
References
- 1.↵
- 2.↵
- 3.↵
- 4.↵
- 5.
- 6.
- 7.↵
- 8.↵
- 9.↵
- 10.↵
- 11.
- 12.↵
- 13.↵
- 14.↵
- 15.
- 16.↵
- 17.↵
- 18.
- 19.↵
- 20.↵
- 21.
- 22.
- 23.
- 24.↵
- 25.↵
- 26.↵
- 27.↵
- 28.↵
- 29.↵
- 30.↵
- 31.↵
- 32.↵
- 33.↵
- 34.↵
- 35.↵
- 36.↵
- 37.↵
- 38.↵
- 39.↵
- 40.↵
- 41.↵
- 42.
- 43.↵
- 44.↵
- 45.↵
- 46.↵
- 47.
- 48.
- 49.↵
- 50.↵
- 51.↵
- 52.↵
- 53.↵
- 54.↵
- 55.↵
- 56.↵
- 57.↵
- 58.↵
- 59.↵
- 60.↵
- 61.↵
- 62.↵
- 63.↵
- 64.↵
- 65.↵
- 66.↵
- 67.↵
- 68.↵
- 69.↵
- 70.↵
- 71.↵
- 72.↵
- 73.↵
- 74.↵
- 75.↵
- 76.↵
- 77.
- 78.↵
- 79.↵
- 80.↵
- 81.↵
- 82.↵
- 83.↵
- 84.↵
- 85.↵
- 86.↵
- 87.↵
- 88.↵
- 89.↵
- 90.↵
- 91.↵
- 92.↵
- 93.↵


