

Abstract
To characterize the role of the left ventral occipito-temporal cortex (lvOT) during visual word recognition in a quantitatively explicit and testable manner, we propose the lexical categorization model (LCM) according to which lvOT categorizes perceived letter strings into words or non-words. LCM simulations successfully replicate nine benchmark results from human functional brain imaging. Empirically, using functional magnetic resonance imaging and electroencephalography, we demonstrate that quantitative LCM simulations predict lvOT activation and brain activation at an expected time window, respectively. In addition, we found that word-likeness, which is assumed as input to LCM, is represented posterior to lvOT and before the lexical categorization. In contrast, a dichotomous word/non-word contrast, which is the assumed as output of the LCM, could be localized to upstream frontal brain regions. Thus, we propose a ventral-visual-stream processing framework for visual word recognition involving word-likeness extraction followed by lexical categorization, prior to the extraction of word meaning.
1 Introduction
Reading is a crucial cultural achievement, and efficient recognition of written words is at its core. Insights have been gained into the cognitive and brain systems involved in visual word recognition, including the identification of a word-sensitive region of the left ventral occipito-temporal cortex (lvOT). This region is often also referred to as the visual word form area (VWFA1); it is reliably activated by written words2, its structure and function is compromised in developmental reading disorders3,4, lvOT lesions result in severe reading deficits5, and electrical stimulation of this area can impair word recognition6. However, there is at present no agreed-upon mechanistic understanding of which process is implemented in lvOT while recognizing visual words7. Here, we propose a simple computational model of lvOT function during reading, i.e., the lexical categorization model (LCM), which integrates insights from cognitive psychology and psycholinguistic research, to explicitly model the response profile of lvOT to different types of (lexical and non-lexical) orthographic stimuli.
The lvOT is part of the ventral-visual processing stream8. It was proposed that lvOT receives converging bottom-up visual input from both hemispheres and processes abstract representations of recurring letter sequences – including sublexical units and small words1,9. This proposal is in part based on the finding that lvOT is sensitive to word-similarity10, in the sense of decreasing lvOT activation (measured with functional magnetic resonance imaging/fMRI) with decreasing word-similarity of non-words (i.e., high activation for non-words containing letter sequences that frequently occur in real words, e.g. ‘ous’ in mousa and low activation for non-words containing orthographically illegal letter combinations; e.g. mkzsq). Seemingly contradictory, it was reported that more familiar (i.e., more frequently occurring) words showed less lvOT activation as compared to words of low frequency of occurrence11. In sum, empirical data indicates that while word-similarity (in the sense of sub-lexical orthographic similarity) increases lvOT activation, word-familiarity (in the sense of word frequency) decreases lvOT activation. This seemingly counterintuitive set of results suggests that lvOT responds in a non-linear fashion to the ‘word-likeness’ of orthographic strings, showing greatest activity for words of intermediate word-likeness (e.g. words with low word-familiarity and non-words with high word-similarity) and least activity both for highly word-like, frequent words as well as for orthographically illegal and rarely co-occurring (‘word-un-like’) strings of letters.
The non-linear response profile of lvOT to different types of orthographic stimuli resembles the relationship between word-likeness and behavioral performance in word recognition tasks. Using a lexical decision task (categorical word/non-word decisions), Balota and Chumbley12 observed that lexical decisions for letter strings with intermediate levels of word-likeness were more difficult (in terms of higher error rates and longer response times) than decisions to very familiar words or very ‘word-un-like’ non-words (see also13). Based on these results, they proposed that categorical recognition can be achieved for frequently occurring words and for non-words that are very word-unlike (see above) exclusively on the basis of their word-likeness. In contrast, at intermediate word-likeness levels (e.g., for rarely occurring words, words of a foreign language, or – as used in psychological experiments – orthographically legal but meaningless pseudowords), uncertainty exists concerning the lexical nature of the letter strings. This ambiguity is reduced by further analytic processing, e.g., based on sublexical unit processing (letters or syllables) or word-spellings.
We here propose that lvOT implements an analogous process, i.e., computing a dichotomous lexical categorization based on the word-likeness of perceived orthographic strings, thereby filtering out uninformative non-words preventing further linguistic processing. This proposal is consistent with one of the core computational functions of the ventral-visual-stream, i.e., the categorization of percepts into different categories of objects. A recent proposal described a hierarchical categorization framework of nested, spatially distinguishable cortical levels to differentiate between objects14. For example, animate vs. inanimate objects activate separable ventral-stream regions, while spatially dissociable sub-regions represent different lower-level features, such as faces or eyes for the animate subcategory. Just as this architecture allows us to differentiate between objects, it is also known to efficiently categorize between letter strings and non-orthographic objects6,15,16. Within the framework of hierarchically organized ventral-stream processing, it is plausible to assume that a categorical distinction between existing words and non-words is computed at the next level of resolution – as a basis for subsequent linguistic processing.
We propose that lvOT categorizes orthographic strings into words vs. non-words based on the word-likeness of the input letter strings. This categorization, we assume, precedes the retrieval of word meaning (in psychology often called ‘lexical access’), e.g., to save neuronal resources by preventing attempts of further linguistic processing of non-words. Importantly, as reviewed above, lvOT activity does not directly reflect word-likeness, but rather a non-linear transformation of word-likeness that represents the level of uncertainty associated with the word/non-word categorization. We hypothesize that the behavioral pattern shown in lexical decision tasks is a reflection of the processes that compute lexical status, thus providing a mechanistic explanation for the observed non-linear activation pattern of lvOT. Based on the above-discussed hierarchical organization of the ventral-visual-stream, we in addition derive the novel hypothesis that a dichotomous lexicality effect in the face of a wide range of word-likeness in the input stimulus set should be detectable not in lvOT proper, but in regions upstream to the classical localization of the visual word form area.
To characterize the lvOT’s role for word recognition in a quantitatively explicit and testable manner, we implemented this hypothesis in a simple computational model, the lexical categorization model (LCM) of lvOT function, designed to predict the BOLD response of lvOT dependent on the word-likeness of the input letter string. Current conceptions of lvOT functioning in visual word recognition are verbal-descriptive, suggesting that lvOT activation reflects the overlap of a presented letter string with stored representations9,10, a word-frequency-based whole-word lexicon search process11,17,18, or a predictive coding process in which lvOT activation reflects the error in relation to internally generated predictions19 (for details and implemented versions see Supplement 1). In contrast, a computational implementation has the advantage that the simulations can be quantitatively evaluated, thereby enabling direct falsification. We here model lvOT activation without considering task context, in order to explore how much of its response profile can be explained by differences in the stimulus characteristics only. Simulations of the LCM will be evaluated against nine benchmark effects reported in the literature. Following this, we report empirical evaluations of the LCM, i.e., two fMRI studies to evaluate if the uncertainty of a lexical categorization is represented in lvOT activation, while dichotomous lexicality is represented upstream to lvOT, and an electrophysiological study (EEG) investigating our hypothesis that the lexical categorization is represented before or at the same time as effects related to the extraction of word meaning in the amplitudes of event related potentials (ERP).
LCM implementation
To implement the LCM, we first derived the word-likeness distributions of a large set of orthographic strings. We estimated word-likeness (OLD2020) of all German five letter uppercase words (3,110; example: Augen) and the same number of pseudowords (e.g., Augon) and consonant strings (e.g., Zbgtn). The distributions (Fig. 1a) of words and pseudowords overlap strongly in intermediate familiarity ranges (consistent with12). High word-likeness indicates that letter strings are highly likely words, whereas low word-likeness levels indicate consonant strings. For these items, word-likeness allows word/non-word categorizations with high degrees of certainty. In contrast, at intermediate word-likeness levels, lexical status is ambiguous and additional evidence is needed for word/non-word categorization. Given the assumption that lvOT implements a filter process that drives a dichotomous categorization of every perceived letter string into words vs. unknown letter strings, and given the uncertainty associated with this categorization function in the face of overlapping word-likeness distributions at intermediate levels of word-likeness, we here propose that the non-linear response profile of lvOT is very well-described by lexical categorization uncertainty, here implemented using the information theoretical concept of entropy (Fig. 1b; see Methods). This conception receives some preliminary support from an fMRI study21 which showed lvOT sensitivity to both lexical status (word/non-word) and orthographic similarity of letter strings (with the caveat of a limited set of words and pseudowords).

Description of the lexical categorization model (LCM). (a) Word-likeness distributions (kernel density estimates), based on the orthographic Levenshtein distance (OLD2020) or words (gray), pseudowords (blue), and consonant strings (yellow) including an example for each category. (b) Probability that a letter string with a given an OLD20 value is a word (gray line) or a non-word (blue line). The black line represents the estimated entropy (Equation 1), which combines the probabilities of being a word or non-word, across all possible OLD20 values. The LCM’s central hypothesis is that this entropy function reflects lvOT activation across all possible levels of word-likeness, effectively representing the lexical categorization uncertainty.
Results
Evaluation 1: LCM simulations of benchmark effects
As a first critical test, the LCM was used to simulate published data, i.e., lvOT activation contrasts between different types of visually presented letter strings. This was realized by transforming the word-likeness of each letter string via the entropy function depicted in Figure 1b (reflecting lexical categorization uncertainty) into a simulated activation value. Figure 2 displays LCM simulations for different types of letter strings (see Methods) that successfully reproduce published benchmark effects: pseudowords>words22; words>consonant strings2; pseudowords>words>consonant strings23; pseudohomophones>words and pseudohomophones=pseudowords17; pseudowords>words matched on multiple lexical characteristics24; word similarity effect: low word similarity<intermediate word similarity<high word similarity=words10; increasing lvOT activation with decreasing word frequency11 including pseudowords (note that when only words were used, the latter effect was still negative but reduced: -0.40 and -0.17, respectively; see also25,26 and Supplement 2 for additional information); bigram frequency effect: increasing lvOT activation with increasing bigram frequency27. Thus, on the basis of a descriptive comparison, we conclude that LCM simulations capture the benchmark effects of visual word recognition very well. Simulations of implementations of alternative accounts1,11,19 of lvOT function are reported in the Supplement 1. As Figure 2 in comparison to Supplement 1 shows, only the LCM was able to successfully simulate all nine identified benchmark effects; none of the single process alternative models could account for more than six benchmark effects. Given that the most obvious feature that distinguishes the LCM from the other models pertains to the implementation of the inverted-u shaped entropy function, we here propose that this non-linearity is a key property of the lvOT response to visual words.
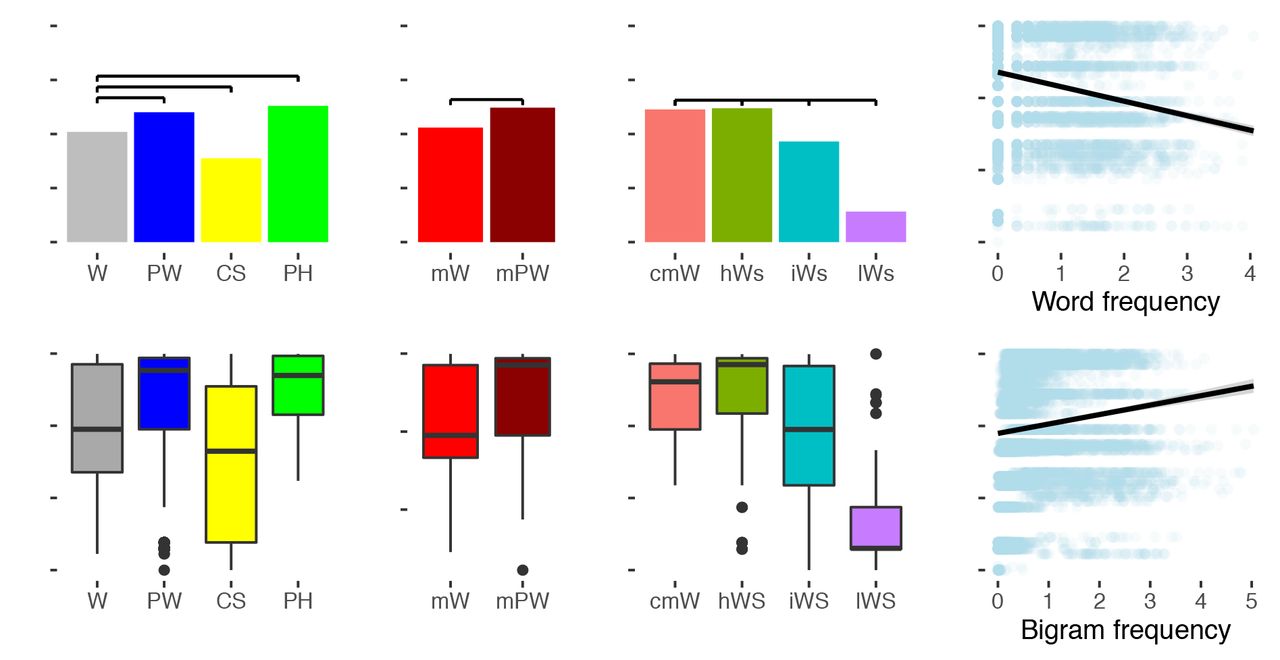
Evaluation 1 of the LCM based on simulations of lvOT benchmark effects from the fMRI literature. Simulated lvOT activation for all groups of letter strings is presented using bar graphs depicting their respective mean activation (upper row) and corresponding boxplots depicting the medians, distributions, and outliers of each group of letter strings (lower row). In addition, horizontal black bars in the upper row indicate significant differences of the simulation results between letter string categories, as derived from linear models (Bonferroni corrected). LCM simulated lvOT activation is presented, from left to right, for words (W), pseudowords (PW), consonant strings (CS), pseudohomophones (PH), words and pseudowords matched on number of syllables, number of Coltheart’s orthographic neighbors, frequency of the highest frequency neighbor, initial bigram frequency, final bigram frequency, and summated bigram frequency (mW, mPW), and the word similarity effect comparing words (cmW: comparative matched words) to non-words with high word similarity (matched on quadrigram frequency; hWS), to non-words with intermediate word similarity (matched on bigram frequency; iWS), and, to non-words with low word similarity (lWS). In addition, the word frequency effect (for all words and pseudowords) and the bigram frequency effect are presented as scatter plots with a linear regression line. Each dot represents one letter string, the more saturated the blue gets, the more letter strings are included. See text for more detailed description of the replicated benchmark effects including the specific stimulus sets used.
Evaluation 2: LCM simulation predict lvOT activity
To test whether or not quantitative LCM predictions capture activity in lvOT, we used fMRI (cf. Methods for acquisition parameters and preprocessing). Participants viewed a set of letter strings covering a wide range of word-likeness (i.e., words, pseudowords, consonant strings, and strings of scrambled letters) in a block design with condition-specific blocks. Participants pressed a button whenever they detected a target (‘#####’). Scrambled items were generated from the words by randomly replacing 90% of pixels of the monochrome images; this condition was assumed to be maximally unfamiliar and therefore a very low word-likeness was assumed. For all stimuli, the predicted lvOT activation was equivalent to the lexical categorization uncertainty as described above. fMRI analysis involved a predictor with item onsets as events of interest, independent of condition; item-specific LCM simulations were then used as a continuous predictor for the fMRI data without explicitly accounting for condition differences.
If the proposed categorization process is realized in lvOT, quantitative LCM simulations should predict activation in this area. Our results support this prediction: Across the brain, only lvOT (Fig. 3a; Table 1) shows a positive relationship between LCM simulations and BOLD response. Condition-specific LCM-simulated (Fig. 3b) and empirically measured (Fig. 3c) activation patterns at the peak voxel of the lvOT cluster were comparable, with the exception that the model did not predict the significantly lower activation for words in contrast to pseudowords (peak voxel analysis: LMM estimate = -0.27; SE = 0.08; t = 3.6; see Methods for details on the linear mixed models/LMM28 analysis). Figure 3d shows the positive linear relationship between LCM-simulated and empirically observed lvOT activation overall and for all subjects individually (LMM estimate = 0.10; SE = 0.02; t = 6.0).
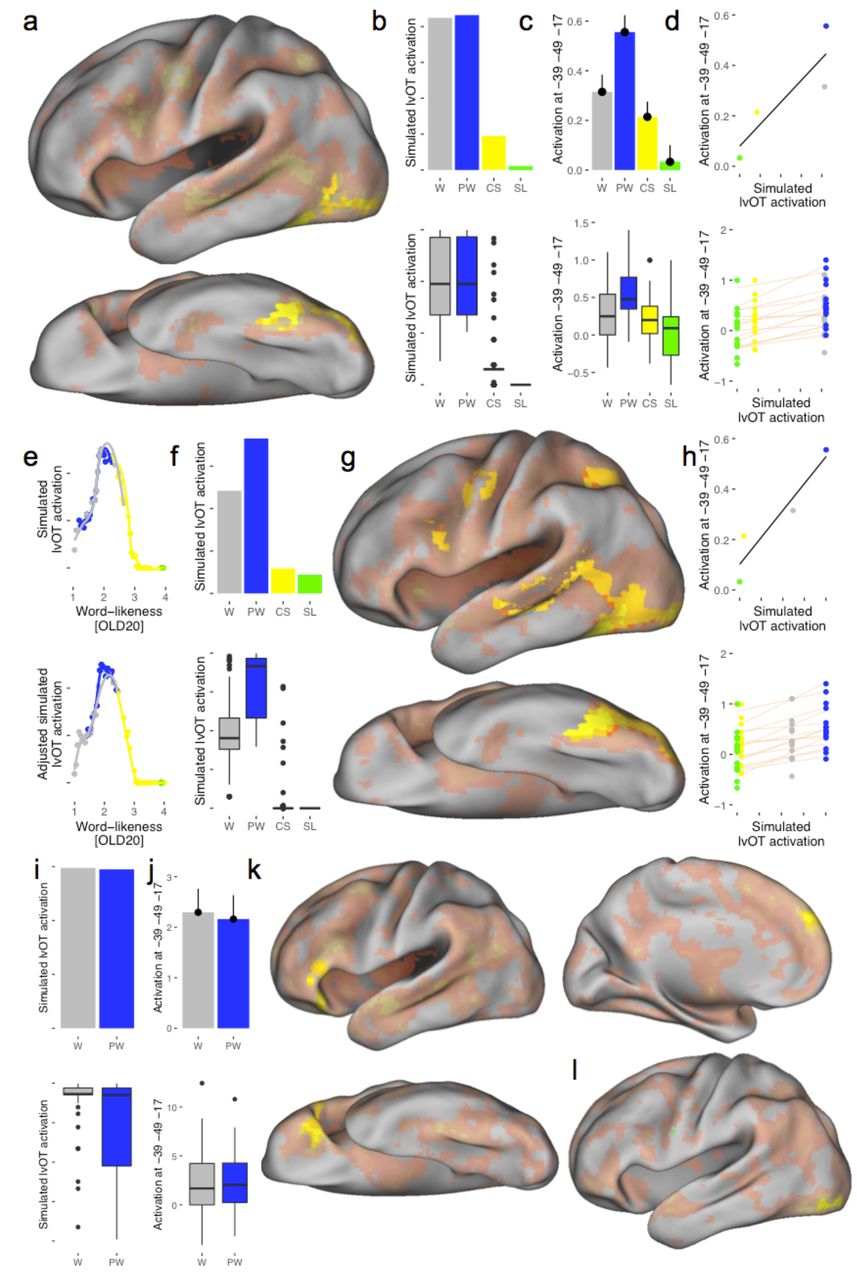
Evaluation 2: fMRI. (a) BOLD-activation from Experiment 1: LCM simulations predict lvOT activation in whole brain analysis. Saturated-yellow highlights the only significant cluster. Note, de-saturated colors show the distribution of non-significant beta-values. (b) LCM predicted and (c) empirically observed lvOT activation for words (W), pseudowords (PW), consonant strings (CS), and scrambled letters (SL), extracted from the peak voxel. As in Figure 2, for each condition, we present the means (upper row; error bars represent one standard error of the mean) and corresponding boxplots for the simulations and peak-voxel percent signal change. (d) The linear relationship between lvOT activation and LCM-simulations overall (top; black line) and for each individual (bottom; beige lines). Note, there is no variance between participants on the x-axis, as each participant’s empirical BOLDresponses were compared against the same LCM simulation. (e) Points show the entropy values for each string in relation to word-likeness from the LCM in the upper and from the blocked design adjusted LCM (LCM_Block) in the lower panel. (f) Simulation results from LCM_Block, (g) corresponding whole brain analysis, and (h) the linear relationship of lvOT activation and LCM_Block-simulated activation overall and individually. (i) LCM-predicted and (j) empirically observed BOLD-activation from lvOT in Experiment 2 (peak voxel from Experiment 1) for words (W) and pseudowords (PW); condition means and corresponding boxplots. Whole-brain results for (k) the dichotomous words>pseudowords contrast and (l) the word-likeness (OLD20) effect. Thresholds for all whole brain analyses: voxel level: p< .001 uncorrected; cluster level: p< .05 family-wise error corrected.
These findings indicate that the LCM indeed characterizes BOLD activation patterns of lvOT during visual word processing. The detected activation cluster is consistent with previous localizations of the VWFA (including published MNI peak coordinates such as -48, -56, -1610). The only obvious discrepancy was observed for words, for which LCM predicted a larger activation than empirically observed. It is worth noting that the presentation of the letter strings was organized in conditions-specific blocks (i.e., 16 items of the same category in a succession), so that the predictability of the next item concerning word/non-word categorization was high. Given that task is not explicitly taken into account in the LCM, we speculate that while words and pseudowords were matched in their word likeness, the blocked design may have strategically reduced the amount of processing devoted to identifying items as words (which is implemented in the LCM as entropy), thereby leading to the reduced activity relative to the model prediction.
To investigate if the categorical predictability influences lvOT processing, we implemented a second LCM (LCM_Block; see Methods for details). The LCM_Block accounts for the categorical predictability of stimuli in the block design by decreasing/increasing the word-likeness (OLD20) values for words/non-words, respectively, by a constant, thereby effectively increasing both the probability of being a word or non-word within each block. Currently no literature is available that gives an indication for the magnitude of this effect. Therefore, the exact value was derived from a fit to the empirical peak voxel activation (Fig. 3c). Inspecting the categorization uncertainty of each letter string for the LCM (Fig. 3e upper panel) indicates that simulated activation of both words and pseudowords were distributed along the left flank of the entropy function before accounting for block. When accounting for the blocked design (Fig. 3e lower panel), pseudowords moved up the left flank, towards the highest entropies, while words moved down, resulting in a larger simulated activation difference, with lower activations for words than for pseudowords (see Fig 3f for simulation results). As Fig. 3gh show, this task-adjusted version of LCM provides a better representation of empirical lvOT activation as well as a number of additional brain regions (e.g., left middle temporal; Fig. 3g; Table 1) showing similar but less pronounced activation patterns. In the current conception of the LCM, these regions might contribute to the proposed additional information extraction for letter strings with high categorization uncertainty, and therefore support categorization processes in lvOT (similar as indicated by19).
In a second fMRI study we realized an event related design, presenting words and pseudowords (that were matched for word-likeness) in random order, with 39 participants reading these letter stings silently and responding to catch trials (detect the German word Taste - button). LCM simulations for these stimuli predicted high lvOT activation for both conditions with only very subtle condition differences (Words>Pseudowords; Fig. 3i). lvOT (here analyzed as region of interest cluster from Experiment 1; cf. Fig. 3a) showed high activation levels with no differences between words and pseudowords. At a very liberal uncorrected threshold, in line with the LCM predictions, a higher activation for words was found (p < .5; i.e., at -40, -42, -18; T = 2.1; see Fig. 3j; no effects in the opposite direction). Crucially, a dichotomous lexicality effect (i.e., words>pseudowords independent of word-likeness) was found in left frontal regions (Fig. 3k; Table 1), which is consistent with our hypothesis that brain regions upstream to lvOT represent the result of the word/non-word categorization implemented in lvOT. Finally, a reliable activation cluster in inferior occipital cortex (i.e., posterior lvOT) responded to the word-likeness of the stimuli (Figure 3l; Table 1), consistent with our proposal that the input to lvOT is driven by word-likeness.
In sum, the LCM simulations (Figs. 2, 3b, and 3i) are in line with observed lvOT activation patterns. Across the entire brain, the simulation of the LCM predicted activity in the often-replicated word-sensitive cluster in lvOT. Remaining differences between LCM predictions and peak voxel activation in study 1 could be attributed to specific features of the experimental task in that study. Study 2 replicated the good convergence between model simulation and brain activation and furthermore showed a direct neural correlate of word-likeness in posterior lvOT and dichotomous lexicality effects independent of word-likeness upstream to lvOT (for similar analysis of experiment 1 see Supplement 3). These results support our proposal that lvOT computes, in a non-linear fashion, a dichotomous lexical categorization, using word-likeness as input.
Reliable activation clusters from both Experiments of Evaluation 2 with respective anatomical labels (i.e., most likely regions from the Harvard-Oxford atlas50), cluster size, T-statistics, and peak voxel coordinates (MNI space).
Evaluation 3: Time course specificity of LCM predictions - EEG data
Finally, we investigated the temporal succession of cognitive processes in visual word recognition using electrophysiological (EEG) data. In line with general notions of ventral-visual-stream organization8, LCM assumes a succession of processes from posterior occipital to frontal regions. Posterior occipital regions, accordingly, should process low-level features of incoming visual information (which we quantify by the amount of the visual information in pixel; i.e. AVI). Subsequently, we assume the estimation of word-likeness, which then serves as input to the next processing step, i.e., lvOT’s lexical categorization process as described by LCM. Support for these assumptions would be obtained if AVI, word-likeness, and LCM simulations can satisfyingly account for EEG data in this temporal sequence (for similar accounts see29 and30). Finally, higher levels of information extraction from words are initiated, here reflected by the effects of lexicality (words vs. non-words) or word frequency31 (see also Supplement 2). As lexicality effects were identified in brain regions anterior to lvOT, we here predict that lexicality and frequency effects should temporally follow the time window of the LCM effect.
31 participants silently read 200 words, 100 pseudowords, and 100 consonant strings, while ERPs were recorded from 64 electrodes (cf. Methods). Figure 4a presents the grand-average ERP, with scalp-topographical maps showing the succession of the classic ERP components P100, N170, and N400. For analysis we used multiple linear regression estimating multiple parameters in a single statistical model including five predictors (cf. Fig. 4bcd; see also32–34): amount of visual information (total number of black pixels of all letters of the item), word-likeness (OLD20), LCM-simulated activation (Fig. 4b), as well as lexical status and word frequency31 (with the exception of lexicality, all predictors were continuous; frequency of non-words was set to 0). LCM predicts that activation for words is lower than for pseudowords but higher than for consonant strings (Fig. 4b). The fiveparameter model is estimated separately for each time point (500 ms pre-to 800 ms post-stimulus onset; 1 ms resolution) and sensor. Correlations among predictors (Fig. 4c) are accounted for by estimating all predictors at the same time and a correction for multiple comparisons was implemented by a cluster based permutation test35. Importantly, LCM simulations had no high correlation with any of the other predictors (all r’s < .2). OLD20 was associated with lexicality and frequency (r < -.6), and lexicality and frequency were strongly related (r = .9), which results from coding non-words with zero on both parameters. Figure 4d demonstrates that ERP amplitudes at a left frontal electrode (AF7) at 470 ms post stimulus-onset are positively related to LCM simulations and negatively associated with OLD20.

Evaluation 3: EEG. (a) Grand-average ERPs from all sensors (each line represents one sensor; within-plot topographical map color-codes scalp position), averaged across (i) all letter stings presented and (ii) all participants, with topographic maps for the P100, N170 and N400 components. (b) Means and boxplots (see Fig. 2) for LCM simulations for the three letter-string conditions used in this study, i.e., words (W), pseudowords (PW), and consonant strings (CS). (c) Pearson correlation matrix for the five predictors used in the statistical linear model for the ERP: Amount of visual information (AVI), OLD20 (OLD), LCM simulation (LCM), lexicality (Lex.) and word frequency (Freq.). Saturated and de-saturated colors indicate high and low correlations, respectively. Red indicates positive and cyan negative correlations; numeric values represent the exact correlation coefficient. (d) Exemplary ERP data from a left frontal EEG sensor (AF7) at 470 ms with respective linear regression lines for the LCM and OLD20 effects. (e-j) Estimated effect sizes from the regression analysis presented as time courses for each sensor and point in time including topographical maps at 200, 320, 420, and 530 ms (left column), as well as time course plots with one line per channel, masked by significance in a cluster-based permutation significance test, (e, f) for OLD20, (g, h) for LCM simulations, and (i, j) for word frequency. Color scale bars represent the effect size for both the statistical masked and topographic plots. EEG channels are displayed from front to back within each subplot of the right column.
Figures 4e,g,i present, for each electrode, the time course of estimated effect size for word-likeness, LCM simulation, and word frequency, respectively, with topographical maps reflecting the effects’ scalp distributions. Figures 4f,h,j show the significant effects as determined using permutation tests on the effect sizes derived from the linear regression model35. No significant effect of luminance and lexicality was found (the latter due to the high correlation with word frequency indicating that frequency describes meaning extraction better; see also Supplement 2). Starting from ∼170ms, word-likeness (Fig. 4f) significantly predicted ERP amplitudes, followed at ∼300ms by LCM simulations (Fig. 4h) and by word frequency ~400ms (Fig. 4j). In addition, a statistical model comparison between the present model and a model without the LCM-predictor, exemplarily for electrodes Pz and Fz at the critical time window ~320ms, LMM analysis including the LCM simulations had a significantly better fit than the model without the LCM factor (Akaike information-criterion at Pz: 168532 vs. 168566; χ2(1) = 35.7; p < .001; Fz: 171428 vs. 171454; χ2(1) = 27.7; p < .001), indicating that the LCM simulations are an integral part of the description of the EEG data over and above stimulus luminance, word-likeness, word frequency and lexicality. Of note, the late word frequency effect (relative to e.g.32) can be attributed to the simultaneous modeling of multiple predictors, since when frequency was introduced as the only predictor, a significant frequency effect was present already ~200ms (see Supplement 4). In sum, ERP results are in line with the LCM-predicted sequence of events, starting with word-likeness estimation, which is then used for the lvOT-based process of lexical categorization, ultimately resulting in a late differentiation between meaningful words and non-words.
Discussion
We propose that the word-sensitive cortical area in lvOT implements a categorization of perceived orthographic strings into words vs. non-lexical orthographic strings, and formalize this process in the lexical categorization model. The computational implementation of this categorization process is fundamental to the understanding of lvOT’s complex activation pattern in response to a variety of types of letter strings irrespective of their task context (compare10 and11). Evaluations of the LCM found that it is capable of simulating multiple published benchmark fMRI findings, provides a very good prediction of empirical fMRI activations in lvOT, and predicts ERP amplitudes at an expected time window, in a highly plausible temporal sequence of processing stages. The present findings, thus, suggest that during reading, in a first step, word-likeness is estimated by left occipital regions, followed by the lexical categorization of perceived orthographic strings by lvOT. Finally, wordspecific processes are realized, such as the extraction of word meaning, at downstream cortical sites including frontal cortex (Fig. 5).
We see the LCM as a quantitatively explicit extension of previous visual word recognition models of lvOT1,11,19. Our work differs from previous approaches by the explicit consideration of a wide range of word-likeness and by the utilization of an optimal word-likeness estimate (OLD2020; see Supplement 5 for LCM model simulations based on alternative word-likeness estimates). Based on these two elements, a non-linear categorization uncertainty function could be implemented, that captures both the activation increase with decreasing word-familiarity (in high-to-intermediate word-likeness), predicted by lexicon search models11,17, as well as the activation decrease with decreasing word-similarity predicted by the visual word form area model1. The OLD20 word-likeness estimate is also theoretically meaningful, as it is a reasonable proxy for the perceptual familiarity that one acquires while becoming an efficient reader. Thus, person-specific implementations of the LCM based on individual word knowledge will be important future avenues for this research.
At its core, the LCM-simulated activation reflects the uncertainty of the lexical categorization. This uncertainty is low for letter strings of very high and very low word-likeness, enabling efficient lexical categorization of letter strings. At intermediate word-likeness levels, however, lexical categorization uncertainty is high since word-likeness distributions of words and non-words overlap – which discards word-likeness as the basis for lexical categorization and thus requires the inclusion of additional information. Spelling information was brought forward as one possibility to reduce categorization uncertainty12, which was also associated with lvOT36. In addition, from the LCMadaptation for the blocked design (Evaluation 2) we learned that a network co-activates with lvOT, which may represent a support structure in case additional information is needed. Interestingly, white matter connectivity of a similar network prior to literacy acquisition was shown to predict individual differences in the location of the letter string-sensitive lvOT region37 and a similar network is structurally connected to adult lvOT38. Given that detailed letter string processing (e.g. grapheme-to-phoneme conversion18) is critical to literacy acquisition, this developmental perspective could be adopted to suggest that detection of unknown words by lvOT (as implemented in LCM), at the beginning of reading acquisition, motivates information search and thereby supports the acquisition of new vocabulary39.
In conclusion, the LCM – which is conceptually inspired by general models of a ventral visual processing stream from occipital to anterior temporal and frontal regions - is the first computationally explicit model that reliably describes lvOT activation patterns in relation to a wide range of different letter strings. Empirical evaluations of the LCM support a framework starting with early word-likeness estimations in posterior regions, feeding this information into lvOT as the basis for lexical categorization. Activation in the lvOT reflects the uncertainty of the lexical categorization process. When the uncertainty is high, more in-depth analysis of the orthographic stimulus is assumed. Finally, after non-words are filtered out, higher-level cognitive processes, such as extraction of word meaning, are postulated to occur in downstream areas including frontal cortex. This framework (Figure 5), including the LCM as central cognitive process, is a large step towards brain-based computational accounts40 for information processing in reading.
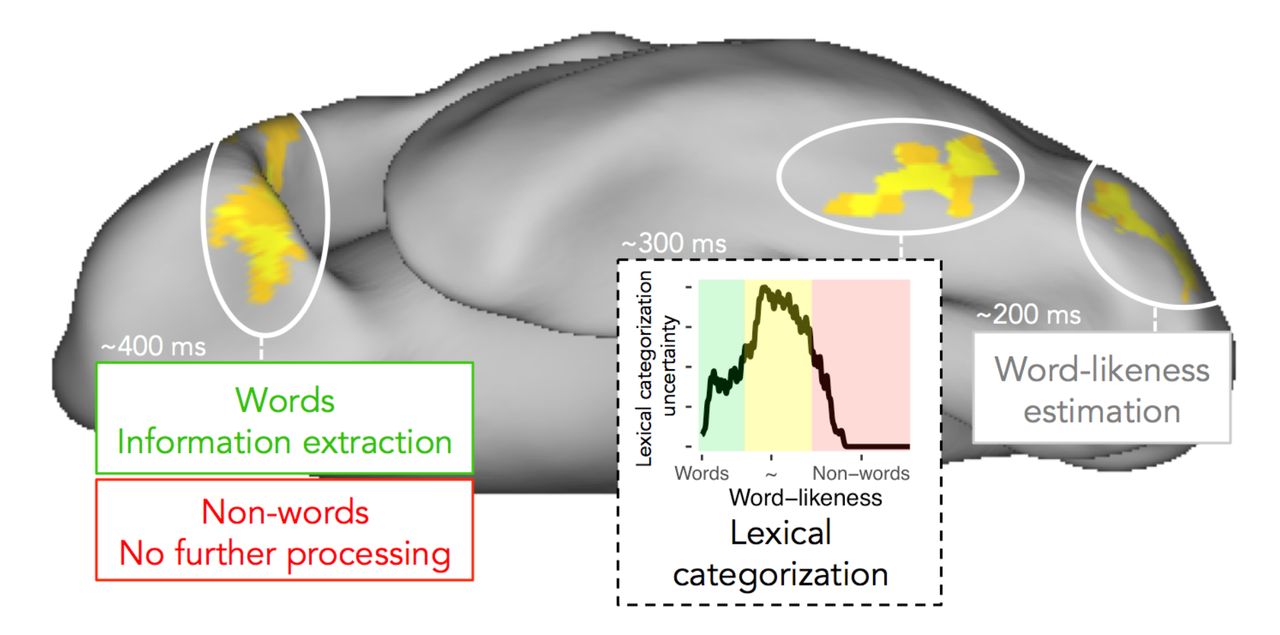
Schematic description of ventral visual stream processing during visual word recognition as assumed in the lexical categorization model, including (i) word-likeness estimations, (ii) lexical categorization, and (iii) the extraction of word meaning in most anterior regions. For the lexical categorization process implemented in lvOT the uncertainty is presented, visualizing the assumption that higher degrees of categorization uncertainty – in areas of intermediate word-likeness – may require further elaborative processing to reach a lexical categorization.
Methods
LCM implementation
Given that previous work indicated a relationship between lvOT processing and word-similarity10 or word-familiarity11, the implementation of the LCM relies on an optimal measure of word-likeness - the mean Levenshtein distance over the 20 nearest words (i.e., the 20 words with the lowest distance; OLD20)20. Word-likeness distributions were derived for a larger number of orthographic strings by first estimating the Levenshtein distance, i.e., a measure of the similarity of any two strings of letters based on the number of insertions, deletions, substitutions, and/or transpositions of two adjacent letters41. Word-likeness was quantified as the mean Levenshtein distance over the 20 nearest words20. OLD20 is considered superior to other established lexical measures20 such as e.g. Coltheart’s N, as it was shown to be the better predictor of behavioral word recognition performance. In addition, this measure allows to differentiate between a large range of orthographic stimuli (compare, e.g., Fig. 1a with the left panels of Supplement 5). For example, most non-words and a large number of words have zero orthographic neighbors. This indicates that the number of neighbors assigns the same parameter value (zero) to qualitatively very different letter strings (e.g. words as well as consonant strings; Supplement 5). In contrast, the OLD20 overcomes the inability to differentiate between large numbers of very different letter strings as the described (see above) allows to catch up much more subtle differences in word-likeness, which results in much more normally distributed word-likeness values that allows for the most part at least a clear differentiation between words and consonant strings (Figure 1a). The OLD20 is potentially a useful proxy of perceptual familiarity since the size of the lexicon used to estimate the OLD20 strongly determines word-likeness estimation (e.g. with a small lexicon the probability to find a high number of similar words is very low since the estimation includes the 20 nearest words; see Supplement 6 for simulations). OLD20 was estimated for all German five letter uppercase words (n = 3,110; extracted from N = 377,524 words of the SUBTLEX database31; estimated using the old20 function of the vwr-package42 in GNU R). For each of the selected words (e.g., Augen - eye), we also generated a pseudoword by replacing vowels to form phonotactically and orthographically legal but meaningless letter strings (e.g., Augon). Pseudowords were created automatically by replacing the vowels with other vowels until the string could not be found in the SUBTLEX database any more. Pseudowords were then revised manually based on visual inspection in order to identify illegal letter combinations. Consonant strings (i.e., orthographically illegal strings of letters; e.g. Zbgtn) were formed by replacing all vowels with randomly selected consonants, before also computing OLD20 for each item.
Figure 1a displays the word-likeness (OLD20) distributions of these three groups of letter strings and displays the variability of this word-likeness estimate (compare Supplement 5 for distributions of the same words for alternative word-likeness estimations): Some words like Leben (Life) are more prototypical (i.e., high word-likeness; OLD20 = 1) while others, such as Fazit, even though valid lexical items, are less prototypical (i.e. have lower word-likeness: OLD20 = 2.3; higher values representing less word-like letter strings). Some pseudowords like Mades (base word Modus/mode) are highly similar to existing words (resulting in intermediate word-likeness; OLD20 = 1.6), while most consonants strings are dissimilar to the existing words (low word-likeness for Zbgtn: OLD20 = 2.95). Figure 1a demonstrates that OLD20 distributions of words (grey) and pseudowords (blue) overlap strongly in intermediate familiarity ranges, consistent with the description provided by Balota and Chumbley12. Letter strings with the highest word-likeness are words and expectedly, consonant string non-words (yellow) have lowest levels of word-likeness. Thus, the LCM rests on the assumption that for these items, lexical categorizations (word non-word decisions) can be derived with high certainty while it is difficult at intermediate word-likeness levels.
Given the assumption that lvOT implements lexical categorization to filter out perceived letter strings that are not known, and given the uncertainty associated with this filter function in the face of overlapping distributions at intermediate levels of word-likeness, we propose that the non-linear response profile of lvOT can be described by the information theoretical concept of entropy. Originally, this measure was used to determine the information value of an upcoming event in a time series. For example, in a binary categorization, if at a time point t the received information already allows a perfect categorization, the expected additional information value of t+1 is low (i.e., low entropy). In contrast, if previous information is ambiguous and does not allow a categorization better than chance, the expected additional information at t+1 is high (i.e., high entropy) as this information might be critical for a categorization43. For the present implementation, the previous information is defined by all known words – i.e., by the mental lexicon, here approximated by 3,110 five-letter words as described above. Each perceived letter string – be it a word or a non-word – can be characterized by its word-likeness, which can be quantified relative to the existing lexical knowledge, approximated in the present model by the OLD20 measure. The estimated entropy, then, reflects the uncertainty of the lexical categorization given the word-likeness of the letter string. Note, that these estimations are an approximation, based only on a subset of all possible non-words with five letters (i.e., same number of words, pseudowords, and consonant strings: 3,110), as the total number of possible 5-letter strings would be around 2.5 million, resulting in infeasible high computation efforts.
As displayed in Figure 1b, real words (grey line) most words have a high probability of being categorized as words as words tend to have high word-likeness (Fig. 1a). On the other hand, non-words (blue line) tend to be less word-like and are thus clearly less likely to be categorized as words. As outlined above, the lexical categorization uncertainty is particularly high at intermediate levels of word-likeness. This relationship between word-likeness and lexical categorization uncertainty is captured well by the entropy estimation, represented by the black line in Figure 1b: Entropy is low when the word-likeness estimate allows a certain categorization (as either word or non-word) and high when the word-likeness estimate indicates a large uncertainty concerning the lexical categorization. Of note, the shape of the entropy function over word-likeness strongly resembles the non-linear response profile of lvOT discussed in the Introduction section, so that we here propose as a central postulate of the LCM that neuronal activity in lvOT is driven by the entropy during a lexical categorization that lvOT performs based on the word-likeness of a given letter string. Importantly, this entropy (Ei) function allows to formalize the non-linear activation profile of lvOT:
Equation 1:

The computational implementation of the LCM consists of the entropy function (Figure 1b, black line) derived from the probability (pi) of a letter string i being a word (W) or nonword (nW) given the specific letter string’s OLD20 (log2 indicates a logarithm on the basis of 2).  was derived by (i) taking all letter strings of a given OLD20 (e.g. OLD20 = 1.5; N = 137), (ii) identifying the words, (iii) counting them (n = 116), and (iv) calculating the probability of being a word given the OLD20 value
  is the inverse, i.e., 1 - .85 = .15). The code will be published when accepted.
LCM_Block implementation
In the second version of the LCM we accounted for the task-dependent categorical
predictability of items as words or non-words in a block design as used in fMRI study 1. The increased categorical predictability of the upcoming item in a block should increase the probability of being a word ( ) or non-word
  , depending on task condition, which was
implemented by increasing the word-likeness for words (OLD20words - constant) and reducing word-likeness for non-words (OLD20non-words + constant), after the first item of each block. Importantly, as categorical predictability should not differ between different types of letter strings, the constant was identical for all letter string types. We are currently not aware of systematic investigations of the influence of categorical predictability in a block design on the lvOT activation. As a consequence we had to estimate the effect size of the categorical predictability. We realized this by adjusting the constant, which reflects the effect size of the categorical predictability, so as to obtain an optimal fit of the simulation to the lvOT peak voxel data (Fig. 3c), resulting in a numerical value of the constant of 0.2 (lowest R2 of all tested values from 0.1 to 1 in 0.1 steps). Importantly, the pattern pseudowords>words>consonant strings23 was conserved (but the numeric condition differences varied) for the whole range of investigated values, indicating that the assumption of a categorical predictability influence allows to fit the observed data much better. The latter cannot be taken as granted since the position of the letter strings on the entropy curve determines the condition differences. For example, if both the words and pseudowords were located in the right flank in contrast to the left flank of the entropy curve (see Figure 3e), this procedure would lead to the exact opposite: an increasing activation for word and a decreasing activation for pseudowords. The LCM_Block demonstrates that the LCM provides a framework for systematic investigations of task effects of interest, which might in the future be used to systematically investigate influences of task or stimulus sequences.
, depending on task condition, which was
implemented by increasing the word-likeness for words (OLD20words - constant) and reducing word-likeness for non-words (OLD20non-words + constant), after the first item of each block. Importantly, as categorical predictability should not differ between different types of letter strings, the constant was identical for all letter string types. We are currently not aware of systematic investigations of the influence of categorical predictability in a block design on the lvOT activation. As a consequence we had to estimate the effect size of the categorical predictability. We realized this by adjusting the constant, which reflects the effect size of the categorical predictability, so as to obtain an optimal fit of the simulation to the lvOT peak voxel data (Fig. 3c), resulting in a numerical value of the constant of 0.2 (lowest R2 of all tested values from 0.1 to 1 in 0.1 steps). Importantly, the pattern pseudowords>words>consonant strings23 was conserved (but the numeric condition differences varied) for the whole range of investigated values, indicating that the assumption of a categorical predictability influence allows to fit the observed data much better. The latter cannot be taken as granted since the position of the letter strings on the entropy curve determines the condition differences. For example, if both the words and pseudowords were located in the right flank in contrast to the left flank of the entropy curve (see Figure 3e), this procedure would lead to the exact opposite: an increasing activation for word and a decreasing activation for pseudowords. The LCM_Block demonstrates that the LCM provides a framework for systematic investigations of task effects of interest, which might in the future be used to systematically investigate influences of task or stimulus sequences.
Participants
15, 39, and 31 healthy volunteers (age from 18 to 39) participated in Experiments 1 and 2 of Evaluation 2 (fMRI) and Experiment 1 of Evaluation 3 (EEG), respectively. All had normal reading speed (reading score above 20th percentile estimated by a standardized screening; unpublished adult version of44), report absence of speech difficulties, had no history of neurological diseases, and normal or corrected to normal vision. Participants gave their written informed consent and received student credit or financial compensation (10€/h) as incentive for participating in the experiments. The research was approved by the ethics board of the University of Salzburg (EK-GZ: 20/2014; fMRI studies) and Goethe-University Frankfurt (#2015-229; EEG study).
Materials and stimulus presentation
Evaluation 1
(i) Pseudowords>words contrast was implemented by contrasting LCM simulations of the 3,110 words and 3,110 pseudowords presented in Figure 1a. (ii) Words>consonant strings was implemented by contrasting LCM simulations of the 3,110 words and 3,110 consonant strings presented in Figure 1a. (iii) Pseudohomophones>words and (iv) pseudohomophones=pseudowords contrasts were realized by contrasting LCM simulations of 3,110 words, 3,110 pseudowords, and 52 pseudohomophones (e.g., Taksi), which encompassed all 5-letter pseudohomophones presented by18. (v) Matched pseudowords>matched words were matched on multiple lexical characteristics, i.e., number of syllables, number of Coltheart’s orthographic neighbors, frequency of the highest frequency neighbor, initial bigram frequency, final bigram frequency, and summated bigram frequency (N = 108 vs. 108), as described in the original study reporting this benchmark effect24. (vi) Word similarity effect simulations are realized with three non-word conditions including 332 letter strings with low word similarity, 4,034 letter strings with intermediate word similarity, and 220 letter strings with high word similarity, as well as 267 words. The words and non-words with high word similarity were matched on quadrigram frequency, whereas words and non-words with intermediate word similarity were matched on bigram frequency. Note that we selected the maximum possible number of items in each group in order to realize the match. (vii) The word frequency effect was realized as described in the original benchmark study11, with N = 3,110 words and pseudowords each; the frequency of pseudowords was set to zero. (viii) Bigram frequency effect simulations are realized including 3,110 words, pseudowords, and consonant strings each. LCM predictions of lvOT BOLD signal strength were computed as described above.
Evaluation 2: Experiment 1
90 five-letter words, pseudowords, consonant strings, and words of scrambled letters were presented. In addition, 90 checkerboards and 16 catch trials consisting of hash marks (“#####”) were presented; to which participants responded by a button press and which were excluded from the analysis. Words and pseudowords were matched on characteristics like the OLD20, the number of syllables, and the mean bi-/tri-gram frequency (based on the SUBTLEX frequency database31). In addition, words, pseudowords, and consonant strings were matched on letter frequency. Stimuli were presented using Presentation software (Neurobehavioral Systems Inc., Albany, CA, USA) in black courier new font on a white background for 350 ms (1,000 ms inter-stimulus interval/ISI), in six blocks per stimuli category with 16 items each. After two blocks, a fixation cross was presented for 2 s. In addition, six rest blocks (fixation cross) were interspersed. Each block lasted for 16 s, which resulted in approximately 10 min of recording time.
Evaluation 2: Experiment 2
60 critical five-letter words and pseudowords were presented. In addition, 120 different pseudowords (not analyzed here), 10 practice trials, and 30 catch trials consisting of the German word Taste (Button) were presented. Participants responded to catch trials by a button press; these trials were excluded from the analysis. All words and pseudowords consisted of 2 syllables and were matched on OLD20 and mean bigram frequency. Letter strings were presented by the Experiment Builder software (SR-Research, Ontario, Canada) for 800ms (yellow Courier New font on gray background; ISI 2,150 ms). To facilitate estimation of the hemodynamic response, an asynchrony between the TR (2,250 ms) and the stimulus presentation was established. In addition, 60 null events (fixation cross as in the ISI) were interspersed among trials. The sequence of presentation was determined by a genetic algorithm45, which optimized for maximal statistical power and psychological validity. The fMRI session was divided in 2 runs with a duration of approximately 8 min each.
Evaluation 3
200 five-letter words, 100 pseudowords, and 100 consonant strings were presented. In addition, 10 practice trials and 60 catch trials (detecting the word German Taste; procedure as described for Evaluation 2) were presented. In Evaluation 3, stimulus presentation was optimized to estimate event related potentials. Stimuli were presented on a 19″ CRT monitor with a resolution of 1024 × 768 pixels and a refresh rate of 150Hz. Before stimulus presentation, two black vertical bars on white background were presented for a time interval between 500 and 1,000 ms to reduce stimulus onset expectancies. Next, letter strings were presented by the Experiment Builder software (SR-Research, Ontario, Canada) for 800 ms in a pseudo-randomized order (black on white background, Courier-New font, .3° of visual angle per letter), followed by an 800 ms blank screen and a 1,500 ms hash mark presentation, which marked an interval in which the participants were instructed to blink if necessary. Event related potentials were measured in relation to the stimulus onset. Note that all stimuli including lexical characteristics will be available online.
Data acquisition and analysis
LCM simulations
Statistical comparisons for the simulations presented in Figure 2 were realized with the lm function in R and p-values were Bonferroni-corrected for multiple comparisons. In total, nine benchmark effects were tested of which the contrast pseudowords>words>consonant strings23 was a combination of the pseudowords>words22 and the words>consonant strings2 contrast and therefore p-values were only divided by eight and not by nine. Significant differences were marked in Figure 2 (also realized for alternative models presented in the Supplement 1 and 5 with a black horizontal bar when the direction of the effect was expected from the literature and a red bar when the expected effect direction was violated. Figures 1 and 2 were realized using ggplot2 in R, as were all scatter, bar and box plots of Figure 3 and 4 and the correlation matrix in Figure 4.
fMRI data
A Siemens Magnetom TRIO 3-Tesla scanner (Siemens AG, Erlangen, Germany) equipped with a 12-channel head-coil (Experiment 1) or a 32-channel head-coil (Experiment 2) was used for functional and anatomical image acquisition. The BOLD signal was acquired with a T2*-weighted gradient echo-planar imaging (EPI) sequence (TR = 2250 ms; TE = 30 ms; Flip angle = 70°; Experiment 1: 64 × 64 matrix; FoV = 210 mm; Experiment 2: 86 × 86 matrix; FoV = 192 mm). Thirty-six descending axial slices with a slice thickness of 3 mm and a slice gap of 0.3 mm were acquired within the TR. In addition, for each participant a gradient echo field map (TR = 488 ms; TE 1 = 4.49 ms; TE 2 = 6.95 ms) and a high-resolution structural scan (T1-weighted MPRAGE sequence; 1 × 1 × 1.2 mm) was acquired. Stimulus presentation was realized by a MR-compatible LCD screen (NordicNeuroLab, Bergen, Norway) with a refresh rate of 60 Hz and a resolution of 1024×768 pixels.
SPM8 software (http://www.fil.ion.ucl.ac.uk/spm), running on Matlab 7.6 (Mathworks, Inc., MA, USA), was used for preprocessing and statistical analysis. Functional images were realigned, unwarped, corrected for geometric distortions by use of the FieldMap toolbox, and slice-time corrected. In Experiment 1 the high-resolution structural image was pre-processed and normalized using the VBM8 toolbox (http://dbm.neuro.uni-jena.de/vbm8). The image was segmented into gray matter, white matter and CSF, denoised, and warped into MNI space by registering it to the DARTEL template of the VBM8 toolbox using the high-dimensional DARTEL registration algorithm46. Based on these steps, a skull-stripped version of the structural image was created in native space. The functional images were co-registered to the skull-stripped structural image and then the parameters from the DARTEL registration were used to normalize the functional images to MNI space. In Experiment 2 the images were co-registered to the high-resolution structural image, which was normalized to the MNI T1 template image. The functional images were further resampled to isotropic 3 × 3 × 3 mm voxels in Evaluation 2, Experiment 1, and 2 × 2 × 2 mm voxels in 2, Experiment 2, and smoothed with a 6 mm full width half maximum Gaussian kernel.
For statistical analysis a two-stage mixed effects model was used. The first level is subject–specific and models stimulus onsets with a canonical hemodynamic response function and its temporal derivative. Movement parameters from the realignment step and catch trials were modeled as covariates of no interest. A high-pass filter with a cut off of 128 s was applied to the functional imaging data and an AR(1) model47 corrected for autocorrelation. For the statistical analysis of ROI data, LMMs28 were calculated in R (see below).
EEG data
The EEG of Evaluation 3 was recorded from 64 active Ag/Ag-Cl electrodes mounted according to the 10-20 system on an actiCAP system (BrainProducts, Germany). FCz served as common reference and the EOG was recorded from the outer canthus of each eye as well as from below the left eye. A 64-channel Brainamp (BrainProducts, Germany) amplifier with a 0.1–1000 Hz band pass filter sampled the amplified signal with 500Hz. The impedances of the electrodes were kept below 5kΩ. Offline, the EEG data were re-referenced to the average of all channels. The amplifier registered the stimulus onset time via the parallel port. EEG data were preprocessed using MNE-Python48. Data were high pass filtered at .1 Hz and low pass filtered at 30 Hz. ICA was used to remove ocular artifacts. For each subject, epochs from 0.5 s before to 0.8 s after word onset were analyzed after rejecting trials with extreme (>50uV peak-to-peak variation) values, and baselined by subtracting the pre-stimulus mean. For illustration, ERPs were calculated by averaging within subjects, and then averaging these mean ERPs across subjects. For statistical analysis, multiple regression analysis was conducted and a cluster based permutation test35 was used for significance testing. 1024 label permutations were conducted to estimate the distribution of thresholded clusters of temporo-spatially (across electrode and time) adjacent time points under the null hypothesis to estimate the statistical reliability of effects while correcting for multiple tests. All clusters with a probability of less than an assumed alpha value of 0.05 under this simulated null hypothesis were considered statistically significant.
Linear mixed model (LMM) analysis is a linear regression analysis that is optimized to estimate statistical models with crossed random effects for items28. These analyses result in effect size estimates with confidence intervals (SE) and a t-value. t-values larger than 2 are considered significant since this indicates that the effect size ±2 SE does not include zero49
Author contributions
B.G. and C.F. conceptualized the model and wrote the manuscript. B.G. implemented the model. B.G., F.R. and P.L. designed, conducted, and analyzed the fMRI experiments. B.G. and J.S. designed, conducted, and analyzed the EEG experiment and discussed the entropy implementation.
Supplementary material

Simulated lvOT activation from computational implementations of alternative models to the lexical categorization model. Horizontal black bars in the upper rows of each subplot indicate significant differences of the simulation results between letter string categories, as derived from linear models. Red line indicates the same but the effect was found in the opposite direction as expected from previous evidence. In the following the details of each alternative model will be described, which allow to evaluate the LCM in contrast to alternative models of lvOT function. We implemented three accounts based on the verbal proposals of Kronbichler11,17 (a; lexicon model), Dehaene and Cohen1,9 (b; visual word form area model; which is essentially based on the assumptions from10), and Price and Devlin19 (c; interactive account model). In contrast to the LCM, the lexicon and visual word form area models implemented linear relationships between lvOT activation and the word characteristics that are central to the respective model. The lexicon model conceptualizes the processes implemented in lvOT as a search in an orthographic lexicon. This lexicon is arranged by word frequency; accordingly, frequent words are found fast, resulting in fast response times and low lvOT activation, whereas it takes substantially longer to identify infrequent words, resulting in prolonged response times and high activation. lvOT activation ( cf. Supplementary equation 1) decreases linearly by about 1 activation level (arbitrary unit) per 1 log frequency (
 ) unit (read out from Figure 2: Midfusiform/Posterior fusiform in11;
  : frequency of the letter string, with frequencies of pseudo-and nonwords set to zero11;
  : highest frequency in the lexicon).
Supplementary equation 1:

As shown in in the upper panel of Supplementary Figure 1, the implementation of this model can account for only three out of eight benchmark effects. Specifically, this ‘frequency ordered lexical search’ model obviously accounts for the word frequency effect but also for the lower activation for words in contrast to pseudowords irrespective if they were matched for OLD20 or not (black lines in Suppl. Fig. 1a). For the difference between words and pseudohomophones, the simulation is based on the frequencies of the base words (i.e., the words from which pseudohomophones were generated), predicting reduced activation for pseudohomophones, which is not in correspondence with the literature17. In case one assumes that these letter strings have a frequency of zero (i.e. are not present in the lexicon) the simulation results in the exact same values as for pseudowords. This would be in line with previous studies and would add another correctly simulated benchmark effect for the lexicon search model. None of the benchmark effects including consonant strings or word similarity manipulations (i.e., bigram frequency and word similarity effect) could be captured by this model.
The VWFA model1 postulates that lvOT stores sublexical and lexical multi-letter representations (up to a length of about four letters). When a letter string is presented that contains these multi-letter combinations, their neural representations are activated irrespective of the lexicality of the string. Therefore, higher activations are predicted for often-occurring letter combinations in contrast to rare letter combinations. As formalized in Suppl. Equation 2, this is modeled by a linear increase of 0.4 per log quadrigram frequency (Qfstring). The specific value for this increase function was read out from Figure 4 of10 (left hemisphere, y = -56;).
Supplementary equation 2:

This ‘(sub-) lexical storage/activation’ model of lvOT accounts for only three benchmark tests (Supplementary Fig. 1b), albeit a different set of results: The VWFA model predicts increased activation for words relative to consonant strings, as well as effects of word similarity and bigram frequency. None of the benchmark effects explained by the lexicon model could be explained by the VWFA model and vice versa. Note that the patterns of predictions generated by these two models do not depend on the numeric values chosen for the change in activation, which were read out from the results figures of the original publications. Given that these two models are simple linear transformations of the respective lexical measure, the effect directions would be similar irrespective of which specific constant number would be used to predict lvOT activation in Supplementary Equations 1 and 2.
The interactive account of Price and Devlin19 adopts a predictive coding perspective and postulates that lvOT activation reflects an interaction between top-down and bottom-up processes, in the sense of a prediction error that represents difference between, in the case of single word presentation, non-strategic general expectations derived from general word knowledge and the actual bottom-up visual orthographic input. Here we implement this by assuming bottom-up information as a constant (I = 1) for all strings. This reflects that bottom-up information is, in standard single word presentations, not predictable based on contextual cues. As a consequence this bottom-up information is contrasted to the probability of being a word given a specific word likeness (cf. gray line Fig. 1b;  ), which reflects the probability to be possibly predicted based on general word knowledge. The latter is an approximation of how good such non-strategic predictions might be able to predict the bottom-up signal. For letter strings with very high OLD20 this might be reasonable, but letter strings with a low word likeness cannot sufficiently be predicted, resulting in a high error. In addition, it is a reasonable assumption that this relationship is not strictly linear since predicting a larger number of letter strings might not be neuronal efficient and thus contradict the general assumption of predictive coding models that such prediction processes serve to increase processing efficiency. Therefore, the model is implemented in a way that a small number of highly familiar words can be reasonably predicted while less familiar letter strings are rather not predicted. This is achieved by assuming that the probability of being a word given a specific word likeness of the input string (cf. grey line in Fig. 1b) is subtracted from the constant I representing the bottom-up information (this constant is always one and can be reduced on the basis of which familiarity the letter string is; i.e. if a highly familiar letter string is presented the to be processed information amount is reduced by the amount of which the non-strategic prediction matches the bottom-up information since this is used to optimize the amount of information to be processed; if a unfamiliar string is presented the string cannot be predicted non-strategically and a high activation is predicted since the amount the information can be reduced is low) in the perceived letter string (Supplementary equation 3); the result of this subtraction is equivalent to the blue line of Figure 1b. Note that an implementation based on a linear trend (rather than
  ) would have resulted in similar results as the lexicon search
model presented above.
) would have resulted in similar results as the lexicon search
model presented above.
Supplementary equation 3:

Still this predictive coding model results in a very similar activation pattern as the lexicon model, with the expectation that it cannot capture the empirical observation that pseudohomophones elicit similar lvOT activation as pseudowords17 (Suppl. Fig. 1c). Four out of eight benchmark effects could be accounted for by this implementation.
Additionally, in their proposal, Price and Devlin19 discussed a second process that might influence lvOT function and activation patterns, i.e., that to some letter strings the lvOT is engaged in processing and to others, like consonant strings, not. This assumption was motivated by the fact that the visual word recognition system including lvOT was not trained for such strings during literacy acquisition (i.e., as we only very rarely encounter consonant strings without any vowels). In the first place we had refrained from including this second parameter since the implementation of a further factors allows to describe more complex patterns, which makes the comparison to the less complex single process models introduced above hard. To give an idea of how this additional factor would influence the simulation of benchmark effects, we set the simulated lvOT activation from the model presented above (Supplementary equation 3) to zero for consonant strings. The simulations including this engagement factor result, in contrast to the simulations presented above, in a correct simulation of the words>consonant strings contrast and the word similarity contrast. Nevertheless, this adjusted model still predicts greater activity for pseudowords relative to pseudohomophones and a negative bigram frequency effect, which is not in line with the evidence in the literature.
To summarize, in contrast to the LCM simulations displayed in Figure 2, we learn that only the LCM was able to simulate all tested benchmark effects. Given that the most obvious feature that distinguishes the LCM from the other models pertains to the implementation of the inverted-u shaped entropy function, we here propose that this non-linearity is a key property of the lvOT activation pattern. In addition to these neurocognitive accounts, lvOT processing has previously been related to processing stages or modules that are assumed in prominent visual word recognition models (e.g., see18,22,26). Often, lvOT processing was related to orthographic processing (e.g., by postulating lvOT as the seat of an orthographic lexicon22, similar as in the lexicon account). Most notable is a study by Laszlo and Plaut29, who used a computationally implemented interactive activation model and simulated an orthographic similarity contrast reflected in the N400 amplitude of the EEG (for a summary of similar approaches see30). Relating these very detailed explicit models, which were originally designed to explain behavioral data, to brain activation data, is very complex. This was a motivational factor for us to implement highly descriptive single process models based on neuronal data, as the LCM, instead.

The word frequency effect in lvOT. Two previous studies25,26 reported binary contrasts of groups of high frequent words compared to a groups of low frequent words, and both did not find a reliable lvOT activation difference between the conditions but rather showed effects of word frequency in brain areas, such as the left posterior inferior frontal gyrus. The LCM using words from similar frequency ranges (Fiebach: high = from 1.3 to 2.3, n = 1080, low = from .4 to .9 log frequency, n = 588; Carreiras: High = from 2 to 3, n = 280, Low = smaller than .4, n = 724) also predicted only very subtle activation differences (higher activation for low frequent words in contrast to high frequent words; Supplementary Figure 2). Different from these two studies25,26 the parametric manipulation of Kronbichler et al.11 also showed reliable reduction of lvOT activation with increasing word frequency (see Introduction). Critical to note is that this parametric manipulation has a higher power than both binary contrast from the studies by Carreiras and Fiebach and colleagues, and that both these studies used only words. In contrast, the parametric manipulation of Kronbichler et al. used five levels comparing a group of pseudowords and four groups of words. As shown in the LCM simulations in Figure 2 implementing the parametric manipulation of word frequency by including pseudowords, a frequency effect is predicted for lvOT. Also when pseudowords were excluded, the LCM predicted a negative frequency effect (-0.40 and -0.17, respectively; 43% effect size reduction). Similarly, Kronbichler et al.11 showed a reduction of the frequency effect in lvOT when pseudowords were excluded from analysis (53% effect size reduction, see Table 2 of11). In contrast, only an inferior frontal region showed an increase in effect size when the pseudowords were omitted. This pattern strongly suggests that word frequency is an accurate predictor to the activation in left inferior frontal regions and therefore more likely causally related to the processes in these regions. An obvious candidate process would be lexical access associated with higher level linguistic processing. In contrast, the present proposal and the simulation results presented in this Supplement indicate that the frequency effect in lvOT is much weaker and, therefore, only secondary or correlative to lexical categorization uncertainty. This is also suggested when Evaluation 3 is contrasted to Supplementary figure 4, which indicates that early frequency effects vanish when lexical categorization uncertainty and word-likeness are estimated in the same regression model.

Word-likeness and lexicality effects for fMRI study 1 (Evaluation 2). In the main text, we reported an effect of word likeness in occipito-temporal regions posterior to the wordsensitive lvOT cluster in out second fMRI experiment (event-related single trial design; Fig. 3l). While the blocked design of fMRI study 1 was not primarily designed to demonstrate such stimulus-specific effects, we nevertheless also subjected this data set to an event-related analysis of word-likeness. Word-likeness, modeled as a continues factor, produced a more widespread activation effect in fMRI study 1, distributed over occipital regions of left and right hemisphere, with greater activity for more word-like letter strings (two significant clusters: Cluster 1: peak voxel at x = -12, y = -73, z = 1; Left lingual gyrus; T =7.34; 514 voxels; Cluster 2: peak voxel at x = -6, y = -88, z = 37; Left precuneus; T = 4.0; 67 voxels). From the ventral view of the left hemisphere it is visible that the cluster extended into the posterior lvOT, which is not the case in the right hemisphere (Activation effects are visualized at voxel level p< .001 uncorrected; cluster level p< .05 family-wise error corrected). In addition, we tested the words>pseudowords contrast: no significant activation difference between words and pseudowords was found. Only when neglecting the cluster correction, a small activation cluster was found in left frontal cortex (x = -39, y = 38, z = 25; Left frontal pole; T = 3.7; 7 voxel). To summarize, consistent with the second fMRI experiment, an effect of word-likeness on brain activation was found posterior to lvOT, while the (weak) lexicality effect was observed anterior to lvOT, i.e., in downstream regions of the frontal lobe.

Effect sizes and respective significant activation clusters from a regression model including only one predictor, i.e., word frequency. While our EEG study (Evaluation 3) resulted in a relatively late effect of word frequency (i.e., between 400 and 600 ms post word onset; cf. Fig. 3i,j), some previous publications have reported frequency effects earlier in the course of the ERP elicited by visually presented words (see33 for a summary of evidence). We hypothesized that such early word frequency effects are the result of the fact that word frequency is correlated with other important predictor variables such as lexicality or OLD20, which may be processed in the brain earlier in time. In contrast, our ERP analysis involved a multiple regression model that takes into account multiple relevant predictors, which we postulate as the cause of the late word frequency effect. As a consequence, we predict that also in our data set, word frequency effects should appear earlier in time when modeled separately. Supplementary Figure 4 shows effect sizes and respective significant activation clusters form a regression model only including word frequency. As predicted, a significant word frequency effect is found in this analysis already around 200 ms, lasting at least until 800 ms post word onset. Contrasting this regression analysis to the model we report in the main text (Fig. 4) indicates that this early frequency effects can be better explained by word-likeness and lexical categorization uncertainty derived from the LCM, and therefore vanishes when all these predictors are included.

LCM implementations on the basis of three alternative word-likeness measures, plus the simulations of benchmark effects from the literature (Evaluation 1). In the main text, we report an implementation of the LCM using OLD2020 as a measure of word likeness that has been reported in the literature to outperform other measures of word likeness REF. However, it is also possible to implement the LCM based on alternative measures of word-likeness. Here, we report three simulations of the benchmark effects tested in Evaluation 1 (cf. Figure 2), using (a) Coltheart’s neighbors, (b) trigram frequency, and (c) quadrigram frequency, as bases for the LCM simulations. The left-most columns show the distributions of the respective word-likeness measure for different types of letter strings as we well as the probabilities of being a word or not and the resulting entropy (categorization uncertainty), analogous to Figure 1 in the main text. It is visible that all three measures are less well able to distinguish between words, pseudowords, and consonant strings than OLD20 (Fig. 1a) does. As a result, the resulting entropy function has a different shape than the one derived from OLD20. The LCM implementation based on OLD20 (Figure 1 and 2) clearly outperformed (in terms of correctly predicted effects and estimated effect sizes) these models based on alternative word-likeness measures. When inspecting the pseudoword>words22 contrast, only the model based on Coltheart’s N (Suppl. Fig. 5a) was able to predict this difference; on the other hand, this was the only model that did not predict the contrast words>consonant strings2. For description of labels see Figure 1 and 2.

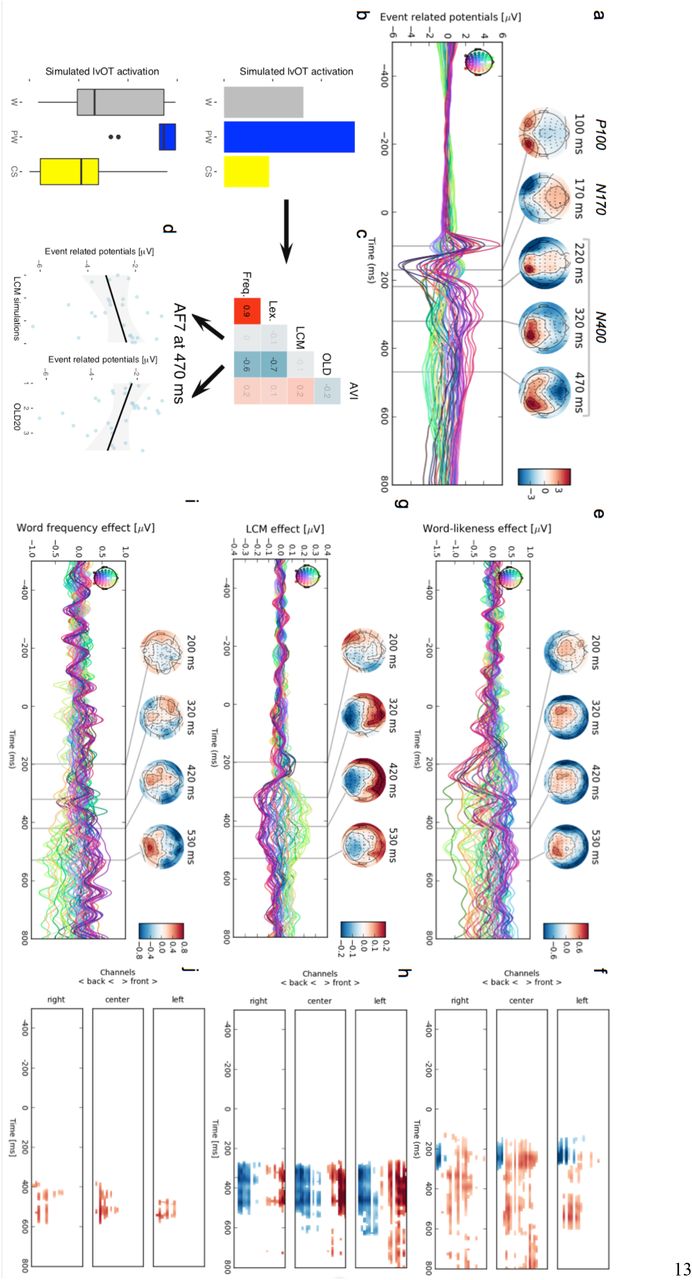
Effect of lexicon size on word-likeness estimations and LCM simulations. We assumed that lexicon size influences word-likeness estimations (i.e. the number of items in the lexicon to which e.g. the OLD20 is estimated to influences the OLD20 estimation) and LCM simulations. First, word-likeness distributions for words, pseudowords, and consonant strings, which were used for the LCM model (see Fig 1 & 2; see Materials section), are presented for lexica consisting of the most frequent 100, 1,000, 10,000 and 100,000 words of the SUBTLEX database. When comparing the word-likeness distributions, it becomes obvious that increasing the size of the lexicon results in a better differentiation between letter string categories (e.g., stronger differentiation between words and consonant strings). Simulations from LCM models derived from these distributions (compare to Figure 1 & Supplement Figure 5), in the lower panels (line graphs show median LCM simulated activation), showed that the model predicted no difference between categories with very small lexicons. Lexicons with intermediate size already allow a differentiation between consonant strings (yellow) and the other stimulus categories. Starting from lexicons with 10,000 words, clearer differentiation between words (gray) and pseudowords (blue)/pseudohomophones (green) was present. In part, besides established effects such as acquired letter knowledge or grapheme to phoneme conversion (for example22), these simulations demonstrate that the increasing lexicon size may account for critical patterns of developmental change during literacy acquisition; our present work, in this context, suggests that the lvOT may be an important mediator of such developmental processes.
Acknowledgements
We thank Sophia Haan, Anne Hoffmann, Caroline Peters, Julia Krebs, and Kirsten Hilger for help with EEG data acquisition and Benjamin Peters for help with the entropy formulation. In addition, we thank Susanne Eisenhauer and Sophia Haan for helpful comments on a previous version of the manuscript. This research was supported by the European Comission: ERC-2013-CoG and Marie Curie Fellowship Nr. 707932.
References


