

Abstract
Recent efforts have aimed to characterize clinical pediatric populations by using neurophysiological tests in addition to behavioral assays. Here we report on a data collection effort in which electroencephalography (EEG) was recorded in both juveniles and adults (N=114 participants, ages 6-44 years of age) during various stimulation protocols. The present analysis focuses on how neural responses during passive viewing of naturalistic videos vary with age and sex, and in particular, how similar they are within developmental groups. Similarity of neural responses was measured as the inter-subject correlation of the EEG. Stimulus-evoked neural responses are more similar among children and decrease in similarity with age. Among children, males respond more similarly to each other than females. This was uniformly true for a variety of videos. The decrease in group similarity with age may result from an overall decline in the magnitude of evoked responses, but this cannot explain the sex differences found in the young. We therefore propose that as children mature, neural function may become more variable.
Introduction
There is considerable debate regarding how the variability of neural responses changes throughout development (Dinstein et al. 2015; Grady 2012). Behavioral data indicate that, relative to adults, children demonstrate a higher level of behavioral inconsistency in response times and trial-to-trial variability (Dykiert et al. 2012). Similarly, when watching videos, younger children appear to exhibit more variable eye gaze patterns (Kirkorian, Anderson, and Keen 2012). Intuitively, one might expect that children also exhibit more variable neural responses that converge during development. However, recent experimental evidence suggests that while neural immaturity is associated with highly systematic neural responses both within and across subjects, age is associated with increased variability.
Several approaches have been used to study changes in the variability of neural responses associated with development. Examining intra-individual variability is among the most common. For example, McIntosh et al. (McIntosh, Kovacevic, and Itier 2008) found that adults have more intra-individual variability in their electroencephalographic (EEG) responses during a facial recognition task than children (ages 8-15). Interestingly, higher neural variability was associated with lower reaction time variability and higher recognition accuracy. Papenberg et al. (Papenberg et al. 2013) have a somewhat contradictory finding in which theta band coherence increases from childhood to early adulthood as reaction time and performance fluctuations decrease.
The complexity of the temporal pattern of neural responses has also been utilized to examine developmental changes. Anokhi et al. (Anokhin et al. 2000) found that during verbal and spatial cognitive tasks EEG signal complexity increases from 7 to 16 years of age. Vakorin et al. (V. A. Vakorin, Lippe, and McIntosh 2011) related an increase in neural response complexity to integration between distributed neural populations. Vakorin et al (Vasily A. Vakorin et al. 2013) conducted a longitudinal study looking at “dynamical non-stationarity” in the EEG signal, essentially measuring the stability of oscillatory patterns. As adolescents matured over a period of about 18 months, their EEGs became more non-stationary since both the number of stationary states increased and the duration spent in each stationary state increased.
Recent functional magnetic resonance imaging (fMRI) studies have measured variability across subjects, instead of within individuals, thereby assessing similarity across a developmental group. Using voices, natural sounds, and tones, Bonte et al. (Bonte et al. 2013) showed that adults elicit more variable responses in the right superior temporal sulcus than adolescents and children. Cantlon et al. (Cantlon et al. 2013), using Sesame Street videos as stimuli, found that many parietal and frontal regions had higher cross-subject correlation among adults than among children. However, they also identified a region in the temporal cortex that responded more similarly among children than adults. Hutchison and Morton (Hutchison and Morton 2015) found that during rest, although adults exhibit higher variability in functional connectivity strength in the majority of the cortex, children exhibit greater inter-network correlation variability in the auditory, somatomotor, and default networks. Conversely, during tasks, adults show less variability in functional connectivity relationships relative to children (Hutchison and Morton 2015). Finally, much later in development, Campbell et al (Campbell et al. 2015) found that intersubject correlation while watching movies declines with age from ages 18-88. Taken together, these studies demonstrate that neural variability changes with development. The trajectory of this change depends on multiple factors including the specific metric of neural variability used, the conditions under which the metric was measured, the developmental stage sampled, the brain region(s) of interest, and the research modality used. Overall, these studies support the idea that neural variability both underlies consistent and uniform behavioral responses, and that neural variability is associated with maturation.
Here, EEG was recorded from subjects responding to naturalistic (Dmochowski et al. 2012; Dmochowski et al. 2014) and artificial stimuli to assess the similarity of their neural response. We focus on the basic developmental characteristics of age and sex to shed light on the ongoing debate about neural variability during development. As age increases, we found that neural responses to stimuli become more variable (i.e. less similar) across individuals while evoked response magnitudes remained unchanged. Additionally, among children, females respond less similarly than males. These sex differences are consistent with the idea that males are less neurally mature than females (Lenroot et al. 2007; Marsh et al. 2008). More broadly, the results are consistent with theories positing that development coincides with an increased repertoire of neural representations (McIntosh, Kovacevic, and Itier 2008). Importantly, this is the first EEG study to report a measure of across-subject neural similarity with clear age and sex effects.
Methods
Subjects
Adults and minors were recruited at the Child Mind Institute through a combination of web-based, newspaper, and in-house advertisements. Ages ranged from 6 to 44 years old (see Figure S1 for a full age distribution). Subjects over 18 years of age signed an informed consent. Subjects younger than 18 had written informed consent from their parents. The study was reviewed and approved by the Child Mind Institute IRB. All subjects presented with normal or corrected to normal vision.
Procedure
While seated in a dimly lit room wearing an EEG net, subjects watched a series of short videos in a pseudorandom order. Video clips included short segments of Hollywood feature films, three educational videos, and two control conditions (Rest and Flash). See screenshots in Figure 1. One of the Hollywood videos was a clip from the cartoon Despicable Me (DesMe, Universal Pictures), which contains infant and toddler characters (duration 2m 51s). The other Hollywood video was the trailer of Diary of a Wimpy Kid (Wimpy, Universal Pictures), a movie about a preteen starting middle school (duration 1m 57s). The educational math movies were 1) Fun with Fractals (Fract, MIT), a cartoon that explains fractals with several graphic examples (duration 4m 34s), 2) How to improve at Simple Arithmetic (Arith, E-How), in which a math teacher in a typical educational setting explains addition and multiplication (duration 1m 30s), and 3) a segment of the video Pre-Algebra Class (Pearson Education) showing the interaction of two students and a teacher (StudT, for student-teacher interaction) during math problem solving (duration 1m 40s). The control conditions were Flash and Rest. Flash consisted of a black and white grading pattern on the screen that flashed at 25 Hz and was presented for 3 minutes. This stimulus elicits steady state evoked potentials (Vanegas et al. 2015) and was included to explore whether ISC is driven by low level evoked responses. Rest consisted of a period of rest with eyes-closed, 4m 20s in length. This period establishes the baseline level of the ISC expected by chance when subjects are not attending to the same stimulus or engaged in the same task. A link to all of the videos is provided in the supplementary materials section. Note that not all stimuli could be shown to all subjects due to time limitations of the overall data collection effort as it contained several additional stimuli and tasks. Additionally, as explained below, poor data quality for some recordings caused additional data loss. The number of total recordings (and useful recordings) were: Wimpy: 71 (58); DesMe: 94 (68); Fract: 94 (66); Arith: 99 (69); StudT: 92 (65); Flash: 100 (74); Rest: 107 (46). The exact number of available recordings for each stimulus and each subjects category is reported in Figure 3.

Stimuli. The three top panels show screen captures of the educational videos. The lower left and lower central panels show the two Hollywood videos (the Diary of a Wimpy Kid trailer and Despicable Me clip, respectively). The lower right panel corresponds to a flashing screen.
EEG recordings and preprocessing
EEG recordings were performed with an EGI Clinical Geodesic 128 channel system (Electrical Geodesic Inc, Eugene, OR). Of the 128 channels, 109 constituted the EEG recording and 6 represented EOG channels used for eye movement artifact removal. The remaining channels, mainly recording from the neck and face, were discarded. Recordings were initially sampled at 500 Hz, downsampled offline to 125 Hz, high-pass filtered at 1 Hz, and notch filtered between 59 and 61 Hz with a 4th-order Butterworth filter. Eye artifacts were removed by linearly regressing the EOG channels from the scalp EEG channels (Parra et al. 2005). Next, a robust Principal Components Analysis (PCA) algorithm, the inexact Augmented Lagrange Multipliers Method (Lin, Chen, and Ma 2010), was used to removed sparse outliers from the data following Ki et al (Ki, Kelly, and Parra 2016). Briefly, robust PCA recovers a low-rank matrix, A, from a corrupted data matrix D = A + E, where some entries of the additive errors E may be arbitrarily large. Subsequently, noisy channels were selected by visual inspection and replaced with by zero valued samples, thus eliminating that channel’s contribution in subsequent calculations of covariance matrices. Finally, individual recordings from some stimuli were discarded on the basis of visual inspection because they remained noisy after both automatic and manual noise removal. This was necessary because subjects exhibited profound movement artifacts and/or the saline used for the recordings dried out. All signal processing was performed offline using MATLAB software (MathWorks, Natick, MA, USA).
Inter-Subject Correlation (ISC)
To determine the neural similarity across subjects responding to the same stimulus, the inter-subject correlation (ISC) of the EEG signal was computed, as described in previously (Dmochowski et al. 2012; Dmochowski et al. 2014; Ki, Kelly, and Parra 2016). ISC assesses the level of correlation among a group of subjects. Larger ISC values imply more similarity in EEG signals across subjects, thus indicating that the signals are more reliable due to decreased inter-subject variability. An advantage of the technique is that the stimulus need only be presented once to each subject since evoked responses are compared across individuals. Since repeated renditions are unnecessary, stimulation is more akin to natural situations in which people experience uniquely presented novel stimuli. Additionally, in contrast to event related potentials, the technique can be applied to continuous and dynamic natural stimuli without the need for specific event markers (Ben-Yakov et al. 2012; Fontanini and Katz 2008). ISC utilizes correlated component analysis to identify linear combinations of EEG electrodes (i.e. components) that capture most of the correlation across subjects (Dmochowski et al. 2012). Correlated component analysis is similar to principal component analysis (PCA) except that rather than maximizing variance within one dataset, it selects projections that maximize the correlation between two datasets. The following description of the method mostly follows Ki et al. (Ki, Kelly, and Parra 2016).
In order to estimate the components that maximize correlation, two matrices are calculated, the pooled between-subject cross-covariance,
 and the pooled within-subject covariance,
 where
where
 measures the cross-covariance of all electrodes in subject k with all electrodes in subject l. Vector xk(t) is the scalp voltages at time t in subject k, and
  their mean value over time, and “T” indicates the transpose of a vector. The eigenvectors vi of matrix
  with the largest eigenvalues provide projections of the data (components) that capture the largest correlation between subjects (ISC). Ci measures the strength of correlation in the i-th component:

Between- and within-subject covariance matrices were computed separately for each of the subject groups (all subjects watched each video in Figure 2; groups: young children and adolescents/adults, and males and females, presented in Figures 3, 4 and 6). Here covariance matrices are averaged across all stimuli. Thus, while every group has a different set of component projections vectors vi with which ISC can be measured, these projection vectors are the same for all stimuli. To measure how each individual’s EEG responses compare to the group, correlation is computed between a given subject, k, and all others in the group:
 using the following definitions for the between subject covariance
 and within-subject covariance
 which are symmetrized to ensure proper normalization for correlation coefficient calculation. Covariances are therefore measured separately for each stimulus and for each subject so that an ISC value is calculated for each stimulus and subject. Finally, the intersubject correlation (ISC) for each subject k is defined as the sum of correlation across components:


ISC decreases with age. ISC is computed for each individual by correlating responses from individual subjects to those from all other subjects (regardless of age and sex). Note that for every stimulus a different number of subjects was available.

ISC is consistently higher among younger ages and males. Here ISC is computed separately within different age and gender groups (Left: The number of subjects in each age group for each movie are: 6, 14; 37, 28; 37, 31; 37, 29; 39, 30; 44, 30; 24, 22. Right: The number of subjects in each gender group for each movie are: 16, 12; 23, 14; 23, 14; 21, 16; 26, 13; 30, 14; 18, 6).

Sex differences in the young disappear with age. Young males are more similar to each other than young girls. A sex difference is absent in the older group. Here, ISC is computed within each sex and age group separately and averaged across all stimuli (excluding Rest). Black line indicates the median.
In practice we limit this sum to the first three components, following previous research (Dmochowski et al. 2012; Dmochowski et al. 2014; Ki, Kelly, and Parra 2016). In summary, projections vectors vi are computed for each group of subjects, combining data for all stimuli. These are then used to measure ISC separately for each subject and each stimulus.
Forward model for correlated components
To visualize the spatial distribution of evoked responses (Figure 6) corresponding to each component vector vi, the “forward model” is computed (Parra et al. 2005; Haufe et al. 2014). These are sometimes also known as “scalp projections”. The forward model can be computed simultaneously for all component vectors by arranging them as columns in matrix V, thus yielding forward models ai in the columns of matrix A:

Finally, it should be noted that when computing eigenvectors vi, the within-subject covariance matrix was regularized using shrinkage (Rw ← (1 − γ)Rw + γλI Blankertz et al. 2011), where is the mean eigenvalue of Rw, and the regularization parameter = 0.5 (0 represents no regularization and 1 represents the strongest regularization). Shrinkage is not used when computing Cik or A. A simplified template for the code to compute correlated components, ISC and the forward models is available at http://bme.ccny.cuny.edu/faculty/lparra/isc/isc_template.m
Steady state visual evoked potentials (SSVEP)
To determine the strength of evoked responses, we leveraged the SSVEP paradigm that was part of the experimental battery (Flash). Stimulus and analysis followed standard techniques (Vanegas et al. 2015). Briefly, the stimulus consisted of circular gratings flashing at 25 Hz in the foreground with a static background grading (Figure 1 bottom right). This was presented in trials of 2.4 s duration with intertrial intervals of 1s which included a fixation cross present for 0.5 s. The stimuli were presented in several conditions that varied in their contrast and in the phase relationship between the foreground and the background. A total of 128 trials were present (12 conditions total: four foreground contrasts −0% 30%, 60% and 100%, and three surround conditions - parallel phase, orthogonal phase, and no surround stimuli). Trials were removed if the power in any electrode exceeded more than three standard deviations above the mean. EOG activity was regressed out of the EEG, as described above. The initial 200ms of each trial was removed to eliminate the onset visual evoked response from the data. Data were Fourier transformed for each trial and power in the 25 Hz band and then responses were averaged across all trials, regardless of condition (thus ignoring details of the flicker/background interactions for this analysis). As the EEG activity measured with this paradigm is known to be dominated by primary visual cortex (V1) responses, power was averaged over the five most relevant occipital electrodes (O1-O5; Vanegas et al. 2015). Note that the ISC calculation for the Flash stimulus used the entire signal including pauses and onsets of visual evoked responses.
Statistical analysis
A one-way ANOVA was performed to compare ISC levels across the six stimuli (five videos clips and Flash) and the control condition (Rest). Another one-way ANOVA, excluding Rest, was performed to test potential differences between stimuli. Tukey post-hoc tests were used for comparisons between pairs of videos. To explore the association between neural similarity and age, linear correlations across subjects were performed which compared ISC and age for each stimulus/condition (Figure 3). For this analysis, ISC was computed using the correlated activity across all subjects, regardless of condition. ISC was also computed within each age age and sex group (Figure 3). Age groups were created so that the sample sizes were balanced sample size in each group (median split). This resulted in two groups whose ages ranged either between 6 and 14 (average N across stimuli: 22.7) or between 15 and 44 (average N across stimuli = 25.1). The size of the sex groups was determined by data quality (average male N across stimuli: 33.4, average female N across stimuli: 19.7). The mean age of the male and female group did not significantly differ (males = 12.47 y.o., females = 12.40 y.o., t(56) = 0.07, p = 0.94). The age range for the older group is much larger than that of the younger group, and does not align well with developmental age categories. However, since the older age group was more thinly sampled (Figure S1), it did not have enough statistical power to be parcellated into smaller subgroups. Group comparisons and interactions were tested with a two-way ANOVA with ‘age’ and ‘sex’ as factor (Figure 4). Here ISC within each group represented the ISC averaged across stimuli (Figure 4). A similar analysis was performed for the SSVEP strength (Figure 5). Unfortunately, it was untenable to utilize SSVEP magnitude as an additional explanatory variable for ISC effects due to the limited number of subjects for which both stimuli are available.
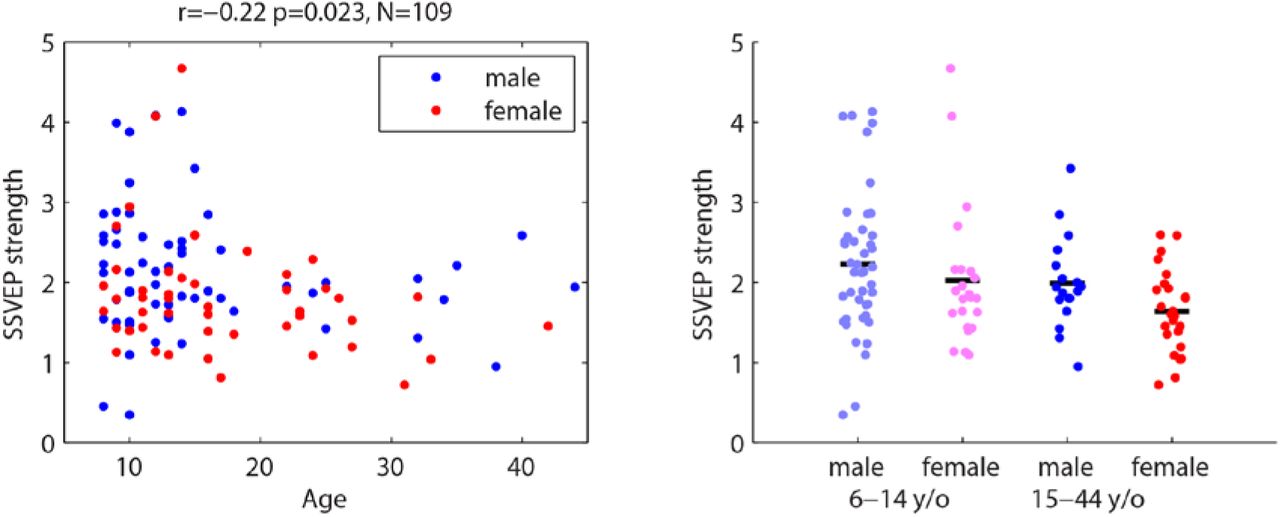
Dependence of SSVEP magnitude on age and sex.
Results
EEG data was recorded from 114 subjects, ranging in age from 6 to 44 y/o (Figure S1, mean and standard deviation, 14.2 +/- 8.0, 46 females). The sample focused on children (under age 18) and included an additional small small number of adults. Five video clips were selected to include a variety of everyday-life experiences such as those found in popular media or encountered in the classroom (Figure 1). As a control stimuli, an artificial visual stimulus that elicits steady-state visual evoked potentials (Flash) and resting state activity (Rest) were included. This data was gathered from a larger EEG data collection effort which employed a broader range of stimuli. Inter-Subject Correlation (ISC) was utilized to measure the similarity of responses evoked by the dynamic naturalistic stimuli (Hasson et al. 2004; Dmochowski et al. 2012; Ki, Kelly, and Parra 2016). Importantly, measuring ISC in the EEG does not rely on a priori regions of interest, instead this method combines evoked responses across electrodes which maximize correlation across subjects.
Intersubject correlation differs as a function of stimulus
ISC components were first computed across all subjects and all stimuli. Using these components, ISC values for individual subjects and stimuli were computed. A one-way ANOVA with stimulus as factor revealed that the similarity of EEG responses, as measured by ISC, depends on the stimulus (F(7) = 78.26, p = 10−68; mean ISC values, Wimpy: 0.0527; DesMe: 0.0352; Arith: 0.0193; Fract: 0.0260; StudT: 0.0124; Flash: 0.0299; Rest: 0.0006). As expected, ISC in the Rest condition was not significantly different from zero (t-test, t(45) = 0.52, p = 0.38). This confirms the notion that ISC reflects stimulus-induced correlations. During Rest, since no stimulus is driving brain activity, thus synchronizing it across subjects, this conditions provides an estimate of the ISC levels that are obtained by chance. A second one-way ANOVA was performed without the Rest condition to confirm that ISC level depended on the stimulus presented (F(6) = 71.70, p = 10−55).
ISC was notably stronger when evoked by the Hollywood stimuli (Wimpy and DesMe), than it was for the educational clips (Arith, Fract, StudT), which appear to drive brain responses less vigorously (Tukey post-hoc pair-wise comparisons between each pair of videos, p < 10−4). Among the Hollywood videos, Wimpy, a movie trailer for the feature film “Diary of a Wimpy Kid”, evoked a higher level of neural similarity than DesMe, a scene from the animated film “Despicable Me” (p = 10−7). Among the educational videos, Fract had the highest ISC. However, it was only significantly higher than StudT (p = 10−6). Interestingly, Arith had a level of ISC similar to Flash (p = 0.5). Although both clips had higher ISC than StudT, only Flash had significantly higher ISC (p=10−7).
Intersubject correlation decreases with age
To examine how neural similarity changes with age, the ISC and age of individual subjects is compared (Figure 2). Here, ISC is computed in individuals by measuring the extent to which each subject correlates with the others. There was a negative correlation between age and ISC for all stimuli (videos and Flash, r=-0.68 +/- 0.09, all p<10−6). However, as expected, age and ISC were not significantly correlated during Rest, the control condition (r = −0.10, p = 0.5, N = 46, not shown). The algorithm that measures ISC systematically optimizes correlation between all subjects. However, since the sample used here is dominated with younger subjects, it was necessary to rule out the possibility that ISC’s correlation with age did not result from a training bias in this optimization. The sample was therefore separated by age into two groups (ages 6-14 and 15-44), and ISC was again computed within each group (A). A two-way ANOVA with factors of age and stimulus was performed using the ISC values from each subject for each stimulus (excluding Rest). There was a highly significant main effect for stimulus (F(5) = 63.64, p = 10−47), and a significant main effect for age (F(1) = 335.46, p = 10−53). To determine whether ISC also decreases within each age category, the correlation between age and ISC was examined separately for each group (ISC measured between all subjects as in Figure 2).
For the younger group (6-14 y/o), there is no correlation (r=-0.11 +/- 0.2, p>0.2, except p=0.01 for Flash). However, there is a negative correlation between age and ISC for the older group (15-44 y/o, r=-0.59 +/- 0.17, all p<0.0005, except p=0.04 for Arith and StudT). This suggests that changes in neural similarity start occurring in later teenage years. However, we cannot identify a more specific transition period from poor sampling in this age range.
Intersubject correlation is higher in young males, but this sex difference disappears in adults
When ISC is computed either only among females or males, a difference in ISC was observed. Specifically, a two-way ANOVA with factors of sex and stimulus showed a main effect for sex (F(1)=25.98, p = 10−7). ISC levels were consistently higher in males for all stimuli except for Wimpy which was marginally significant (Wimpy: t(56) = 1.95, p = 0.056; DesMe: t(63) = 5.29, p = 10−6; Arith: t(66) = 3.09, p = 0.003; Fract: t(64) = 4.16, p = 10−5; StudT: t(67) = 4.36, p = 10−5; Flash: t(72) = 2.00, p = 0.049). There is a general agreement that young females are more mature than young males, particularly immediately before adolescence (Marsh et al, 2008, Lenroot et al. 2007, Mous et al. 2016). To examine whether the sex difference depended on age, the data was separated into four groups (“6-14 y/o male”, “6-14 y/o female”, “15-44 y/o male”, “15-44 y/o female”, where between ages 14/15 years was used as the age boundary to balance sample sizes). ISC was measured within each group and averaged across all stimuli (including Flash) to assure sufficiently large samples (). A two-way ANOVA with sex and age as factors confirmed that the difference in ISC among younger males and females disappears with the onset of adulthood (F(1) = 17.32, p = 10−5).
Age related decrease in ISC may result from reduced evoked response magnitude, but this does not explain sex differences
It has been established that evoked responses change with age (see Discussion). The present results may therefore arise from the previously documented reduction in evoked response magnitude with age. Correlation, as measured by ISC, is in principle independent of the magnitude of the signal. However, if the signal’s magnitude decreases in the presence of persistent “background noise,” neural activity would become more variable due to lower signal-to-noise ratio and ISC would decline. Evoked responses cannot be measured for the natural dynamic stimuli used here since they are typically measured using the average across repeated events. However, the control stimulus (Flash) elicits steady-state visually evoked potentials (SSVEP) from which the magnitude can be measured (see Methods). SSVEP magnitude was therefore analyzed as a function of age and sex (). It declines weakly with age (r=−0.22, p=0.023, N=109, Figure 5A). A two-way ANOVA with age and sex as factors (Figure 5B) confirms the age effect (F(1)=4.0, p=0.048), however it is not significantly different between the sexes (F(1)=3.3, p=0.07). Additionally, there is no interaction between age and sex (F(1)=0.23, p=0.6), as was observed for ISC (compare Figure 5B with Figure 4). In summary, although the strong age effect seen for ISC is weakly replicated by the SSVEP magnitude, the sex difference pattern (i.e. sex difference in the young, but not in adults) is not.
ISC component topographies were similar for different age and sex groups
Changes in the level similarity among brain responses could potentially be reflected in topographic changes in the dominant scalp potentials. We thus computed the “forward model”, i.e. the potential distribution corresponding to each of the three components used to measure ISC (). The component topographies are very similar across groups for the first two components that dominate the ISC (component 1 = 0.016, component 2 =0.008, and component 3 =0.0043, computed as in Figure 2 and averaged across all subjects). Components 1 and 2 are much larger than Component 3. Despite the fact that these correlation values are small, they are reliably reproduced and thus significantly above chance (captured by the Rest condition; see Figure 3). This suggests that the differences in the similarity of brain responses across subjects with age and sex are not due to differences in the spatial distribution of neural activity across these demographic groups.
Discussion
Neural reliability was measured in subjects with ages ranging from 6 to 44 to examine age and sex related differences during development. Inter-subject correlation (ISC) was used to examine neural reliability of EEG responses during the processing of complex naturalistic stimuli. ISC significantly correlated with age for both naturalistic videos and artificial visual flashes. Additionally, younger subjects (6-14 y/o) exhibited less variable neural responses than older subjects (15-44 y/o).
Interestingly, the correlation between age and ISC was driven by the older subject group, suggesting that the onset of decline in ISC starts during late adolescence. A parallel finding revealed that young males exhibited more similar responses to the stimuli than young females, a difference which is only present in the younger cohort. These age and sex effects may be developmental effects, consistent with the notion that neural maturation occurs later in males than females during development (Lenroot et al. 2007; Marsh et al. 2008). Finally, a qualitative analysis of the spatial distribution of the correlated activity revealed that the observed age and sex differences are largely driven by the same neural components.
A possible confound for the present results is that the neural correlations found across subjects are due to correlations in overt behaviors such as eye movements. However, it is unlikely that eye movements follow a similar developmental trajectory as neural responses do because it has been shown that eye movement patterns during videos become more similar with age (Kirkorian, Anderson, and Keen 2012). Thus, although the gaze patterns evoked by videos seem to converge with maturity, potentially driving similar bottom-up neural processes, neural similarity as measured by ISC, decreases with age. Furthermore, even in the condition where subjects were instructed to maintain a fixed gaze position (Flash), ISC decreased with age.
The observed ISC magnitude changes may also be partially dependent on evoked response magnitudes which are known to decrease with age. Maturity is typically accompanied by a reduction in the magnitude of evoked responses such as auditory event related potentials (Goodin et al. 1978) and the N1 and N2 components (Tomé et al. 2015). However, this is not uniformly true, for instance, the magnitude of the P300 increases until 20 years of age and declines in older ages (van Dinteren et al. 2014). Although correlation, as measured by ISC is, in principle insensitive to magnitude, it is possible that the weaker stimulus evoked responses in adults are overpowered by ongoing neural activity that is not stimulus related (i.e., “noise”). In this case, a smaller fraction of the variance in the signal would correlate across adult subjects. The Flash stimulus was used as a metric to assess the possibility that evoked responses decrease with age as ISC does. Steady state visual evoked potentials (SSVEPs) do weakly decline with age, however, they do not differ by sex. The SSVEP differences are not as strong as those found with ISC, nor do they explain the sex difference pattern among younger subjects. Since SSVEPs are generated by the early visual processing areas in V1, it likely does not capture higher-level or longer latency evoked responses (e.g. P300, N400 etc) or responses evoked by complex naturalistic stimuli. The ISC is likely driven by higher level cortical areas since the spatial distributions of the two dominant components (Figure 6) do not resemble low-level sensory evoked responses. Parallel work indicates that the first component (C1), which captures the majority of the correlated activity, is a supramodal component driven by both auditory and visual stimuli (Cohen, in review).

Spatial distributions corresponding to the three strongest correlated component (C1 - C3). Red and blue colors indicate positive and negative potentials respectively and also indicate positive and negative correlation of the voltages on the scalp surface with the component activity. These maps are also known as “forward models” or “scalp projections”. They are unitless due to an arbitrary scale on the projection vectors. Here, the projections have been computed separately for the combination of the two sex and age groups.
It is also possible that ISC decreases with age because adults process stimuli with more complex and multifaceted responses. In this view, adults have more highly variable responses and thier neural activity is therefore less similar across subjects. In this case, it would be likely that the dimensionality of neural responses increases with age. Age-related increases in the complexity of temporal patterns of EEG activity have been found previously (Anokhin et al. 2000; McIntosh, Kovacevic, and Itier 2008; Vasily A. Vakorin et al. 2013). To examine this, the dimensionality of the broad-band evoked responses was analyzed (See supplementary material). However, older participants did not have more diverse spatial patterns, but rather, exhibited decreased overall power (the highest power was found in both younger subjects and males, Figure S2). This age difference is true for all stimuli and is not present during Rest (Figure S3).
The related literature regarding developmental changes in oscillatory power is mixed. While most studies in children report a decrease in power with age for most frequency bands (Gasser et al. 1988; Harmony et al. 1990; Clarke et al. 2001), some studies report an increase in power in selective frequency bands, e.g. alpha band (Benninger, Matthis, and Scheffner 1984) or gamma band (Uhlhaas et al. 2009). Our data suggest that these differences may relate to whether activity was recorded during rest or during a task or stimulus. For the present case we conclude that the mature brain may require less resources to process a natural stimulus. This finding may underlie the weaker and more divergent neural patterns found in the ISC of older brains.
The idea that maturity is marked by variability is not new (e.g. Campbell et al. 2015). It aligns with theories from neural systems modeling and human studies (McIntosh, Kovacevic, and Itier 2008; V. A. Vakorin, Lippe, and McIntosh 2011). In these models, moderate amounts of noise or variability facilitate efficient responses in complex environments. Increased variability may be the reason for reduced evoked response magnitudes since event related potentials are obtained by averaging across many events that are inherently sensitive to signal noise. It is therefore possible that the increased variability of evoked responses across trials with age results in reduced ERP magnitudes.
In the age range examined, neural development is a dynamic process. At the macro level, longitudinal structural neuroimaging shows that cortical thinning occurs from childhood through early adulthood, progressing in a caudal to rostral pattern (Gogtay et al. 2004; Giedd et al. 2015). At the micro level, synaptic pruning and myelination, particularly in the frontal lobe, are ongoing during this period (Rakic, Bourgeois, and Goldman-Rakic 1994; Huttenlocher and Dabholkar 1997; Cox et al. 2016). From a functional perspective, studies of functional connectivity and task-based fMRI suggest that functional maturation tends to follow a “diffuse to focal pattern” (Durston et al. 2006; Grill-Spector et al. 2008; Fair et al. 2009; Kelly et al. 2009). Speculatively, the decreased ISC strength in older ages may reflect greater inter-individual variability that results from the interplay of structural and functional “streamlining” of neural architecture with distinct life experiences (e.g. cortical thinning, synaptic pruning and diffuse-to-focal shifts in functional patterns). One limitation of the present study is that it is cross-sectional rather than longitudinal, it is thus difficult to make developmental claims based on the age-based differences demonstrated here (Kraemer et al. 2000). Additionally, physiological pubertal stage was not measured, and it is possible that grouping cohorts according to pubertal stage rather than chronological age may reveal different results. The cutoff of between 14 and 15 years of age was based on statistical considerations (balanced group sizes) and is thus developmentally arbitrary.
Among the different stimuli used, the Hollywood videos (Wimpy and DesMe) evoke higher levels of ISC than the educational videos (Arith, Fract, and StudT), and Fract evoked the highest ISC of the educational videos. The Hollywood videos contain more scene cuts and dynamic visual cues than the educational videos and they are therefore expected to elicit stronger levels of ISC (Poulsen et al. 2016). However, previous research has also shown that engagement with narrative stimuli modulates ISC, and it is therefore likely that these Hollywood clips are more effective at engaging attention and thus elicit stronger ISC (Dmochowski et al. 2014; Ki, Kelly, and Parra 2016). Although the ISC differences between age and gender may be due to each cohort’s average level of attention, no independent measures of engagement or attention were collected. It is therefore not possible to determine whether the present effects are driven by attention. However, it is true that most of the videos were aimed at younger audiences (i.e., Despicable Me, Diary of a Wimpy Kid) and older subjects may have therefore been less interested, thus the age-related differences in ISC may be theoretically driven by this. However, the results presented in the naturalistic movies were echoed in the SSVEP condition, which should be equally engaging for all ages.
The present data should thus be interpreted in the context of neural maturation. With maturity, neural function may become more variable. Future work should recruit a larger sample of subjects above age 15 to determine whether the age-related decline in ISC observed in later teenage years continues in adulthood, or maybe reverses in older age (Grady 2012). Future studies using clinical populations, with improved experimental control for attention and engagement during complex viewing paradigms, could aim to explore a potential link between EEG ISCs and specific developmental behavioral measures.
Funding
This work was supported by gifts to the Child Mind Institute (Michael P. Milham) from Phyllis Green, Randolph Cowen, and Joseph P. Healey.
Acknowledgement
We thank Stefan Haufe for suggesting code to compute ISC using symmetrized between- and within-subject covariances.


