

ABSTRACT
Development and calibration of suitably accurate functional assays for BRCA1 RING domain and BRCT domain missense substitutions could dramatically accelerate clinical classification of rare missense substitutions observed in that gene. Leveraging data from 68,000 full sequence tests of BRCA1 and BRCA2, plus data from the limited number of already classified BRCA1 RING domain missense substitutions, we used logistic regression and related techniques to evaluate three BRCA1 RING domain assays. These were recently described high throughput yeast 2-hybrid and E3 ubiquitin ligase assays, plus a newly developed mammalian 2-hybrid assay. While there were concerns about the accuracy of the yeast 2-hybrid assay and the indirect nature of the ubiquitin ligase assay, the mammalian 2-hybrid assay had excellent correlation with existing missense substitution classifications. After calibration, this assay contributed to classification of one newly reported BRCA1 missense substitution. In principal, the mammalian 2-hybrid assay could be converted to a high-throughput format that would likely retain suitable accuracy.
INTRODUCTION
BRCA1 and its heterodimerization partner BARD1 share two highly conserved domains: an N-terminal RING domain and a pair of C-terminal BRCT repeats. Even though the RING and BRCT domains comprise only about 17% of the length of BRCA1, all of the missense substitutions in this protein that are known to be pathogenic occur in one of these two domains(http://hci-exlovd.hci.utah.edu/home.php?select_db=BRCA1), unless the underlying nucleotide change is spliceogenic. While severely dysfunctional missense substitutions in either of thesedomains are associated with increased cancer risk (reviewed in Clark et al., 2012), it is still unclear how non-spliceogenic RING missense substitutions elicit their pathogenicity
In contrast with protein truncating variants, it is often difficult to know what effect, if any, missense substitutions will have on protein function. Over the last 12 years, we and others have developed a Bayesian “integrated evaluation” or “multifactorial model” for evaluation of Variants of Unclear Significance (VUS) in BRCA1 and BRCA2 (Easton et al., 2007; Goldgar et al., 2004, 2008). This integrated evaluation combines a sequence analysis-based prior probability of pathogenicity (Prior_P) (Tavtigian et al., 2008; Vallée et al., 2016) with observational data from the patient and/ or tumor, expressed as odds in favor of pathogenicity (Odds_Path) to arrive at a posterior probability of pathogenicity (Post_P) (Lindor et al., 2012; Vallée et al., 2012). The resulting posterior probability is then converted to one of five qualitative classes, based on cutpoints considered to be clinically relevant (Plon et al., 2008). Using this quantitative approach, 155 missense substitutions have now been classified in BRCA1 (http://hci-exlovd.hci.utah.edu/home.php?select_db=BRCA1). Of these, ten are located in the RING domain, with eight falling into one of the two pathogenic classes (IARC Class 4 or 5) and two falling into one of the two neutral classes (IARC Class 1 or 2).
Two well recognized activities of BRCA1 reside in its first 300 amino acids. The interval from roughly Ala4 to Ala102 encodes a C3HC4 RING finger and a set of helical bundles that together enable heterodimerization with the homologous domain of BARD1 (Brzovic et al., 2001; L. Wu et al., 1996). In addition, the interval from roughly Ala4 to Asp300 encodes E3 ubiquitin ligase activity (Nishikawa et al., 2004). The BRCA1:BARD1 interaction influences the abundance and stability of BRCA1 (W. Wu et al., 2010), is necessary for early recruitment of BRCA1 to sites of DNA double strand breaks (Li & Yu, 2013), and fully activates the BRCA1 E3 ubiquitin ligase activity (Baer & Ludwig, 2002; Brzovic et al., 2003; Hashizume et al., 2001). To our knowledge, there are no well-documented BRCA1 seperation of function mutations that severely damage the BARD1 interaction without also dramatically reducing E3 ubiquitin ligase activity. On the other hand, the BRCA1 missense substitution p.Ile26Ala, which does not dramatically reduce BARD1 interaction, specifically disrupts the interaction between BRCA1 and its cognate E2 ligases, selectively inhibiting E3 ligase activity by blocking the transfer of ubiquitin to substrates bound to BRCA1 (Brzovic et al., 2003; W. Wu et al., 2008). Interestingly, mice homozygous for this RING domain separation of function missense substitution are no more tumor prone than their wild type littermates (Shakya et al., 2011). In contrast, RING variants that disrupt heterodimer formation result in DNA repair defects and loss of tumor suppression (Ransburgh et al., 2010). Nonetheless, Starita et al reported that BRCA1:BARD1 heterodimer formation alone is a poor predictor of the pathogenicity of RING missense substitutions, implying that the E3 ligase activity does make an important contribution (Starita et al., 2015).
Previously, we used data from 68,000 full sequence tests of BRCA1 and BRCA2 performed at Myriad Genetics to develop and calibrate computational algorithms for evaluation of missense substitution severity and splice variant severity in these two genes (Tavtigian et al., 2008; Vallée et al., 2016). Here, linking the Myriad BRCA1 test data to the nearly comprehensive Yeast 2-hybrid BRCA1:BARD1 interaction assay data and phage display BRCA1 E3 ligase activity data published recently by Starita et al (2015), we test two 1-sided hypotheses: (1) as measured by the Starita et al yeast 2-hybrid assay, that loss of BRCA1:BARD1 interaction is predictive of pathogenicity, and (2) as measured by the Starita et al phage-display E3 ligase assay, that loss of BRCA1 auto-ubiquitination is predictive of pathogenicity. Guided by the results from these hypothesis tests, we develop and calibrate an accurate functional assay, results from which can be included within the Bayesian integrated evaluation framework to assess the pathogenicity of BRCA1 RING missense substitutions. We then report progress towards conversion of that assay to a high-throughput format thatcould evaluate all possible BRCA1 amino domain substitutions.
METHODS
Dataset
The dataset comprised results of full sequence tests carried out at Myriad Genetic Laboratories, as used previously in Easton et al. (2007) and Tavtigian et al. (2008) for modelling of risk associated with BRCA1/2 sequence variation. The analyses described here are based on results of full sequence tests of both genes from 68,000 BRACAnalysis subjects of whom 4,867 were reported to carry a pathogenic BRCA1 variant and 3,561 were reported to carry a pathogenic BRCA2 variant. For a test to have been performed, a test request form must have been completed by the ordering health care provider, and the form must have been signed by an appropriate individual indicating that “informed consent has been signed and is on file”. The mutation screening data are arranged by sequence variant rather than by subject. The dataset includes nucleotide and amino acid nomenclature specifications for all of the exonic single nucleotide substitutions - silent, missense, or nonsense - observed from the 68,000 patient mutations screening set; these are all of the observational data required to calculate the Enrichment Ratio for Single Nucleotide Substitutions (ERS) (Tavtigian et al., 2008).
Analyses of the personal and family history of tested probands to calculate family history likelihood ratios (FamHx-LRs) derive from a virtually identical series of subjects used previously (Easton et al., 2007). However, this dataset also includes frameshifts, in-frame indels, and sequence variants falling in the intronic portions of the splice junction consensus regions from −20 to +6 of the protein coding exons. We refer to these two overlapping data sets asthe B1&2 68K set.
Additional Subjects
Independent to the B1&268K set, a family with the rare missense substitution BRCA1 p.P34S was identified. Informed consent was obtained before subjects provided a cancer personal & family history, and were tested for carriage of this variant.
Enrichment Ratio for Single Nucleotide Substitutions (ERS) calculations
The ERS is similar in spirit to the traditional population genetics measure dN/dS (dN is the non-synonymous substitution rate and dS is the synonymous substitution rate per site), where a dN/dS ratio greater than 1.0 is indicative of positive selection (Yang, 1998). For each nucleotide in a canonical DNA sequence, there are three possible single nucleotide substitutions. However, these substitutions are not equally likely to occur because of differences in the underlying substitution rate constants. Using the dinucleotide substitution rate constants given by Lunter & Hein (2004), averaging sense and antisense orientations, we can estimate a relative substitution rate for every possible single-nucleotide substitution to a DNA sequence, ri. The probability that a new sequence variant (i.e., a new germline sequence variant at the moment that it comes into existence) will fall into a particular algorithmically defined class c† is given by the ratio of the sum of the relative substitution rates of the variants belonging to the class c divided by the sum of all relative substitution rates:

Hence, under the null hypothesis of no selection, we can obtain from the total number of variants observed in a mutation screening study, OT, the number expected in any class, eC=pC×oT, and compare this to the actual number observed, oC. Thus, in general, we define the ERS for any class of substitutions c as the observed / expected ratio for that class normalized by the same ratio for silent (i.e., synonymous) substitutions but excluding the few silent substitutions that are likely to be spliceogenic:

†For this discussion, an “algorithmically defined class” of variants is a class of variants that can be unambiguously specified by an algorithm. One example could be, given a specified protein multiple sequence alignment, all substitutions that fall at an invariant position in the alignment and have a Grantham Score ≥65. Another could be, given a functional assay that evaluated essentially all possible substitutions in a given protein domain, all substitutions resultingin >60% of wild-type activity in the functional assay.
Regressions of high-throughput yeast 2-hybrid and phage display ubiquitin E3 ligase assay results against B1&2 68K data
To test the hypothesis that the Y2H assay is a predictor of pathogenicity for missense substitutions in BRCAls BARD1 interaction domain, we performed a logistic regression of the presence of the variant (yes/ no) in the B1&2 68K data set as a function of the result of the Starita et al (2015) Y2H assay, controlling for the nucleotide substitution rate constant of each substitution. This analysis was limited to BRCA1 amino acid positions 2-103. Because raw Y2H assay results were skewed towards 100% activity whereas exponentiated Y2H assay results gave a more symmetric distribution, exponentiated Y2H results were used in the regression. Because the log of the substitution rate constants was closer to a Guassian distribution than the raw rate constants, log rate was used in the regression.
To test the hypothesis that the E3 ubiquitin ligase assay is a predictor of pathogenicity for missense substitutions in the E3 ligase domain, but outside of the BARD1 binding domain, we performed a logistic regression of the presence of the variant (yes/ no) in the B1&2 68K data set as a function of the result of the Starita et al (2015) E3 ligase assay, controlling for the nucleotide substitution rate constant of each substitution. This analysis was limited to BRCA1 amino acid positions 104-300. The distribution of raw E3 ligase assay results was adequately symmetric for use in the logistic regressions as raw data.
Summary family history based risk estimates
BRCA1 BRCT domain and BRCA2 DNA binding domain missense substitutions were stratified by Align-GVGD scores asdescribed in Tavtigian et al. (2008). Then all of the summary personal/family histories of the subjects who carried the variants within a particular stratum were used to estimate α, the proportion of variants within that stratum that were pathogenic, using the heterogeneity likelihood ratio defined in (Easton et al., 2007). Approximate 95% confidence intervals for the heterogeneity proportion were obtained by finding the values αL and αU for which the overall likelihood differed from that at α by an amount equivalent to a likelihood ratio test significant at the 0.05 level (Easton et al., 2007).
1-by-1 mammalian 2-hybrid assay
Cell line development
The firefly luciferase reporter pGL4.31 (Promega), was re-engineered for puromycin resistance, and then stably incorporated into HEK293 cells (ATCC CRL-1573) using the PiggyBac transposon system (System Biosciences). Chromatin insulators and PiggyBac terminal repeats were added to each end of the reporter to block transgene silencing and facilitate transposition, respectively. These sequences were PCR amplified from PB531A-2 (System Biosciences).
500,000 HEK293 cells/well were plated in a 6-well plate 18-24 hours before transfection. 500 ng of PiggyBac pGL4.31 Puro and 200 ng of PiggyBac transposase (PB200A-1, System Biosciences) were co-transfected with 8μl of FugeneHD (Promega). The cells were then subjected to one week of selection (2μg/ml puromycin), at which point individual clones were transferred to 96-well plates via FACS. Luciferase activity was characterized by the two-hybrid system described below, using known neutral BRCA1 RING missense substitutions and WT BARD1. The clone with the highest relative luminescence signal (~1×10⁶ RLU) was used to generate the stable cell line (HEK293 PibbyBac pGL4.31 Puro) used for subsequent mammalian 2-hybrid assays.
Cell line maintenance
HEK293 PGL 4.31 cells were grown in high-glucose DMEM (Gibco) supplemented with 10% fetal bovine serum (Gibco), Na-pyruvate (Gibco, 110 mg/L), penicillin/streptomycin (Gibco, 5,000 U/ml), and puromycin (Gibco, 2μg/ml). Cells were passaged with phenol red-free TrypLE (Gibco, 1×) as needed at a 1:10 split.
Plasmid construction
Mammalian 2-hybrid assay vectors, pACT (E246A, Promega) and pBIND (E245A, Promega), were modified by moving VP16 and GAL4 to the C-terminus. The first 184 amino acids of BRCA1, fused to 3× FLAG, was cloned into pBIND immediately upstream of GAL4, while the first 200 amino acids of BARD1, fused to HA, was cloned into pACT immediately upstream of VP16. BRCA1 and BARD1 cDNA templates were obtained from pCL-MFG-BRCA1 (Addgene plasmid #12341)( Ruffner & Verma, 1997) and BARD1 pET28a (Addgene plasmid #12646) (Brzovic et al., 2006), respectively. Linker sequences were placed between all coding regions to limit steric hindrance.
Mammalian 2-hybrid assay
BRCA1:BARD1 heterodimer formation was evaluated by co-transfecting HEK293 PiggyBac pGL4.31 Puro cells with WT BARD1 (pACT_BARD1 1-200), and either WT BRCA1 or various BRCA1 RING missense substitutions (pBIND_BRCA1 1-184). Three independent clones of each BRCA1 RING missense substitution were individually incorporated into the pBIND vector using the QuikChange lightning site-directed mutagenesis kit (Agilent). The presence of each of variant, and lack of additional mutations in the BRCA1 coding sequence, was confirmed by Sanger sequencing (data not shown).
HEK293 PiggyBac pGL4.31 Puro cells were transfected using TransIT-293 (Mirus). Briefly, 13,000 cells/well were plated on a 96-well microplate in antibiotic-free, phenol-free RPMI (Gibco) supplemented with 10% FBS. 18-24 hours later, 50 ng of WT BARD1 (pACT_BARD1 1-200) and 50 ng of either WT BRCA1 (pBIND_BRCA1 1-184), an empty vector (pBIND) or various BRCA1 RING missense substitutions were co-transfected at a 1:1 molar ratio in 10 μl of phenol-free Opti-MEM (Gibco), with TransIT-293 being used at a 3:1 ratio (0.4 μl/well). Each individual BRCA1 missense clone was assayed in triplicate on a single day (batch). The three independent clones of a given missense substitution were assayed in different batches. WT BARD1 was replaced with an empty vector on the right half of each plate as a background control. Firefly and Renilla luciferase expression were quantified 48 hours later on a Glomax 96 Microplate Luminometer using the Dual-Glo Luciferase Assay System (Promega). Observed Firefly luciferase activity was normalized for transfection efficiency by dividing Firefly by Renilla, and multiplying by 1,000. This normalized activity (measured in triplicate for each clone) was then converted to %WT activity by dividing each normalized measure by the average activity of the WT control on the same plate. This value was then multiplied by the inverse variance of each clone (weight), summed, and divided by sum weight of all three clones to arrive at a weighted average of %WT activity. A standard 95% CI is reported for each BRCA1 RING missense substitution.
Co-Immunoprecipitation
HEK293 cells were transfected using Polyethylenimine (PEI) (Polysciences Incorporated). Briefly, 3×10⁶ HEK293 cells were plated on a 10cm2 plate in high-glucose DMEM (Gibco) supplemented with 10% fetal bovine serum (Gibco), Na-pyruvate (Gibco, 110 mg/L), and penicillin/streptomycin (Gibco, 5,000 U/ml). 18-24 hours later, 2.5 μg of WT BARD1 (pACT_BARD1 1-200) or an empty vector (EV), and either WT BRCA1 or various BRCA1 RING missense substitutions (pBIND_BRCA1 1-184) were co-transfected with 500 ng of pBIG (GFP control plasmid), with PEI (1 mg/ml) being used at a 2:1 ratio.
Cell lysates were harvested in phospho-protecting lysis buffer (PPLB) 48 hours post-transfection and immunoprecipitation performed from clarified cell lysates using α-FLAG (M2) antibody and Protein G Sepharose beads (Engel et al., 2010). Immune complexes were re-suspended in sample buffer without DTT, and heated to 70°C for 10 minutes. Immune complexes and clarified lysates from each transfection were probed using mouse monoclonal α-FLAG (M2) and α-tubulin (B-5-1-2) from Sigma Aldrich, rabbit polyclonal HA (ab9119) from Abcam, rabbit polyclonal GFP (sc-8334) from Santa Cruz Biotechnology, IRDye 800CW Goat anti-Mouse (92532210), and IRDye 680RD Goat anti-Rabbit (925-68071) from LI-COR Biosciences.
To avoid IgG heavy and light chain interference, immune complexes were denatured in Bolt LDS sample buffer without dithiothreitol (DTT), and heated to 70°C for 10 minutes. Clarified cell lysates were denatured in a similar manner, with the exception that the sample buffer was supplemented with 50 mM DTT. Proteins were fractionated by electrophoresis on 8% Bis-Tris Plus gels (Invitrogen) in 1× Bolt MES SDS Running Buffer (Novex) for 30 minutes at 165 Volts. Transfers were conducted on iBlot 2 PVDF transfer stacks (Invitrogen) using pre-programmed template P0.
High-throughput mammalian 2-hybrid assay
To explore conversion of the existing 1-by-1 mammalian 2-hybrid assay into a high-throughput screen, the 2-hybrid luciferase reporter plasmid was converted to two independent fluorescent reporters, one with with ZsGreen and puromycin resistance, and the other with Tdtomato and blasticidin resistance. These two fluorescent reporters were then targeted with homology arms to the common integration site of the non-pathogenic adeno-associated virus (AAVS1) and ROSA26, respectively. For this transfection, 1 μg of each CRISPR and donor plasmid was cotransfected with 24 μl of PEI (1 mg/ml). After co-transfection into HEK293 cells with the appropriate CRISPR/cas9 reagents and double selection with puromycin (2 μg/ml) and blasticidin (Gibco, 15 μg/ml), a pool of cells was harvested for downstream experiments. PCR confirmed that the pool included cells with stably integrated ZsGreen and Tdtomato. In some of these cells, Tdtomato was located at ROSA26, but it was not possible to confirm location of ZsGreen at AAVS1.
BRCA1:BARD1 heterodimer formation was evaluated as described in the 1-by-1 mammalian 2-hybrid assay, with the following modifications: 625,000 ZsGreen/Tdtomato cells/well were plated in a 6-well plate 18-24 hours before transfection. 525 ng of pBIND_BRCA1 1-184 plus 469 ng of pACT_BARD1 1-200 were co-transfected at a 1:1 molar ratio, with PEI (1 mg/ml) used at a 6:1 ratio. 48 hours post-transfection, the six wells of cells were mixed and FACS sorted into four bins based on Tdtomato expression. Each of these bins was further sorted into four bins based on ZsGreen expression. RNA was isolated from each bin along the dual-expression main diagonal using the Direct-zol RNA miniprep kit (Zymo Research), and converted to cDNA using the SuperScript III first-strand synthesis system (Invitrogen). The RING sequence of BRCA1 was then RT-PCRd with an intron-spanning primer and sequencing libraries prepared using the Ovation Ultralow Library System (NUGEN # 0329), excluding the end-repair step and using a different barcode for each of the four main diagonal red-green fluorescence intensity bins. The libraries were sequenced on a Illumina MiSeq channel using the MiSeq 300 bp Cycle Paired-end sequencing protocol.
Statistical analyses
Regressions of high-throughput yeast 2-hybrid and phage display ubiquitin E3 ligase assay results against B1&2 68K data were performed in R version 3.2.1 (R Core Team, 2015). Mammalian 2-hybrid assay results were summarized in Excel version 14.2.3 (Microsoft). Regressions to calibrate the Mammalian 2-hybrid assay results were performed in Stata 11.0 (StatCorp).
RESULTS
Re-analysis of Starita et al data
Because BRCA1 is a breast/ ovarian cancer susceptibility gene, BRACanalysis is a sequencing test fundamentally designed to detect pathogenic sequence variants in BRCA1 (and BRCA2),and the B1&2 68K set of subjects was strongly enriched in individuals with a personal and/or family history of breast/ ovarian cancer, we expect to observe a disproportionate excess of sequence variants in the B1&2 68K set in algorithmically defined classes of BRCA1 sequence variants that correlate well with pathogenicity. To provide a point of reference for this statement, Table 1 uses the ERS to show that, compared to non-spliceogenic silent substitutions, the B1&2 68K set contained an excess of missense substitutions falling within the key RING and BRCT domains (combined P<2.7×10⁻⁴), and a strong excess of nonsense substitutions overall (P<10−10).
Framing a hypothesis test of the Starita et al. (2015) Y2H functional assay as a predictor of pathogenicity, when these data from Asp2-Asn103 were stratified into substitutions with relatively high (>90% of wild-type), moderate (60%-90% of wt), and low (<60% of wt) BARD1 binding activity, the moderate category had an elevated ERS and the low category had a markedly elevated ERS, approaching that of nonsense substitutions (Table 1). Using the Y2H% wt activity as a continuous variable, logistic regression confirms that the probability of pathogenicity increases as the Y2H interaction decreases, with P= 2.7×10⁻⁵ (Table 1).
Framing a hypothesis test of the Starita et al (2015) E3 ubiquitin ligase assay as a predictor of pathogenicity for missense substitutions outside of BRCA1s BARD1 interaction domain, when these data from Ser104-Glu300 were stratified into substitutions with relatively high (>90% of wt), moderate (60%−90% of wt), and low (<60% of wt) E3 ubiquitin ligase assay, neither the moderate nor the low category had a notably elevated ERS (Table 1). Using these E3 ligase activity data as a continuous variable, there was no relationship between E3 ligase activity and probability of pathogenicity, P=0.24 (Table 1).
A secondary question raised by Starita et al is whether the E3 ubiquitin ligase assay adds predictive power over and above the Y2H assay for missense substitutions with the BARD1 interaction domain. This was tested by adding the E3 ubiquitin ligase assay results from Asp2-Asn103 to the Y2H logistic regression. The analysis indicates that the probability of pathogenicity increases as both the Y2H interaction decrease and E3 ubiquitin ligase activity decrease, with P=1.1×10⁻² for Y2H and 6.7×10⁻³ for E3 ubiquitin ligase activity.
Mammalian 2-Hybrid Results
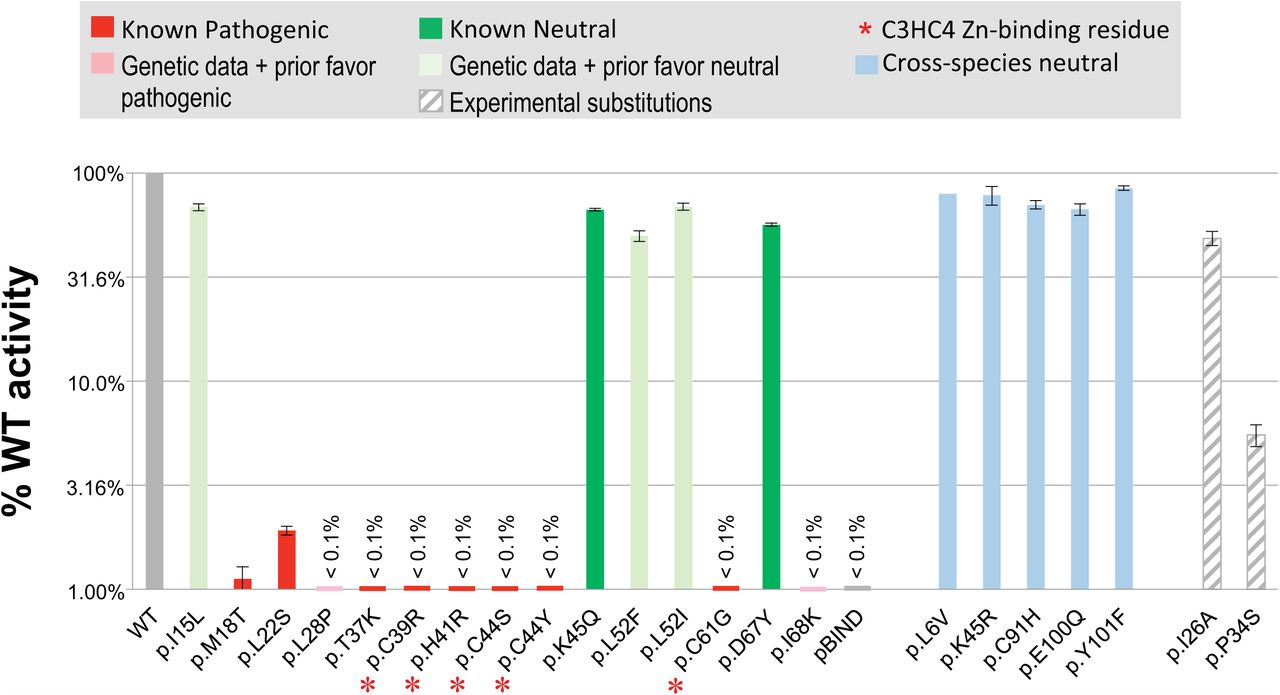
The BRCA1 Ex-UV database (http://hci-exlovd.hci.utah.edu/home.php?select_db=BRCA1) records seven Definitely pathogenic and one Likely pathogenic missense substitution in the RING domain. These eight substitutions all had <5% wt activity in the mammalian 2-hybrid BARD1 interaction assay (M2H assay) (Figure 1A). The database records two Not pathogenic missense substitutions, and these both had >55% wt activity in the M2H assay (Figure 1A).


A. Mammalian two-hybrid BRCA1:BARD1 heterodimerization results. The classification of each substitution assayed is given above the bar graph. Error bars represent 95% confidence intervals. Note that the cross-specied neutral variant does not have a confidence intervalbecause only two (instead of 3 or more) valid expression constructs were made from this variant. B. BRCA1:BARD1 co-immunoprecipitation results. Inclusion of BRCA1, BARD1, and/or GFP in the transfections is indicated above the Western blot panels. The identity of the BRCA1 expression construct included in the transfection is indicated below the panels. The upper panel is an immunoblot of immuneprecipitated immunocomplexes (IC). The lower panel is an immnunoblot of whole cell lysates (WCL). The identity of each protein band is indicated at the right side of the panels.
Although the M2H assay produced clear separation between known pathogenic and known neutral missense substitutions, the total number of known classified substitutions is too few, and too skewed towards pathogenic substitutions, to generate a reasonable calibration curve. Accordingly we assayed 10 more substitutions, systematically selected from three groups as follows. First, the B1&2 68K set included one additional substitution (p.I68K) with observational odds >2:1 in favor of pathogenicity. Second, that datab set included four additional substitutions (p.I15L, p.L28P, p.L52F, and p.L52I) with observational odds <0.5:1 in favor of pathogenicity. Third, because substitutions with data in favor of pathogenicity outnumbered those with data against pathogenicity, we identified from the BRCA1 protein multiple sequence alignment used for generating Align-GVGD scores (Tavtigian et al., 2008) (http://agvgd.hci.utah.edu/BRCA1_Spur.html) cross-species amino acid substitutions that met a double criterion indicative of neutrality: (i) the alternate amino acid was present in a primate sequence, and (ii) even if the primate sequence with one of these substitutions is removed from the alignment, the alternate amino acid remains within the range of variation of the mammals-only alignment. Five substitutions met these criteria: p.L5V, p.K45R, p.C91H, p.E100Q, and p.Y101F. The M2H activities of these 10 substitutions are also displayed in Figure 1A and, for nine of these ten, the patient derived Odds_Path,sequence analysis based Prior_P, and M2H result were all congruent. One, p.L28P, presented a more complex pattern: the observational Odds_Path were 0.42 (more than two-fold against pathogenicity), the sequence analysis based Prior_P was 0.81 (strongly in favor of pathogenicity), and the M2H results was 0.08% ofwt activity. Since a Bayesian combination of the Prior_P and Odds_Path result in a Post_P of 0.64 (above 0.5, therefore in favor of pathogenicity), we also interpret the M2H result as congruent.
Therefore, across 20 missense substitutions, the sensitivity and specificity of this M2H assay were both 100% (for both, the 95% CI was 0.69-1.00).
For a subset of variants, the two-hybrid data were validated at the protein level. The N-terminus of BRCA1 (amino acids 1-184) fused to FLAG was immune purified from whole cell lysates, and co-immunoprecipitation of BARD1 (amino acids 1-200) fused to hemagglutinin was determined by immunoblot. In three separate pull downs, WT, two known neutral (BRCA1 p.K45Q and p.D67Y), and a BRCA1 RING missense substitution with genetic data and sequence analysis-based Prior_P against pathogenicity (BRCA1 p.L52F) bind to BARD1 (Figure 1B). In contrast, the empty vector control and two pathogenic RING missense substitutions (BRCA1 p.L22S and p.C61G) show no detectable level of BARD1 in their pull downs (Figure 1B). In the assays where no interaction was detected, BARD1's presence in the corresponding whole cell lysates confirms that the absence of an interaction in the immune complexes is not due to protein degradation.
Calibration of the mammalian 2-hybrid assay
A simple regression was used to convert %wt activity from the M2H assay to Odds_Path, the variable required to perform a Bayesian integration of the functional assay data with patient-derived Odds_Path and/or the sequence analysis-based Prior_P (Vallee et al., 2012). For the 15 substitutions with patient observational data, we regressed the %wt activity against Log10(Odds_Path), where the latter data were obtained either from the Ex-UV database or else from the B1&2 68K set data set. For the 5 cross species neutral variants, we replaced patient observational data with the sequence analysis based Prior_P (0.03 <http://priors.hci.utah.edu/PRIORS/> and underlying algorithms), converted to Log10(Odds).
With %wt M2H activity expressed as a decimal, the calibration equation resulting from the regression is:
 with a 95% confidence interval on the slope of (−6.02 – −2.76) and P=1.78×10⁻⁵ against the null hypothesis of no relationship between M2H activity and patient observational Odds_Path. The estimated tipping point - the point at which M2H activity switches from evidence against pathogenicity to evidence in favor of pathogenicity, comes a 37.85% of wt activity. From the regression curve and M2H data displayed in Figure 2, the interpretive difficulty is that there were no M2H data between 10% and 45% of wt activity. Consequently, the shape of the regression curve through the tipping point is imposed by the (logistic) regression chosen. A simple approach to building this uncertainty into operational conversion from M2H activity to functional assay Odds_Path is to use the width of the 95% confidence interval of the slope to introduce a “grey zone” ofno information around the tipping point and moderate the regression conversion above and below. Thisapproach produces the equation:

Calibration of the mammalian 2-hybrid assay. Solid line represents the calibration equation resulting from regression of % wt activity against Logi0(Odds_Path), with the Y-axis expressed as probability instead of odds. The heavy dashed line represents the regression equation modified using the 80% confidence interval of the slope where the regression crosses probability=0.50. The lighter dashed line represents the regression equation modified using the 95% confidence interval of the slope where the regression crosses probability=0.50. The classes of variants included in the regression are indicated in the legend at the right of the figure. The % wt activity of p.P34S (5.5%) and p.I26A (48.4%) are annotated on the figure.

Experimental missense substitutions
Two of the missense substitutions evaluated with the M2H assay, p.I26A and p.P34S, were considered experimental rather than part of the calibration series. p.I26A, which disrupts BRCA1:BARD1 E3 ligase activity but does not notably increase cancer susceptibility when homozygosed in mice (Brzovic et al., 2003; Shakya et al., 2011), had 48.4% of wt M2H activity. This is at the lower bound of the known neutral substitutions, but far above theactivity of the known pathogenic substitutions.
BRCA1 p.P34S was observed in a woman diagnosed with ovarian cancer at age 55 and shared by her older sister whowas diagnosed with ovarian cancer at age 75 (Figure 3). The M2H assay revealed that the substitution had 5.5% of wt activity; this is at the upper bound of the known pathogenic substitutions, but far below the activity of the known neutral substitutions. Quantitative Integrated Evaluation combining the sequence analysis Prior_P, segregation, cooccurrence, and M2H data results in either IARC Class 5 or Class 4 (Pathogenic or Likely Pathogenic), depending on the M2H calibration used (Table 2).

Towards a high-throughput M2H assay
In principle, relatively recently developed technologies could be used to convert the 1-by-1 M2H assay to a massively parallel high-throughput assay. One strategy would chain together array synthesis and en masse Gibson assembly to generate libraries with massive numbers of systematically designed sequence variants; Flp-In to convert en masse library transfection to cells with a unique expression construct; two or more colors of 2-hybrid reporters (at different loci) to increase resolution across the range of BRCA1:BARD1 heterodimerization activity; and massively parallel sequencing across bins of multi-color flow sorted cells to read out the M2H activity of individual missense substitutions (Figure 5).

To simulate the 2-color reporter, flow sorting, and sequencing phases of this strategy, we prepared a pool of HEK293 cells with UAS GAL4-driven ZsGreen and Tdtomato M2H reporters. A preliminary test showed that about 12% of the cells in the pool could productively express the red reporter, and about 8% could productively express the green reporter (data not shown). Individual wells of a 6-well plate were then transiently co-transfected with wild-type, two neutral, two pathogenic and one VUS (now re-classifiedas Likely pathogenic) BRCA1 RING missense substitution (plus wt BARD1). Post transfection, the six wells of cells were mixed and then FACS sorted into four bins based on RFP expression. Each of these bins was further sorted into four bins based on GFP expression.
Sequencing of BRCA1 RING domain transgene cDNA from each of the four bins along the dual-expression main diagonal (Redlow:Greenlow => Redhigh:Greenhigh) (RLGL => RHGH), revealed that 80% of BRCA1 reads aligned perfectly to one of the six possible target sequences. Table 3 summarizes read counts and analyses, restricted to the perfect-match reads, of these data. We observed considerable separation in %wt activity between the two neutral and two pathogenic substitutions included in the experiment. Moreover, the experiment exactly recapitulated the ordering of %-wt activity that we obtained in the 1-by-1 M2H assay. Finally, placing the two pathogenic rMS {p.L22S+p.C61G} in one category and the two neutral rMS {p.K45Q+ p.D67Y} in a second category, a simple 2-sided T-test revealed P=0.029 against the null hypothesis that the two categories had equal representation in the RHGH versus RLGL bins.
DISCUSSION
Structural and biochemical studies of the BRCA1 E3 ubiquitin ligase activity, including recent evidence that BARD1 residue Arg99 is critical to this activity, put BRCA1:BARD1 heterodimerization upstream of E3 ubiquitin ligase activity towards key substrates (Brzovic et al., 2003; Densham et al., 2016). This heterodimerization is also required for early recruitment of BRCA1 to sites of DNA double strand breaks (Li & Yu, 2013). While it is not clear how the various activities attributed to BRCA1, heterodimerization dependent or not, add up to the protein's full tumor prevention activity, it is more likely than not that heterodimerization is the key function residing in the C3HC4 RING finger and helical bundles that constitute the first ~100 amino acids of this protein. In contrast, evidence that the ubiquitin ligase deficient substitution BRCA1 p.I26A does not cause notable tumor susceptibility in mice, combined with evidence against pathogenicity in humans for ubiquitin ligase damaging substitutions falling immediately downstream of the RING domain, weigh against the hypothesis that ubiquitin ligase activity is central to BRCAls full tumor prevention activity.
The high-throughput yeast 2-hybrid assay described by Starita et al. (2015) and the 1-by-1 mammalian 2-hybrid assay are both very nearly direct tests of BRCA1:BARD1 heterodimerization activity. While both assays are able to resolve the activity of substitutions falling at the key C3HC4 RING cysteines and histidine from neutral substitutions, there was a notable difference in their discrimination between other pathogenic substitutions and neutral substitutions. From the data underlying Figure 1, the three known pathogenic substitutions plus two additional substitutions with combined Prior_P and Odds_Path leaning towards pathogenicity that were used for assay calibration averaged 0.66% of wt (standard deviation =0.84%) while the two neutral substitutions plus three additional substitutions with combined Prior_P and Odds_Path leaning towards neutrality averaged 61.9% of wt (standard deviation =8.5%). Using the sum of the standard deviations of the pathogenic and neutral substitutions as a yardstick, these two groups were resolved by 6 summed standard deviations. In contrast, from Starita et al. (2015), these two groups averaged 89.1% (SDev =7.2%) and 100.6% (SDev =8.2%) of wt activity, respectively. Thus they were resolved by less than one summed standard deviation, which is indicative of limited assay sensitivity. Rescuing sensitivity by adding the high-throughput E3 ubiquitin ligase assay would introduce a systematic source of error because there genuinely are some missense substitutions that are proficient for heterodimerization but deficient for E3 ligase activity, and there is evidence against pathogenicity for this class of substitutions.
The magnitude of risk conferred by heterozygous pathogenic missense substitutions in BRCA1, whether measured as penetrance or odds ratio, is clearly a continuous variable. However, virtually all of the BRCA1 missense substitutions so far placed in IARC Classes 4 or 5 are thought to be high-risk, essentially equivalent to protein truncating variants (Goldgar et al., 2004) or conferring odds ratios of 5 or higher (Easton et al., 2015). Very few have been classified as moderate-risk; the BRCT substitution BRCA1 p.R1699Q is the only established moderate-risk BRCA1 substitution (Spurdle et al., 2012), and no RING domain substitutions have been established as such. If a functional assay were very accurate, there would in principle be a threshold in % wt activity marking the tipping point between evidence for or against pathogenicity, a range corresponding to moderate-risk, and a threshold below which the substitutions are most likely high-risk. However, absent moderate-risk substitutions to include in a calibration, the %wt activity levels corresponding to these thresholds are necessarily uncertain. Here, we used the width of the confidence interval on the slope of the regression equation to introduce a %-wt activity “grey zone” at Odds_Path=1.0. We suggest, subject to community discussion, that an 80% CI width is appropriate for functional assays thought to be directly related to the underlying mechanism of pathogenicity, and the 95% CI when the assay appears reasonably accurate but the underlying mechanistic connection is less clear.
For humans, the de novo nucleotide substitution rate is thought to be ~1×10⁸ substitutions•site−1•generation−1 (Veltman and Brunner 2012; Shendure and Akey 2015). Allowing that there are 30-fold differences in substitution rates across sites (Lunter and Hein 2004), this average rate may over-estimate the median rate by 10-fold. Even so, a rate 1×10⁻⁹ substitutions•site−1•generation−1 taken against the human population of 7×10⁹ individuals means that the human gene pool includes multiple substitutions at almost every nucleotide, in turn implying multiple rare missense substitutions at almost every codon, many of which are pedigree-specific because they occurred within the last few generations. For this reason, using a 1-by-1 functional assay to chase after clinically observed substitutions as they are reported only makes sense if there are technical reasons to believe that a high-throughput assay (i) meeting community standards for expression construct assembly and verification, and (ii) possessing sufficient dynamic range to contribute to variant classification in combination with multiple independent lines of evidence, is technically impossible. The expression construct criterion, primarily that each construct be independently prepared three or more times and sequenced (Guidugli 2013; Iversen 2011), can be met by strategies that combine array synthesis, barcoding, and massively parallel sequencing. For missense substitutions in BRCA1, the vast majority that have been classified as IARC Class 4 or 5 had sequence analysis-based Prior_Ps of either 0.66 or 0.81. Back calculating from Bayes' rule, functional assay Odds_Path of 9.8 and 4.5, respectively, would suffice to convert those Prior_Ps to Post_Ps of 0.95, just reaching the Class 4 “Likely pathogenic” criterion (Plon et al., 2008). These values are within the dynamic range of the 1-by-1 M2H assay and may well fall within the dynamic range of a high-throughput version of the same assay.
COMPETING INTERESTS
Disclosure statement: the authors of this manuscript have no conflicts of interest to report.
ACKNOWLEDGEMENTS
This work was supported by the United States National Institutes of Health (NIH) National Cancer Institute (NCI) grants R01CA164944 and P30CA042014. BAT is an Australian National Health and Medical Research Council CJ Martin Early Career Fellow
Footnotes
Grant Sponsors This work was supported by the United States National Institutes of Health (NIH) National Cancer Institute (NCI) grants R01CA164944 and P30CA042014. BAT is an Australian National Health and Medical Research Council CJ Martin Early Career Fellow.
References


