

Abstract
Humans sometimes do perceive differences where physically there are none. It is thus tenable that perception is susceptible to seemingly random fluctuations in brain activity or “neural noise”. Here, we demonstrate the potency of both trial-aggregated as well as trial-by-trial measures in the human electroencephalogram (EEG) to characterize neural noise as (i) a trait of individuals of varying age (n = 19; 19–74 years), and (ii) a brain state that predicts an individual’s impending perceptual decision. Human participants were instructed to discriminate two identical, consecutively presented pure tones. Behaviorally, all participants reported perceiving pitch differences of first versus second tone. Neurally, decisions for the first versus the second tone were preceded by more consistently phase-locked responses to the first tone in the theta (4–9 Hz) band at central scalp electrodes. Second, a trial-wise information-theoretic measure quantifying the irregularity of broadband EEG, Weighted Permutation Entropy (WPE), prior to stimulus onset allowed to classify a listener’s impending decision on this trial. Average entropy not only increased with participants’ age, but correlated with previously suggested measures of an altered excitation-inhibition balance in the aging brain. Therefore, neural noise is best conceived not only as a state variable that can shape perceptual decisions but moreover can capture trait-like changes with age.
Significance Statement Humans sometimes do perceive differences where physically there are none, a phenomenon likely due to seemingly random fluctuations in brain activity, or “neural noise”. The potency of neural noise to explain intra- and inter-individual differences is largely unresolved. Here, we show that two complementary neural noise measures from the human EEG, across-trials phase-coherence of slow neural oscillations and a within-trial entropy measure, both predict decisions of participants when they are to compare physically identical tones. We also find the overall level of neural noise to increase with participants’ age, likely reflecting changes to an excitation-inhibition balance. Thus, neural noise not only helps to characterize behaviorally relevant brain states, but can also second as an inter-individual marker of neurobiological age.
Introduction
Perceptual decisions imply to choose between two or more alternative actions on the basis of sensory evidence provided by the physical world. Percepts fluctuate, however, and do so even in the absence of any physical differences, for example when participants are to discriminate physically identical stimuli. To what extent can we relate back such perceptual fluctuations to variability in the neural system itself?
Generally, neural noise refers to variations in brain activity that appear regardless of and unrelated to an external stimulation or experimental manipulation (Arieli et al., 1996; Faisal et al., 2009). With decreasing information in the stimulus, the influence of neural noise on perceptual decisions should increase. Thus, decisions regarding perceptual differences of identical stimuli must be related to the state (i.e., level of neural noise) of the perceiver’s neural system.
Results from modeling (Micheyl et al., 2009) and empirical research (Bernasconi et al., 2011) suggest that identical stimuli are indeed perceived as different and that variations in neural noise likely drive these different percepts. Although averaging over trials eliminates trial-wise variability from the signal and yields evoked activity, average-based measures of neural noise have been used to predict decisions (e.g. Bode et al., 2012). Nevertheless, a desirable measure of neural noise should rest on trial-wise and time-resolved quantification of ongoing activity (Arieli et al., 1996).
The concept of neural noise has recently gained renewed interest in order to characterize the aging neural system. Results from functional magnetic resonance imaging (fMRI) and electroencephalography (EEG) emphasize age-related decreases in trial-to-trial brain signal variability (Garrett et al., 2013; Grady and Garrett, 2014) and increases in 1/f noise (Sleimen-Malkoun et al., 2015; Voytek et al., 2015). Those changes have been argued to reflect a shift from distributed to more local processing, which entails flatter EEG frequency spectra (McIntosh et al., 2014; Voytek and Knight, 2015).
The major goal of the present study was to predict auditory perceptual decisions from neural noise. But how can we assess noise in a behaving neural system? A desirable measure of neural noise should not only predict perceptual decisions between identical stimuli (in terms of a neural state), but also track changes in the degree of neural noise that come with older age (in terms of a neural trait). Likely candidates offering adequate resolution in time and space derive from the study of neural oscillations and their influence on perception as well as from information-theoretic approaches. The phase and phase-coherence of low-frequent neural oscillations have been shown to strongly influence perceptual decisions over a range of modalities including vision (Hanslmayr et al., 2007; Busch et al., 2009; Mathewson et al., 2009) and audition (Ng et al., 2012; Strauß et al., 2015; ten Oever and Sack, 2015).
Information-theoretic measures on the other hand have been used extensively to research epileptic seizures (Nicolaou and Georgiou, 2012; Dickten et al., 2016) or vigilance states (Bruzzo et al., 2008; Nicolaou and Georgiou, 2011) and cognitive processes in the EEG (O’Hora et al., 2013). Information-theoretic measures of single trial time-courses should allow tracking whether neural noise (i) can be linked to auditory perceptual decisions, reflecting trial-by-trial brain-state changes and (ii) can serve as a trait-like marker for individual age-related change.
Here, we recorded the EEG while participants of varying age compared the pitch of identical pure tones. We demonstrate that both a trial-aggregated neural-noise measure in the time-frequency domain (theta-band inter-trial coherence) as well as a single-trial measure in the time-domain (weighted permutation entropy, WPE) allow predicting an individual listener’s perceptual decisions. Moreover, the entropy measure put forward here proved to be a sensitive marker for inter-individual differences in neural noise in the aging brain.
Methods
Participants
Nineteen healthy participants (age range 19–74 years, mean age 45 years, 12 female) with self-reported normal hearing took part in the experiment. Participants gave written informed consent and were financially compensated. None of the participants reported a history of neurological or otological disease. The study was approved by the local ethics committee of the University of Lübeck.
Stimulus material
One 650-Hz, 150-ms pure tone (sampled at 44.1 KHz, rise and fall times of 10 ms) was generated using custom MATLAB® code (R2014a; MathWorks, Inc., Natick, MA). In each trial during the main experiment, this pure tone was presented twice (i.e., as a pair) with an inter-stimulus-interval (ISI) of 900 ms using Sennheiser® HD-25-I headphones. To ensure accurate timing, auditory stimuli were presented via the Psychophysics toolbox (Brainard, 1997) and an external low-latency audio interface (Native Instruments). Note that the tone pairs were presented perfectly audible (i.e., no masking noise) at a comfortable loudness level, which participants could adjust themselves during practice trials.
General procedure
Participants were seated in a quiet room in front of a computer screen. First, they performed practice trials and an adaptive tracking procedure that resembled the main experiment but consisted of pairs of different tones which gradually were rendered more similar. Subsequently, they performed the main task, which consisted of identical stimuli only. In all parts of this study (practice trials, adaptive tracking, main experiment), participants had the task to decide on each trial which one of the two tones was higher in pitch.
Pre-experiment adaptive tracking task
Before the main experiment started, an adaptive tracking pitch discrimination procedure was performed to make sure that participants (i) were familiar with the task and (ii) based their decisions on perceived pitch differences only. This becomes necessary since fluctuations in the perception of durations and loudness are not only possible but have been reported previously (Bernasconi et al., 2011). In detail, participants were encouraged to complete 20 practice trials to familiarize themselves with the task. Practice trials consisted of one 650 Hz and one 620 Hz tone, presented in random order (corresponding to the stimuli that were used as a start level of the adaptive tracking paradigm) and involved auditory feedback which was “true” in this case. Subjects were given the chance to ask questions regarding the task before the adaptive tracking paradigm started.
The adaptive tracking consisted of 30 trials. The same task as for the practice trials was used but pitch differences between the two tones of each pair changed according to an adaptive, one-up-one-down staircase procedure targeting a 50%-correct threshold (Levitt, 1971). After completing the adaptive tracking, subjects were informed via written instructions on the screen that the level of difficulty during the main experiment would be very high (i.e., pitch differences between tones would be small) and that accuracy scores slightly above chance would denote reasonably good performance.
2AFC pitch discrimination task
Subjects were instructed to decide after each pair of presented pure tones during every part of the following experiment, which one was higher in pitch by pressing one button on the computer keyboard. They were encouraged to include the degree to which the respective tone was perceived as higher in pitch by using a rating between 1 and 6 (Fig. 1). Here, a rating of 1 corresponded to the perception of “the first tone being clearly higher in pitch” and a rating of 6 to “the second tone being clearly higher in pitch”. The mapping of response buttons was reversed for approximately half of the subject sample (9 of 19 subjects, in random order).

Trial structure, evoked responses, and entropy (WPE). Two 650 Hz pure tones were presented separated by a fixed ISI of 900 ms and followed by the response screen (top panel). The event-related potential (ERP) at electrode Cz (baseline −.5 to 0 s) is shown for trials in favor of the first (S1, purple) and the second tone (S2, orange) in the middle panel. Topographies correspond to the N1 time-windows after S1 and S2 indicated by grey shaded areas. Colors show averaged microvolt values. Entropy (WPE) is computed by taking small snippets of voltage data, transforming them to rank sequences and computing the entropy of their frequency of occurrence. This procedure is illustrated by the four boxes that connect ERP and WPE representations. Analogous to the ERP, average WPE time courses of both conditions are shown (bottom panel, baseline −1.5 to – 1 s). Colors used for topographies correspond to average WPE.
A first 150-ms tone (S1) was followed by a fixed 900-ms silent interval before the second 150-ms tone (S2) was presented. Subsequently, the response screen was shown until subjects entered their response with a limit of 2 s (Fig. 1). A grey fixation cross was presented throughout the trial and subjects were instructed to fixate their vision on it at all times. All visual content was presented and responses were recorded using custom MATLAB® scripts and the Cogent 2000 toolbox.
After an inter-trial-interval, randomly jittered between 1.5 and 4 s, the next trial started, indicated by the fixation cross changing its color from grey to light green and back to grey within 500 ms. The experiment consisted of a total of 500 trials, divided over five blocks of 100 trials each. The first trial of each block was started by the participants as soon as the experimenter had left the room. Blocks were separated by short breaks. After participants had completed the fifth block, the adaptive tracking paradigm was repeated. The experiment took about 60 minutes in total.
Bogus feedback was provided after each of the first 20 trials in every block, where, in 65% of all feedback trials, a positive feedback indicating a correct pitch discrimination was given. This proportion of positive bogus-feedback was chosen to keep participants engaged in the task and took into account a comparable previous research design (Bernasconi et al., 2011). In the case of trials involving bogus auditory feedback, the response screen was followed by a sound indicating correct or incorrect answers after 100 ms. Additionally, after every 20th trial, sham accuracy scores representing average performance in the past 20 trials, randomly chosen from a uniform [55;65]-% distribution were displayed on the screen for 3 s. Note that, for further analyses, all trials followed by feedback were excluded.
After the experiment, subjects frequently reported that they perceived pronounced pitch differences between the two (physically identical) tones. Before debriefing, no subject raised concerns regarding the actual nature of the stimuli. In fact, behavioral pilot experiments (n = 10) showed that even participants who knew that a high proportion of all trials would contain identical stimuli still reported to perceive considerable differences in pitch. In combination with previous experimental work that used identical stimuli in a comparable task structure (Amitay et al., 2006, 2013; Bernasconi et al., 2011) we are thus confident that participants paid attention to the task and engaged in it. Additionally, a computational modelling study that estimated the magnitude of perceived differences in similar tasks as pronounced as 8.5 Hz in 50 % of all trials and larger than 20 Hz in 10 % of all trials (Micheyl et al., 2009) supports the feasibility of such a task structure.
Behavioral data analysis
As expected with physically identical stimuli, only few participants exhaustively used the full range of “first vs. second tone had higher pitch” ratings (1–6). Most ratings were instead centered on the middle range (3–4) of possible ratings. The variance of responses over trials showed no correlation with participant age (r = −.068, p = .78). We thus binarized the rating responses and coded ratings 1–3 as “first stimulus chosen” and ratings 4–6 as “second stimulus chosen”. Proportions of both binarized response types were logit transformed (see EEG time- and frequency domain analyses) prior to statistical analysis to approximate normality for the originally [0;1]-bound proportions. To check for response bias (i.e. favoring one choice over the other), these transformed proportions were compared using a paired t-test.
Note that, in principle, participants could have used a complex cognitive response strategy instead of reporting perceived differences in pitch. Such a strategy, however, would likely result in non-random (i.e., auto-regressive) patterns of the response time series. To address and rule out this potential confound, we analyzed the sequence of given responses by computing their autocorrelations and comparing these to autocorrelations resulting from random permutations of participants’ response sequences. Precisely, each sequence of responses was permuted 1000 times, resulting in 1000 autocorrelations. Subsequently, for each trial lag, the proportion of correlation coefficients derived from random permutations that exceeded the correlation coefficient of the empirical autocorrelation was calculated. This proportion can be thought of as a p-value, which indicates a significant empirical autocorrelation if p < .05.
EEG recording and preprocessing
EEG was recorded with a 24-channel mobile EEG setup (SMARTING, mBrainTrain, Belgrade, Serbia) at a sampling rate of 500 Hz, a resolution of 24 bits and a bandwidth of 0–250Hz. Electrode impedances were kept below 10 kΩ. The amplifier was attached to the EEG cap (Easycap, Herrsching, Germany). Recordings were online referenced to electrode FCz and grounded to electrode AFz. All data and event-related triggers were transmitted to a nearby computer via Bluetooth where both were saved using the Labrecorder software, which is part of the Lab Streaming Layer (LSL; Kothe, 2014).
Offline, continuous data were bandpass filtered from 0.5 Hz (−12 dB attenuation at 0.03 Hz) to 100 Hz (−12 dB attenuation at 100.2 Hz) with a zero-phase finite impulse response filter (filter order 1200). Filtering and all other analysis steps were carried out in MATLAB® 2014b using custom scripts and the fieldtrip toolbox (Oostenveld et al., 2011). After re-referencing to average mastoids, we epoched the data from −2 s to +2 s around onset of S1. The first 20 epochs of every block were excluded from further analysis since they involved feedback. An independent component analysis was carried out and components related to eye-movements, muscle activity or heartbeat were identified and removed from the data on the basis of their time- courses, frequency spectra and topographies. Subsequently, remaining artefactual epochs were removed after visual inspection. On average, 43% (± 12% SD) of components and 7% (± 4% SD) of trials were removed.
EEG time-and time-frequency domain analyses
EEG data were separated into trials during which a response indicating the first versus second tone was perceived as higher in pitch. Time-locked averages (i.e., event-related potentials, ERPs) were computed for every participant and condition (first tone chosen vs. second tone chosen) separately.
To assess potential differences in ERP amplitude on the group level, we performed a cluster-based permutation dependent samples t-test (Maris and Oostenveld, 2007), comparing the ERP in trials with the first versus second tone chosen as being higher in pitch. This test first clustered t-values with p < .05 of nearby bins in electrode-time space, where a cluster consisted of at least three neighboring electrodes. The sum of all t-values in a cluster subsequently was compared against the distribution of 10,000 random clusters, which were generated by iteratively permuting the labels of conditions. The resulting p-value of a cluster corresponds to the proportion of performed Monte Carlo iterations that exceed the summed t-values of the respective cluster (Maris and Oostenveld, 2007; for an application see e.g., Wöstmann et al., 2015).
Time-frequency complex Fourier representations of the data were obtained by means of convoluting single-trial time courses with frequency-adaptive Hann-tapers of 4 cycles width. This was done separately for trials which ended with a decision for the first tone and trials with decision for the second tone. Oscillatory power from 1 to 30 Hz (in 1-Hz steps) was obtained by squaring the modulus of the Fourier spectrum. The average power estimate across trials was then baseline corrected and represented as change in Decibel (dB) relative to the mean power during a [–1; –0.5] s pre-stimulus time-window.
We then calculated Inter-trial-phase-coherence (ITPC; 0 ≤ ITPC ≥ 1) to test for differences in phase coherence between conditions. Note that ITPC can also be expressed as 1 – circular variance (e.g. Breakspear et al., 2010), where high ITPC values reflect relatively low levels of variance in the precise phase angle across trials at a given time and frequency. Thus, ITPC poses an across-trials proxy for neural noise. As a caveat, measures of phase coherence are strongly influenced by the number of trials on which they are computed (Ding and Simon, 2013). Hence, we used the same number of trials for each participant from both conditions to calculate ITPC and power estimates by randomly drawing trials from the condition containing more trials. For further metric and statistical analysis, the [0;1]-bound ITPC measure at every electrode e, time-point t and frequency f was transformed using the logit transform, an approach previously shown to outperform other transformation techniques for binomial and proportional data (Warton and Hui, 2011). This resulted in a [−∞; +∞]-bound measure of

Since a preliminary analysis had indicated condition-effects to cluster mainly in lower frequencies (Fig. 2A), time-frequency analysis was repeated from 1 to 15 Hz in steps of 0.33 Hz. Additionally, average normalized ITPC was calculated for each subject and condition, allowing for a direct assessment of condition differences (Strauß et al., 2015). Normalized ITPC here corresponds to the difference in ITPC between trials of one condition and average ITPC for every electrode, frequency and time-point for trials of all conditions (NormITPCcond1 = ITPCcond1 – ITPCall) first introduced by Busch et al. (2009). Analysis of condition differences using the same cluster-based approach outlined above on ITPC revealed one significant cluster. To test if the found effect in ITPC differed between age groups, the average condition differences in ITPC within the significant cluster were calculated for individual subjects. Subsequently, these S1–S2 choice differences in ITPC were correlated with participants’ age. For illustration only and as a reference for previous and future studies using separate age groups, the same data were also submitted to an independent-samples t-test with between-subjects factor age group (19–41 years vs. 49–74 years). The entire procedure (cluster test; followed by correlation with age) was performed to test for potential condition effects on oscillatory power.

Comparison of Power and ITPC between trials of differing decisions. A, Oscillatory power. Grand average oscillatory power change in decibel (dB, baseline –1 to –.5 s, averaged across subjects and electrodes) across frequencies is shown for both trials during which S1 was chosen (top left) and trials that ended with decisions for S2 (bottom left). Dashed lines indicate the onsets of S1 and S2. Similarly, grand average ITPC for both kinds of decisions is shown (right panel). B, Inter-trial-phase-coherence. ITPC in the theta-range (4.3–8.9 Hz) at S1 onset is higher for trials during which S1 was chosen as higher in pitch. Colors indicate z-values resulting from a cluster-based permutation dependent samples t-test that revealed a significant positive cluster (p = .03 starting at stimulus onset and lasting about 300 ms. Electrodes involved in the significant cluster form a fronto-central topography. C, Normalized ITPC. Normalized averaged ITPC (NormITPCcond1 = ITPCcond1 – ITPCall) from the significant cluster (left panel) and a comparable cluster around S2 (middle panel) is shown subject-wise for both conditions. Again, data from trials in favor of S1 are shown in purple. Participants’ data are sorted for effect size around S1, the same order is used around S2. Note that in the cluster around S1, all but three subjects show higher NormITPC when choosing S1. Around S2 however, the pattern is considerably scattered and nine subjects show an opposite pattern. This is also made clear by the grand average NormITPC over subjects which is shown in the right panel. Whereas the effect from the significant cluster is clearly visible and confirmed by a pairwise comparison (p < .005). Around S2 there is no difference between the NormITPC of both conditions. Error bars show mean (± 1 SEM, between subjects).
Information theoretic measure
Entropy is taken to quantify the information contained in a signal. Accordingly, a variety of entropy-based measures such as Shannon Entropy (Shannon, 1948), Kolmogorov-Sinai Entropy (Kolmogorov, 1968), Approximate Entropy (Pincus, 1991) or Sample Entropy (Richman and Moorman, 2000) has been suggested and has been used to estimate the complexity of natural time series data. Each of them however is constrained by required metric properties of the input data. In contrast, Permutation Entropy (PE) is a form of symbolic or rank-based entropy measure (Bandt and Pompe, 2002) that estimates the complexity of a time series while being robust against various degrees of non-linearity in the signal. Furthermore, PE takes into account the temporal structure of a signal and is computationally very efficient (Riedl et al., 2013). Permutation entropy is thus particularly attractive as an entropy measure for biological time-series as obtained with EEG, since these incorporate non-linear processes at least to some degree. Although a full introduction on the principles of entropy calculation is beyond the scope of this article, the basic rationale of PE (and, as used here, a weighted version of PE; WPE) shall be outlined briefly below.
The basic calculation of PE can be split up in three steps: First, data are divided into overlapping windows of reasonable size (e.g. 50 samples, but see Staniek and Lehnertz, 2007 for an overview of parameter selection for PE). Second, the time series data within the windows are mapped into symbolic space by dividing each window into short sub-sequences (e.g. 3-5 samples size, 1 sample distance) and calculating their ranks, resulting in so called motifs. Importantly, the number of different motifs that can occur is determined by the number of samples in one sub-sequence (motif length). Using a motif length of 3 for example results in 3! = 6 possible motifs. Third, the occurrences of each motif within each bigger time window are counted and their frequency of occurrence is used to calculate one Shannon Entropy value for each motif. These values finally are added to arrive at the PE of one window. Given a sufficiently high sampling frequency (i.e., if the number of samples within a window allows all possible motifs to occur more than once), PE can be calculated with high precision, still offering satisfying time resolution.
The defining feature of PE as compared to other entropy algorithms is that the calculation of PE is not based on the real values of the time series but on sequences of ranks, the so-called motifs. While this makes PE very robust against outliers and suitable for non-linear time-series, it disregards, by design, all metric information in a given data window. For example two windows containing the voltage (µV) measurements [−1,+0,+4] and [−20,+60,+150] would be mapped onto the same motif (1,2,3). To overcome this potential limitation, Fadlallah et al. (2013) proposed a weighting of occurrence frequencies that enter PE calculation: The relative frequency of occurrence of every motif is weighted by the variance of the data segments from which this motif was derived, so that its contribution to the resulting Weighted Permutation Entropy (WPE) is increased for increasing variance. As a result, WPE retains all features of PE but is more sensitive to abrupt changes in a signal as revealed by the application to both synthetic noisy time series and EEG-data (Fadlallah et al., 2013).
We calculated WPE following the same procedure as outlined above for the extraction of PE time courses: For each electrode and trial, WPE was computed using a sliding window of 50 samples (corresponding to 100 ms in the present data) that was shifted in steps of 10 samples (20 ms), a motif length of 3 and a time delay factor of 1. This resulted in entropy time-courses of 200 samples per trial. Importantly, this procedure was not only carried out on the basis of broadband voltage data but also after bandpass-filtering for the commonly used frequency bands delta (1–4 Hz), theta (4–8 Hz), alpha (8–13 Hz), beta (13–28 Hz), and gamma (30–70 Hz) with the help of Fieldtrip inbuilt bandpass filters.
Classification of perceptual decision outcomes
To predict perceptual decisions on the basis of variations in neural noise, a Gaussian naïve Bayes classifier was trained with single trial time-courses of WPE. Although naïve Bayes classifiers assume independence of features, an assumption poor in general and not necessarily true for biological time-series, they have been shown to perform as good as more complex, computationally more expensive classification schemes (Rish, 2001; Grootswagers et al., 2016).
In detail, 15 trials of a single participant were chosen randomly from each condition and set aside to serve as test trials later on. The remaining trials formed the training dataset. We balanced the amount of data that were used from each condition by only using as many trials as present in the less frequent one (resulting in 169 ± 31 trials per condition). To reduce the total number of features (e.g. electrodes and time-points) that were submitted to the classifier, a modified searchlight approach (Kriegeskorte et al., 2006; for an application in EEG see e.g. Obleser and Weisz, 2012) was used. Clusters consisting of five neighboring electrodes were extracted from single-subject data and the classifier was trained on 10 samples from every electrode (yielding 50 features) at once. This procedure was repeated for 22 clusters per subject.
To characterize the discriminative information of WPE time courses, we trained the naïve Bayesian classifier using a sliding window of 10 samples width (i.e., 200 ms) with 4 samples overlap. This resulted in a time-course of 48 predicted condition labels (first chosen vs. second chosen) from –2 s to +1.9 s relative to S1 onset. By comparing predicted labels and actual decisions, we calculated Hit-rate (HR), False-alarm-rate (FAR), accuracy and sensitivity (ACC, d’; Macmillan and Creelman, 2005) of the classifier. This classification scheme was repeated 50 times for each subject and the resulting matrices of average HR, FAR, ACC, and d’ were used to calculate bootstrapped 95% confidence intervals (10,000 repetitions) for each subject separately. We will use the term classification accuracy to refer to the percentage of trials for which the classifier correctly predicted participants’ decision. To allow for statistical evaluation of classification accuracy, an empirical single-subject chance level on basis of the minimum number of trials (169 per condition) was calculated and resulted in a threshold of 54.0% (α =.05; Combrisson and Jerbi, 2015; for applications see O’Sullivan et al., 2015 or Fiedler et al., 2016).
Neural noise as an interindividual marker of aging
To compare the degree of neural noise between subjects of different age, WPE on every electrode was averaged per subject over all trials and subsequently correlated with age. To relate the fairly recent measure of WPE to other, commonly suggested measures of neural noise (Voytek et al., 2015; Leenders et al., 2016), we also calculated the power spectral density (PSD) from subjects’ trial data using 2-s–windows (which overlapped by 50 %, yielding three PSD estimates per trial that subsequently were averaged). An individual linear fit across frequencies between 1 and 30 Hz (excluding the 8–13-Hz alpha range; Voytek et al., 2015) was obtained for the resulting PSD estimate. The slope of the resulting line can be used to estimate the degree of 1/f noise in the power spectrum (Bédard et al., 2006; Berthouze et al., 2010). In brief, a more uniform distribution of neural oscillatory power across frequencies (i.e., a shallower spectrum) is indicative of increasing neural noise. We thus expected flatter spectra and accordingly more positive regression slopes for older compared with younger participants. To test this, we calculated the Pearson correlation of age and the slope of the linear regression line fitted to the power spectrum.
Effect sizes
As a measure of effect size for t-statistics resulting from both dependent and independent sample simple t-tests, we calculated the requivalent (Rosenthal and Rubin, 2003) henceforth denoted as re. For multiple comparisons, e.g. when comparing electrode × frequency × time pairs, we averaged effect sizes of all t-tests within a significant cluster to estimate Re (Strauß et al., 2015; Wöstmann et al., 2015).
Results
Subjects compared the pitch of two identical pure tones and we were interested in (i) the patterns of neural noise in ongoing EEG activity that coincide with different perceptual decisions in the absence of physical evidence and (ii) how the patterns in question change with increasing age.
Behavior in pitch discrimination task shows response bias but no autocorrelation
The analysis of given responses revealed a higher proportion of trials during which the first stimulus was rated as higher in pitch (54% ± 6.7% SD) as compared to trials that ended with the contrary decision (46% ± 6.7% SD; t 18 = 2.6, p =.02, re = .52). This indicates that responses were not completely random overall but exhibited a bias towards perceiving the first tone as higher in pitch—an observation that finds a neural correspondence in the theta phase-coherence analysis reported below.
Importantly, the time-course of perceptual decisions was random, however, as revealed by the analysis of behavioral autocorrelations. Comparing serial autocorrelations of actual behavioral data with serial autocorrelations of randomly permuted sequences did not result in any significant differences (all ps > .5; FDR corrected). Thus, participant response behavior did not depend on previous responses or the position of a trial in an experimental block.
It is noteworthy that our data fully replicate results from Amitay et al. (2006, 2013), which were focused on the perceptual learning based on such physically identical stimuli: Participants here showed decreased frequency discrimination thresholds (i.e., were able to distinguish smaller frequency differences) after the experiment, as compared to before (t18 = 3.8, p = .001, re = .67). Since the topic of learning was not of prime importance to the current study, however, we did not include a control condition and thus refrain from further interpretation of these behavioral threshold improvements.
Theta-phase coherence predicts perceptual decisions
A cluster-based permutation test revealed that ITPC differed between trials with different perceptual outcomes and thus predicted the decision expressed later in a trial. A positive cluster, indicating significantly higher ITPC for trials during which the first tone was perceived as higher in pitch, was found around the time of exposure to the first tone, specifically from −40 to +300 ms peristimulus (p = .03, Re = .57; Figure 2). The cluster showed a fronto-central scalp distribution, comprising 10 out of 22 electrodes, and was limited to the theta band (4.3–8.9 Hz). Decisions for the first tone therefore were accompanied by higher theta phase coherence at frontal and central electrodes.
A reversed effect around the onset of the second tone could thus be expected (i.e. higher theta-band phase coherence around S2 when S2 would be chosen). To draw a fair comparison between S1- and S2-interval ITPC, we averaged normalized ITPC from both conditions across electrodes, frequencies and time points within the significant S1 cluster and compared it to a similar cluster around S2 onset (same electrodes as significant cluster, 4.3–8.9 Hz, 1020–1360 ms). As illustrated in Figure 2C, normalized and averaged theta ITPC at presentation of the first tone was consistently higher for decisions for the first tone (which is directly in line with the significant cluster), as confirmed by the results of a paired t-test (t18 = 4.1, p = .0006, re = .69). While no significant effect could be found around S2 (t18 = 1.1, p = .2, re = .25), nine of 19 subjects did show a pattern reversal, namely higher normalized ITPC around S2 for trials in which they later chose this second tone.
Note that the significant ITPC effect around S1 onset did not hinge on participant’s age: When comparing younger and older participants (19–41 years vs. 46–74 years) with respect to average theta ITPC difference in the significant cluster, no significant correlation (r = −.15, p = .58) nor an effect of age group was observable (t17 = .9; p = .3, re = .23).
ERP amplitude and oscillatory power do not predict decisions
It is also of note that neither evoked potentials nor total power differentiated between trials with decisions for the first versus second tone. First, no significant cluster was found when contrasting ERPs of the two different decisions on group level (cluster closest to statistical significance with p = .39, Re = .58; Fig 1). Second, revealed by a cluster test comparing oscillatory power (1-15 Hz), no electrode–time–frequency cluster showed a significant power difference between both conditions (Fig. 2A; cluster closest to statistical significance with p = .37, Re = .57).
Single-trial entropy predicts decisions
In order to relate trial-wise fluctuations of weighted permutation entropy to decisions, a naïve Bayesian classifier was trained with single trial WPE time-courses from clusters of five neighboring electrodes to predict participants’ decisions. Clusters were chosen on the basis of absolute distance and consisted of one electrode plus the four closest neighbors. As outlined above, overlapping windows of 10 samples from each electrode were used to train the classifier and predict decisions. The WPE time course is illustrated in Figure 1, depicting condition-wise, grand-average WPE data. Note the negative deflection of WPE after onset of S1, capturing a reduction of noise in response to stimulation that is in line with previous findings from different areas of electrophysiology (membrane potentials and spiking data: Churchland et al., 2010; EEG: Arazi et al., 2016).
Weighted permutation-entropy time courses from frontal electrodes led to above-chance prediction for 17 out of 19 subjects (Fig. 3C). Importantly, classification performance, i.e. sensitivity and accuracy, appeared to peak shortly before stimulus presentation as revealed by visual inspection of Figure 3A. In all individual subjects, WPE between –450 and –250 ms relative to S1 onset predicted the later decision with mean accuracies ranging from 52.1% to 62.7 %. As evident from visual inspection of Figure 3, both classification accuracy and sensitivity appeared to fluctuate above .5 and 0, respectively, even way before stimulus onset. Thus, a statistical comparison against an empirical chance level (54.0 %) rather than the chance level of single binary decisions (50 %) is required (see Materials and Methods).
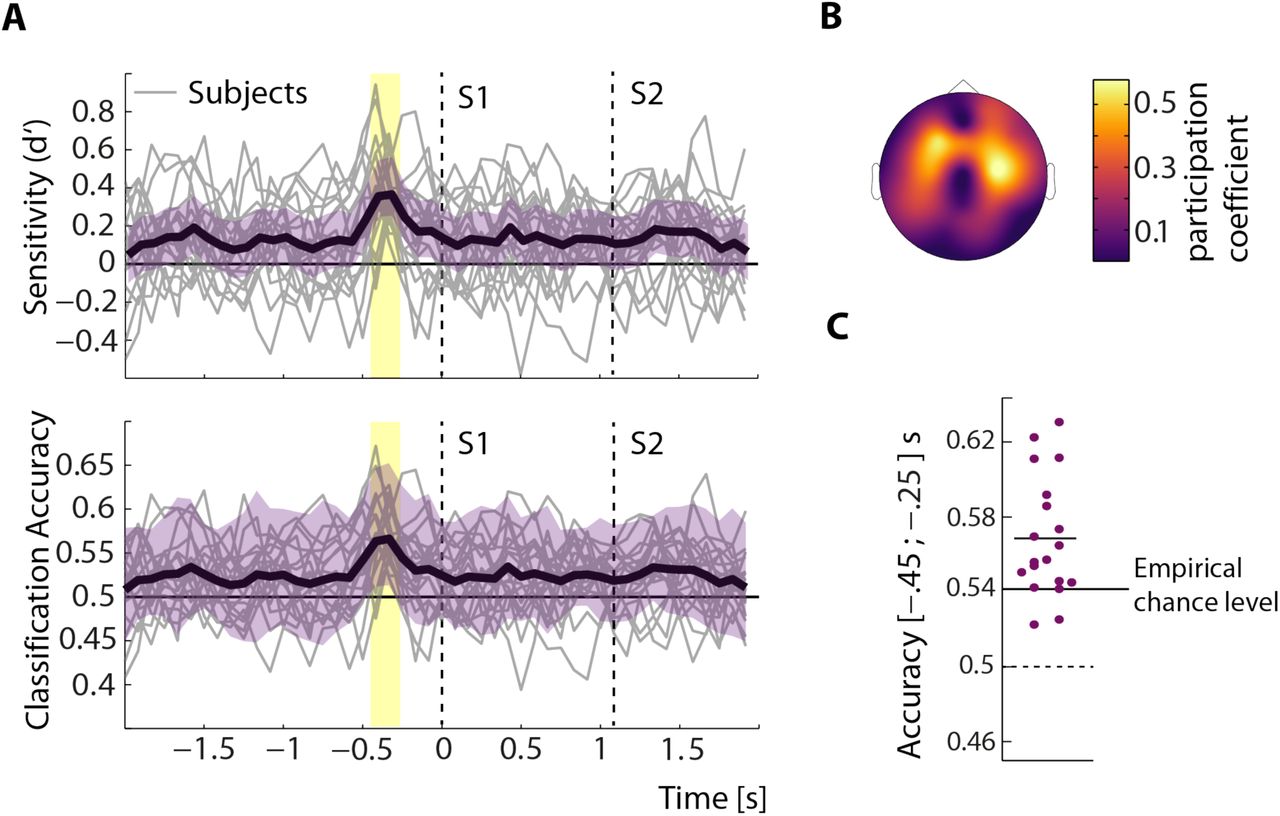
Classification performance. A, Time course of classifier performance. Time courses of bootstrapped sensitivity (d’, top) and accuracy (bottom) are shown for single subjects (grey lines) and on average (black lines) surrounded by average 95% confidence intervals (purple). Dashed lines indicate onsets of S1 and S2. Note the pronounced peak in both measures between 450 and 250 ms before S1 onset. Significant sensitivity and accuracy (p < .005, corrected for multiple comparisons) is denoted by the light yellow bars. B, Predictive topography. The average topography of electrodes involved in the best classifying electrode cluster is shown. Colors correspond to the probability of an electrode being present in the best cluster across subjects (participation coefficient). C, Average classification accuracy. Average accuracies of all subjects in the time window between –450 and –250 ms are shown. Short horizontal line indicates grand-average classification accuracy. Average accuracies in 17 out of 19 subjects exceeded empirical chance.
Filtering and potential backsmearing of post-stimulus activity is a notorious concern when interpreting pre-stimulus effects. Note, however, that first, we repeated all analysis steps without prior filtering in two randomly selected subject data sets and reproduced the decision-related WPE effect which renders a filter-induced time shift of information unlikely. Second, a backward shift is further rendered unlikely by no marked decision-related ERP difference being observed, and while a low-frequency (theta) ITPC effect was present at S1, the time-domain WPE effect is clearly high-frequency in nature (see further analyses below).
Average entropy changes with age and approximates 1/f noise
WPE averaged over entire trials on a wide range of electrodes was found to increase with age (Fig. 4A, p ≤ .05 at highlighted electrodes). As evident from visual inspection of Figure 4A, WPE at central electrode Cz showed the highest correlation with age (r = .73, p = .0004), an effect obviously also captured by a comparison between groups of older and younger subjects (t17 = 4.3, p= .0006, re = .72). The overall level of noise in the broadband EEG, as captured by WPE, increased with age.
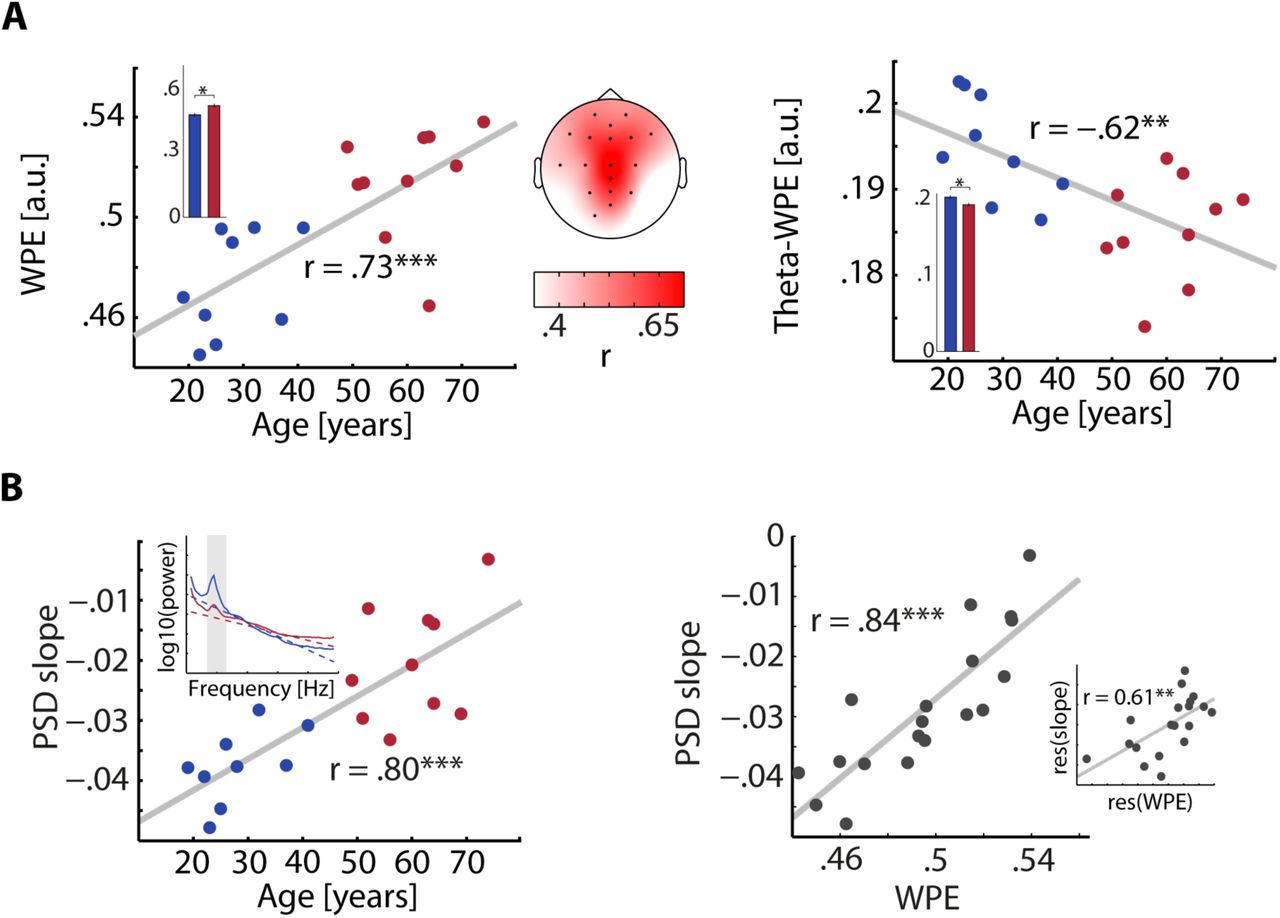
Age-related changes of WPE. A, Weighted permutation entropy changes with age. WPE of the broadband EEG-signal averaged over time, trials and conditions was positively correlated with age at multiple electrode sides (topography). Colors correspond to average correlation coefficients r. Broadband WPE on central electrode Cz increased with age (left panel). Single points denote subjects whose age group membership is color-coded in blue (younger) and red (older). The Group of older subjects also showed higher WPE on average (inset). WPE of the theta band EEG-signal decreased with age and older subjects showed lower WPE on average (right panel, inset). B, Weighted permutation entropy captures 1/f noise. The slope of the PSD (inset) over frequencies 1–30 Hz becomes less negative with increasing age (left). Again, younger subjects are shown in blue and older subjects in red. PSD slope and average WPE at central electrode Cz are highly correlated (right). The inset shows the correlation of PSD slope and WPE after residualizing for age. * p< .05; ** p < .01; *** p < .001.
As auditory evoked responses also peak at central electrodes and WPE is affected by amplitude fluctuations in the broadband EEG, we tested for confounding evoked-response amplitude changes. In a control analysis, we thus regressed out the amplitude of the N1 response (85–115 ms post-stimulus) from WPE before correlating residualized WPE with age. This control analysis confirmed the originally observed relationship (not shown).
As noted above, EEG power spectra are subject to changes across the lifespan. To quantify the degree of the expected twofold age-related changes in the power spectrum of EEG data, namely less power over lower frequencies and more power over higher frequencies, we separately correlated WPE of different frequency bands with age. Whereas WPE of the delta (1–4 Hz) band only slightly decreased with age (r = –.27, p = .3, not shown), WPE of the theta band (4–8 Hz) significantly decreased with age (r = –.62, p = .004; Fig. 4B) and was lower for the group of older subjects (t17 = –3.3, p = .004, re = .63). Thus, whereas entropy in low frequencies decreased with age, no age-related changes were found in higher frequency bands. Neither for alpha (8–13 Hz), beta (13–28 Hz), nor gamma band (30–70 Hz), WPE showed any significant alterations that accompanied aging (all p > .1). In sum, older subjects showed higher entropy in the broadband EEG, paralleled by a decrease of entropy specifically in the theta band.
This time-domain, entropy result was validated by an integrative measure of spectral shape: PSD slopes were more positive with increasing participant age (r = .80, p = 4 × 10⁻⁵; Figure 4B, left inset), with lowered power at low and higher power at higher frequencies, respectively. Notably, the similar effect could also be substantiated when correlating age with the PSD slope derived from higher frequencies (30–70 Hz; r = .56, p = .01; not shown) that have recently been suggested to capture changes in excitation–inhibition (E/I) balance (Gao et al., 2016). Since both WPE and PSD slopes potentially capture very similar mechanisms, namely an increase of 1/f noise that comes with age, we correlated both measures and found a strikingly linear relationship (r = .84, p = 8 × 10⁻⁶, Fig. 4B, right). Importantly, this relationship of the time-domain WPE measure and the spectral-domain PSD measure of neural noise retained a substantial effect size even after controlling for age (r = .61, p = .006, Fig. 4B, right inset).
Discussion
Perceptual decisions in the absence of evidence should be driven by fluctuations in the neural state of the brain, that is by variations in neural noise. Here, we tested the potency of different markers for neural noise in the human EEG to predict discriminative decisions between two identical tones. Results can be summarized as follows: First, higher inter-trial-phase-coherence at the first tone onset in the theta (4–8 Hz) range accompanied decisions for the first tone. Second, single-trial time-courses of broadband weighted permutation entropy (WPE) predicted participants’ decisions above chance. Lastly, average broadband WPE increased with age and exhibited close relations with a temporally more coarse spectral measure of 1/f noise.
Theta band phase-coherence differentiates between decisions
We found decisions for the first tone (S1) to coincide with higher fronto-central theta ITPC starting at the S1 onset and lasting about 300 ms. Topography and timing of the effect point towards auditory evoked components likely originating from auditory cortical regions (Scherg et al., 1989). Ongoing phase of pre-stimulus theta-oscillations at and before stimulus onset alters perceptual performance (e.g. Busch et al., 2009; Busch and Van Rullen, 2010). However, our ITPC effect appeared after S1 onset. This suggests that the neural processing of S1 drives the perceptual decision rather than changed perceptual thresholds influenced by pre-stimulus phase.
If ITPC and the ERP show similar effects, it is likely that a possible source of both effects is a phase reset (Sayers et al., 1974; Makeig et al., 2002; see Sauseng et al., 2007 for a review) or additive power (Min et al., 2007). Importantly, our observed difference in ITPC was not accompanied by a difference in the ERP. Thus, our ITPC effect can be understood as an across-trials measure of neural oscillatory noise with higher ITPC depicting stronger coherence and less noise across trials.
If phase-coherence in the response to S1 influenced its perception, an analogous effect should have been present around S2 (higher phase coherence when S2 was chosen), which we did not find. This is not surprising, as the auditory response to repeated stimuli cannot fully recover with ISIs shorter than several seconds (Sams et al., 1993; Mc Evoy et al., 1997; Tavabi et al., 2007).We would thus expect that the ITPC effect after S1 should fully reverse after the onset of S2 if tones were separated by longer onset asynchronies.
Neural noise predicts perceptual decisions
In the temporal domain, we found neural noise as quantified by entropy (WPE) of the broadband EEG-signal from fronto-bilateral electrodes and pre-stimulus (–.45 to –.25 s) to be most predictive of the listener’s later decision. The topography of this effect is well in line with results from previous studies on perceptual decision-making in the face of sensory ambiguity (e.g. Busch et al., 2009; Strauß et al., 2015; Wilsch et al., 2015). Here we consider two potential sources of these fluctuations in neural noise. First, noise in auditory cortical regions fluctuates independent of stimulation (Lakatos et al., 2012) and impacts the processing of auditory stimuli (Schroeder and Lakatos, 2009; Strauß et al., 2015). While perceptual processes have been linked to influences of spontaneous variations in oscillatory power (e.g. Boncompte et al., 2016; Kayser et al., 2016) and phase (Hanslmayr et al., 2007; Busch et al., 2009), we here state first evidence for the involvement of fluctuating neural noise. Changing neural states prior to stimulation might reflect subtle variations in excitability which impact the processing of sensory evidence and this way influence later decisions. A higher degree of noise might indicate a brain state upon which tones will be processed more thoroughly, allowing for a deeper encoding.
Second, a participant’s degree of attention to the task certainly fluctuates during the course of the experiment. Previous research has shown that perceptual decisions are likely influenced by varying attentional resources (e.g. Wyart and Tallon-Baudry, 2009). If S1 onset coincides with high pre-stimulus noise, possibly reflecting attentional resources, it should be processed more thoroughly, and chosen at the end of the trial. However, such an influence of attention-modulated processing should be evident in patterns of oscillatory power (Klimesch et al., 1998; van Gerven and Jensen, 2009) and average evoked responses (e.g. Picton and Hillyard, 1974). Thus, we deem the impact of fluctuating task-directed attention on the processing and perception of identical tones insignificant, although we cannot foreclose it completely.
Neural noise changes with increasing age
As hypothesized, we found average WPE to increase with age. Older subjects thus showed higher degrees of noise in the broadband EEG. Interestingly, this age-related increase of noise was most prominent over central electrodes forming a cluster resembling auditory evoked responses, likely tracing back to the nature of the task (Fig 4).
Conversely, noise within the theta-band did not increase but decrease with age (Fig 4). Theta oscillations are linked to late evoked responses (e.g., the P1 and N1; Klimesch et al., 2004), which change in amplitude and latency with age (Pfefferbaum et al., 1980; Herrmann et al., 2016). Although both amplitude and latency differences might affect WPE, our control analysis revealed that the age-effect on WPE remained when controlling for P1-N1 amplitudes. Thus, and due to the absence of ERP-differences between age-groups, we deem it likely that the observed increase in WPE is in fact a time-domain reflection of a relative enhancement in higher-frequency noise in the signal (McIntosh et al., 2014; Voytek and Knight, 2015).
If that is the case, which structural and functional changes mediate these age-related alterations in neural noise? During aging, the loss in number of neurons (Morrison and Hof, 1997) is negligible, especially compared to the age-accompanying damage of white matter integrity (Sullivan et al., 2010) which among other modifications is responsible for a decline of large-scale structural networks. Importantly, the connectivity of higher-order as well as sensory functional networks shrinks with age (Andrews-Hanna et al., 2007; Geerligs et al., 2015). A shallower power spectrum thus might not only reflect higher degrees of 1/f noise (Voytek et al., 2015; Leenders et al., 2016) but also a decreased utilization of long-range neural networks (Meunier et al., 2009) and a parallel increase in local processing (Sleimen-Malkoun et al., 2015). Increased noise in older brains during an auditory discrimination task therefore, by proxy, also points towards reduced connectivity in functional networks.
Additionally, age-related changes in the slopes of power spectra over higher frequencies (30–70 Hz) have recently been shown to dynamically track changes in the excitation-inhibition (E/I) balance via a positive relationship between PSD slopes and E/I ratio (Gao et al., 2016). Older brains thus might show increased E/I ratios as compared to younger ones. Illustrated by the almost perfect linear relation of average WPE and PSD slope (Fig. 4B), both similarly capture global changes in neural noise, that is, they describe age-related alteration as a neural trait. As outlined above, unlike PSD, WPE additionally offers information regarding neural noise on a trial-wise, time-resolved basis and thus allows estimating neural states. Our findings of neural states influencing perceptual decisions and neural traits changing with age illustrate the great potency of the WPE as a measure of neural noise and its role in perceptual processes and the aging neural system.
Lastly, and of at least indirect relevance to the present study, age is accompanied by hearing loss and changes in attentional capacity. Hearing-loss is a notorious source of reduced acuity and thus of increased noise in neural communication (e.g. Pichora-Fuller et al., 2007), but it is hard to conjure how such increases in directly auditory-related neural noise would confound the within-subject, perceptual decision-making findings we present here. Also, the across-subjects, age-related changes in average WPE cannot be explained by the auditory-evoked parts of the neural signal (see above). With respect to declining attentional capacities (e.g. Wöstmann et al., 2015), we believe their influence to be negligible due to the relatively low attentional demands of the present task (two tones, approx. 1.6-s trials) and the highly aggregated nature of averaged WPE.
Ultimately, future experiments will have to link more tightly studies of neural noise (Garrett et al., 2014; Voytek et al., 2015) with behavioral variability. Age-related increases in broadband neural noise should manifest in behavior, presumably via a change in behavioral variability. In line with the few extant studies (Lövdén et al., 2007; Schmiedek et al., 2009) we observed lowered behavioral variability accompanying higher noise in a post-hoc analysis (data not shown). Although additional experiments are needed to clarify this relationship, there is now increasing evidence for a tight coupling between changing neural traits and related behavioral patterns.
Conclusions
In sum, we have shown that two complementary neural noise measures, across-trials phase-coherence of theta (4–9 Hz) oscillations and a within-trial information-theoretic measure (weighted permutation entropy) allow us to predict participants’ decisions when comparing physically identical tones. We also find the overall level of neural noise to increase with participants’ age, most likely reflecting changes to an excitation–inhibition balance. Our data demonstrate that neural noise not only characterizes behaviorally relevant brain states, but also captures trait-like changes with age.
Conflict of interest
The authors declare no conflict of interest.
Acknowledgements
Research was supported by the Volkswagen foundation (to JO; BIT-CHAT) and the European Research Council (to JO; ERC-2014-CoG AUDADAPT).


