

Abstract
A thermodynamic method for computing the stability and dynamics of chromatin loops is proposed. The CTCF-mediated interactions as observed in ChIA-PET experiments for human B-lymphoblastoid cells are evaluated in terms of a polymer model for chain folding physical properties and the experimentally observed frequency of contacts within the chromatin regions. To estimate the optimal free energy and a Boltzmann distribution of suboptimal structures, the approach uses dynamic programming with methods to handle degeneracy and heuristics to compute parallel and antiparallel chain stems and pseudoknots. Moreover, multiple loops mediated by CTCF proteins connected together and forming multimeric islands are simulated using the same model. Based on the thermodynamic properties of those topological three-dimensional structures, we predict the correlation between the relative activity of chromatin loop and the Boltzmann probability, or the minimum free energy, depending also on its genomic length. Segments of chromatin where the structures show a more stable minimum free energy (for a given genomic distance) tend to be inactive, whereas structures that have lower stability in the minimum free energy (with the same genomic distance) tend to be active.
Introduction
In eukaryotic cells, detailed experimental identification of the structure of chromatin fiber inside of the cell has revealed considerable higher order organization and packaging in a hierarchical fashion [1–12]. Structural determination strategies have forged ahead with a number of high-throughput methods to obtain genome-wide maps of chromatin organization; e.g., chromatin interaction analysis by paired-end tag sequencing (ChIA-PET) and high-throughput chromosome conformation capture (Hi-C) [6,13]. Recent work has centered on including chromatin immunoprecipitation (ChIP) with ChIA-PET for specific protein factors (e.g., CTCF and RNA polymerase II) [2], offering structural information at a resolution of 1000 base pairs (1 kbp), given sufficient sequencing statistics. In general, a resolution of 1 kbp is now achievable as specific target proteins can be isolated – pushing whole genome structural resolution into the range of 50 nm. However, the experimental data reflects an ensemble of structures; i.e. the interaction data is collected typically from around 100 million cells, each having a different three-dimensional structure of nucleus. Moreover, chromatin itself is a dynamic system that can take on a variety of structures and thermodynamic states over time. Unlike many protein and RNA structures that often take on a rather definite average shape (or shapes), the structural features of chromatin are more plastic and require clustering to extract meta-structures. Therefore, identifying structural motifs of the chromatin chain and estimating the likelihood of particular motifs within the ensemble is now possible to explore.
Chromatin is a complex heteropolymer comprised of many different components. Double-stranded DNA (dsDNA) in eukaryotic organisms is bundled into packages called nucleosomes: a structure consisting of two full turns of the dsDNA (about 150 bps) around an octamer of histone proteins forming a core of the nucleosome. The octamer contains a tetramer core (H3–H4)2 with a dimer of H2A–H2B capping each side of this wrap [14]. Connecting each octamer is a H1 subunit consisting of various subtypes. The globules of dsDNA/histones (the nucleosomes) form the chromatin fiber that comprises the genome. At the scale of nucleosomes, the structure of the chromatin fiber is thought to be somewhat random [9,15–18]; however, there also appears to be significant global organization [19–22]. The three billion base pairs (3 Gbp) of DNA of the human genome packaged as chromatin fiber could stretch out to roughly two meters [2,18] with a diameter of about 10 nm (e.g., PDB id: 5DNM, 5B31, 5KGF, etc.).
Here we analyze data at the resolution scale of 5 kbp beads, a scale where the beads comprising a chain can be treated within beads on a string polymer model; each 5 kbp genomic segment is represented as single monomer. The 3D topology of chromatin is thought to influence the regulation of gene expression and regions of active and repressedtranscription in the cell, where diverse parts of the chromatin fiber can be found in proximity of each other [2– 4, 23–26] in what are known as chromatin loops. One part of such a proximal chromatin segment contains the promoter(s) of a given gene, whereas the second part is enriched with enhancer DNA sequence(s), which amplify the transcription rate of a specified gene [27]. The interaction between the two ends of a loop is mediated by CTCF proteins that stabilize the interaction by forming a dimer with parallel orientation of both protein components [1,2,19]. Multiple loops can co-localize within the same three dimensional genomic loci; the process is mediated by many CTCF dimers that form together CTCF islands, or rafts (see Fig 1E). Such proximate collections of loops are defined here as chromatin contact domains (CCDs), similar to the term topologically associating domains (TADs), which is used widely in the field of 3D genomics. Such CCDs sizes often range between several kbp to several Mbp and show considerable similarity between cells and/or stages of cell development [2,3,23,24,26].
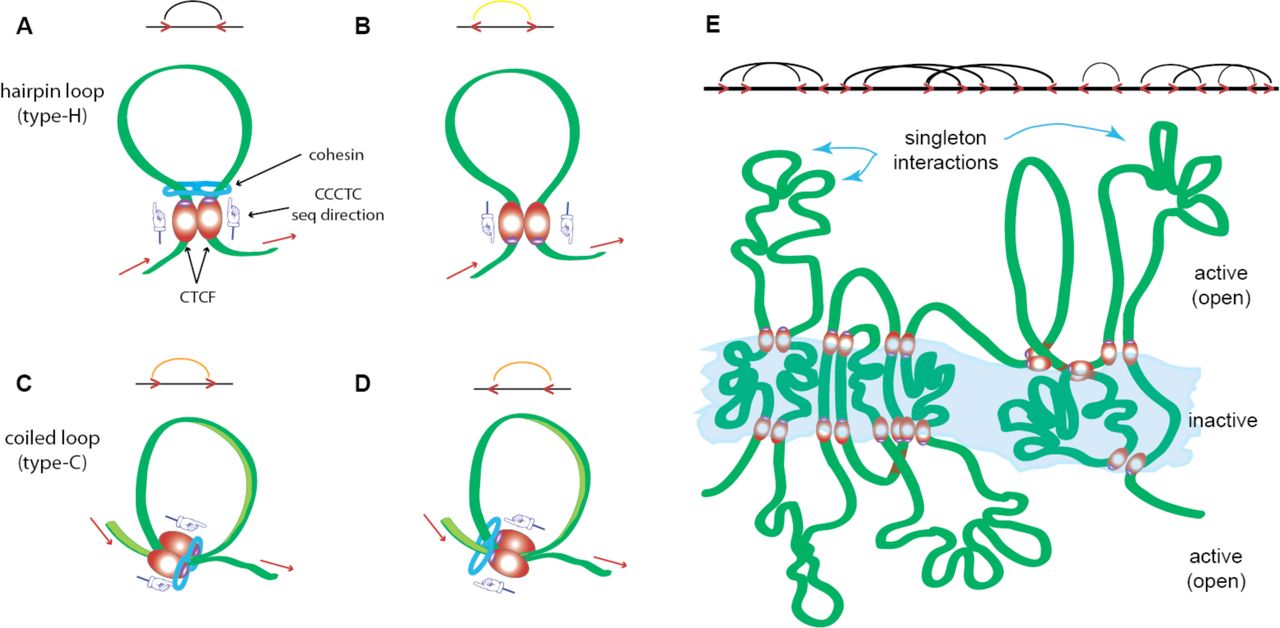
Examples of various types of loops formed by CTCF dimerization and its interactions with chromatin. (A) A convergent loop, (B) a divergent loop, (C) a tandem right loop, (D) a tandem left loop, and (E) combinations of A-D in the form of CTCF islands (a cartoon, but characteristic of regions like Chromosome 10). The 5′ to 3′ direction of the sense strand of the DNA sequence is indicated by the red arrows, cohesin is indicated by the blue feature enclosing structure, and the implied sequence direction for the CTCF motif is indicated by the directional pointers. The additional structural features are elaborated on in Figs S2-S4 (in Supplement).
The CTCF dimers combined with two cohesin ring-like multi-domain structural proteins binding in a parallel direction as a multi-protein complex. The attachment to the chromatin chain can occur in an antiparallel or parallel direction at the loop anchor points – depending on the direction of the zinc fingers binding in the underlying DNA sequence motif. The most frequent and strongest interaction is the convergent loop (Fig 1A), where the chromatin chain is anchored in an antiparallel direction with the CTCF dimer bound in a parallel direction so as to point into the loop (Fig 1A). Divergent loops [26] occur when the orientation of the CTCF dimer is in the opposite direction (Fig 1B). When the direction of the chromatin chain binds in a parallel interaction with the CTCF dimer, two types of structures of equal tendency and intermediate strength are suggested: tandem right (Fig 1C) and tandem left (Fig 1D) [2]. In general, 80% of the loops appear to be convergent [2]. These CTCF structure also appear to group into islands as shown in Fig 1E, where the central region is the largely insoluble and inactive part (heterochromatin) whereas the regions jutting out are more accessible to transcription factors and therefore active (euchromatin).
Therefore, we have opted to call these features structural motifs and formalize a notation for them; Fig 1 and Figs S2-4 (Supplement). Fig 1 consists of various types of CTCF-mediated loops and their combination into islands. Figs S2 through S4 (Supplement) show various types of singleton structural motifs or combination of singleton and CTCF or RNA Pol II interactions: simple loops, internal loops and multiloops as well as parallel and antiparallel stems and pseudoknots. The color scheme in Fig S2D indicates the strength of the interactions (black is maximum counts/minimum free energy).
In recent years, there has been considerable interest recently in finding ways to model the distribution of chromatin structure physically using various approaches such as population-based analysis [28] and polymer based models using molecular dynamics (MD) simulations [1,2,11,12,29,30] or Monte Carlo (MC) simulation techniques [8]. These models provide 3D structures of the chromatin. However, MD or MC simulation techniques do not guarantee an exhaustive search of such a large landscape for chromatin structural motifs, nor is it easy to say that a structure found in this way is actually the most stable structure [28].
In this work, based upon the observed contacts (referred to as the pair interaction frequency (PIF)) of the chromatin fiber contacts obtained from ChIA-PET data, we have developed a free energy based model with suboptimal structures that extracts the major part of the Boltzmann distribution of the ensemble of chromatin structural motifs distinguished in terms of singletons, CTCF (or RNA Pol II) binding sites and multimeric CTCF islands. The approach handles complex motifs such as pseudoknots (involving both parallel andantiparallel chain interactions) using heuristic adaptations to the DPA. Based on the observed PIF ensemble found in heatmaps obtained from ChIA-PET [2], or in situ Hi-C experimental data [6,26], we transformed the PIF information into binding enthalpy and combined this with a highly flexible contact (cross-link) based entropy model that was shown to be rather successful for solving RNA secondary structure and pseudoknot structures [31–34]. We make here the underlying assumption that chromatin at the highest resolution (around 1 kbp resolution) can be characterized by a 2D representation of complex structural motifs as a kind of meta-structure not so unlike what is observed of proteins and RNAs.
Using CCDs, we were able to identify loops within the chromatin structures that tended to show activities consistent with such a free energy model. Hence, ensembles that have a dominant structure (a stronger free energy with large differences in the thermodynamic probability between the principal structure and neighboring structures in the list) tend to be inactive on the one extreme. Ensembles with several conformations of nearly equal weight–a weaker free energy (FE) and small differences in the thermodynamic probability between very diverse structures – tend to be active structures.
Results and Discussion
There are two objectives in this work. The first is to use polymer physics to obtain information on the dominant stable structural motifs of a given ensemble of observed contacts from a particular cell line (GM12878) and to discern the dynamics of the chromatin. The second is to use this information to identify regions of active euchromatin and inactive heterochromatin.
The contact map data obtained from experiments provides us with a picture of the collection of observed contacts (ensemble) within the large population of cells. The thermodynamics of polymers provides us with an understanding of the influence of any given collection of contacts on the observed structure (or structures) in the ensemble in the form of a statistical weight; i.e., the Boltzmann distribution. The resulting structures are 2D because what is observed is not one specific 3D structure, but individual contacts between diverse parts of the chromatin fiber. Using thermodynamics distinguishes the relative contribution from different contacts and the likelihood of particular structures. This in turnpermits some picture of the like dynamics of chromatin from the experimental data using the thermodynamic probability of different structures.
In this model, we assume that the observed frequency of contacts is identical for every cell. Most likely, when millions of cells are measured, each particular cell will have common housekeeping genes where the expression is identical, but particular states of the cell that reflect that particular conditions of that given cell. The configuration of these particular states is largely unknown. However, since the CTCF contacts are the source of the major interactions, in any particular loop study, it is possible to turn on and off these interactions and fit the observed ensemble of cells. This will be a matter that will be addressed in future work.
When one particular structure dominates all the other structures by a substantial margin, this means that most of the time, the structure remains fixed with the given set of contacts and all the other configurations are occasional or incidental. This is a property that one would expect of heterochromatin, the densely packed regions of chromatin where very little expression occurs. This may be regions where in a particular part of the life cycle of the cell, the chromatin is not used, such as developmental genes in an adult, or it can be regions of the chromatin that are only expressed when the cell is under stress. We would expect that a very prominent structure is indicative of very little dynamics; i.e., tightly packed. When a few very similar structures dominate the distribution, we would assume from this ansatz that the chromatin is shifting between various states but is only somewhat dynamic. When there are many diverse structures that have rather similar probabilities, then we can assume that there is very little differentiation between such the regions of chromatin. This latter condition would be what is characteristic of euchromatin, regions where there is generally a lot of gene expression and where the structures are open and ready for transcription.
Fig 2 shows an example wherein Fig 2A shows the observed contact map, Fig 2B shows the dominant contacts found with the polymer model developed here, and Figs 2C show a 2D representation of the minimum free energy structure. Many features of the original heat map are observed in the thermo dynamic distribution, indicating a reasonable correspondence between the observed frequency of contacts and the actual distribution of structures that results.

An example of contacts within a loop obtained from PET clusters and the weighted thermodynamic distribution of those structures based on the assumed polymer behavior of the chromatin. (a) The original heat map of the data obtained from ChIA-PET data. (b) The analysis using of predominant structures based on the Boltzmann distribution. (c) The dominant structure found in the distribution. (d) The second most dominant structure.
Fig 3 is a more complex structure showing both parallel strands and CTCF islands. Fig 3A shows the observed contact map and the 1D structural notation, Fig 9B shows the dominant contacts found with the polymer model developed here with the sequence also shown for comparison, and Figs 3C shows a 2D representation of the minimum free energy structure. The 3D structure can be obtained by fitting these structures to a polymer model with restraints.

Result of A more complex structure in which the structure form CTCF-islands. This also shows an example of contacts within a loop obtained from PET clusters and the weighted thermodynamic distribution of those structures based on the assumed polymer behavior of the chromatin. (a) The original heat map of the data obtained from ChIA-PET data. (b) The analysis using of predominant structures based on the Boltzmann distribution. (c) The dominant structure found in the distribution. (d) The second most dominant structure.
This general correspondence permits us a means to examine the condition of the chromatin in the nucleus of the cell. In this perspective, it is assumed that regions that are inactive have very stable structures – the structure with the minimum free energy (mFE) is significantly more stable (for a given genomic distance) and the distribution of alternative structures of similar free energy are few. This means there is little chance that such chromatin will be found unpacked. Likewise, if the region is active, then the mFE structure is one of many of similar probability. This would tend to be a consequence of the chromatin being dynamic, with no particular structure heavily dominating the ensemble.
Therefore, the thermodynamic probability of a given structure relative to others should be a helpful measure of to what extent that particular region of chromatin is heterochromatin or euchromatin. We were further able to show that the free energy landscape is highly predictable can and be used to identify active and inactive regions of chromatin based upon genomic distance and free energy (Figs S7 through S10).
Conclusion
We have introduced a computational algorithm for estimating the structure and dynamics of chromatin loops by analyzing the thermodynamic probability of the minimum free energy structure. This permits learning the actual structure of the chromatin in terms of 2D structural motifs. Significant correlation was suggested by the tendency of known active structures to show a less stable mFE, indicating that the observed structure of chromatin within the ensemble should be changing regularly with a high probability; likewise, theinactive regions tended to show structures with a very large mFE with respect to genomic distance. This algorithm may help serve as an aid in determining the relative activity of the chromatin based upon the stability of the structure.
Acknowledgements
DP, WD are supported by grants from the Polish National Science Centre (2014/15/B/ST6/05082 and 2013/09/B/NZ2/00121), the European Cooperation in Science and Technology action (COST BM1405 and BM1408). DP is supported by funds from National Leading Research Centre in Bialystok and the European Union under the European Social Fund. All authors were supported by grant 1U54DK107967-01 “Nucleome Positioning System for Spatiotemporal Genome Organization and Regulation” within 4DNucleome NIH program.
References


