

Abstract
Transcriptionally active genes contain acetyl-rich chromatin and are organized in distinct nuclear compartments that are spatially separated from transcriptionally inactive genes. It is not known how this compartmentalized acetylated chromatin is targeted and regulated by chromatin remodelers such as PBAF. Thus, we sought to understand how PBAF targets chromatin and modulates compartmentalization of transcriptionally active genes using live-cell single molecule fluorescence microscopy. Our work reveals chromatin hubs throughout the nucleus where PBAF cycles on and off the genome. Deletion of PBAF’s bromodomains impairs recognition of hubs and cycling on chromatin. Interestingly, markers for transcriptionally active and inactive genes can be found in compartments harboring acetylated chromatin at the periphery that is selectively recognized by PBAF via bromodomains. Defects in PBAF’s peripheral targeting lead to a select reduction in the size and number of compartments containing transcriptionally active genes. Our data, combined with previous work in Yeast and Drosophila, suggest that PBAF activity serves as a barrier to heterochromatin spreading. Overall, our findings suggest that chromatin compartments are highly structured with unique peripherally associated acetylation marks. PBAF utilizes these marks to help shape nuclear compartments containing transcriptionally active genes, thereby aiding genomic organization.
Introduction
Hi-C studies have shown that genomic regions spanning up to a megabase, contain transcriptionally active genes rich in acetylated chromatin that are grouped together in “A” compartments1, 2. Neighboring “B” compartments contain inactive chromatin with repressive epigenetic marks and are segmented away from A compartments2. High resolution Hi-C maps further identified a second level of local genome organization consisting of topologically associated domains (TADs) spanning sub-megabase regions and loop domains. High-resolution imaging using DNA-FISH in fixed cells has also spatially identified distinct active and inactive compartments that corresponded with genomic studies3, 4.
A number of recent genomic studies have linked dynamic changes in genome topology with chromatin states and gene regulation during cellular stress, cell reprogramming and viral infection5–7. Specifically, transcription factor binding and expression of stress response and developmentally regulated genes are often linked to A/B compartment switching at the end of these genes and boundaries between select TADs5–7. However, it is unclear how transcription factors dynamically recognize and alter these A/B compartment boundaries to regulate genome topology at the single cell level.
PBAF, an ATP dependent chromatin remodeling complex, regulates transcription of stress response genes in Humans, C. elegans and Yeast via bromodomain dependent targeting of acetylated chromatin at promoters8–10. The yeast homolog of PBAF, RSC, has also been shown to alter genome topology likely via modulation of chromatin state and transcription at genes within the boundaries between chromatin domains11. Therefore understanding how PBAF dynamically recognizes different chromatin states in genomic compartments in vivo may lead to a greater understanding of the spatial and dynamic regulation of transcription and genome topology.
Recent live-cell imaging studies indicate that a number of transcription factors (e.g. RNA Polymerase II, Mediator and Sox2) dynamically bind chromatin as clusters to form hubs that regulate local gene expression12–17. However, such dynamic activity of transcriptional regulators, including chromatin modifiers, within distinct chromatin compartments is currently poorly characterized due to a number of technical limitations. In particular, researchers lack efficient methods to identify and quantitatively characterize chromatin in active/inactive compartments in live cells.
To spatially distinguish and characterize different chromatin compartments in vivo, we used live cell Single Molecule Tracking (SMT) to dynamically map genomic binding of PBAF alongside markers of transcriptionally active (H3.3) and inactive (HP1α) genes. Our dynamic imaging studies reveal small hubs where PBAF cycles on and off chromatin, which can be further grouped to form large compartments. We next sought to address the pivotal question of how distinct compartmentalized chromatin states are targeted by PBAF. Thus, we investigated PBAF’s spatial distribution, velocities and stability on chromatin when encountering H3.3 and HP1α marked compartments. More importantly, we have assessed the role of PBAF’s bromodomains in hub targeting, cycling on chromatin, select compartment engagement and genomic organization. Overall, our studies provide new insights into dynamic chromatin targeting of PBAF via bromodomains, which regulates compartmentalization of transcriptionally active genes to aid in genomic organization.
Results
PBAF targets chromatin in distinct nuclear hubs and compartments
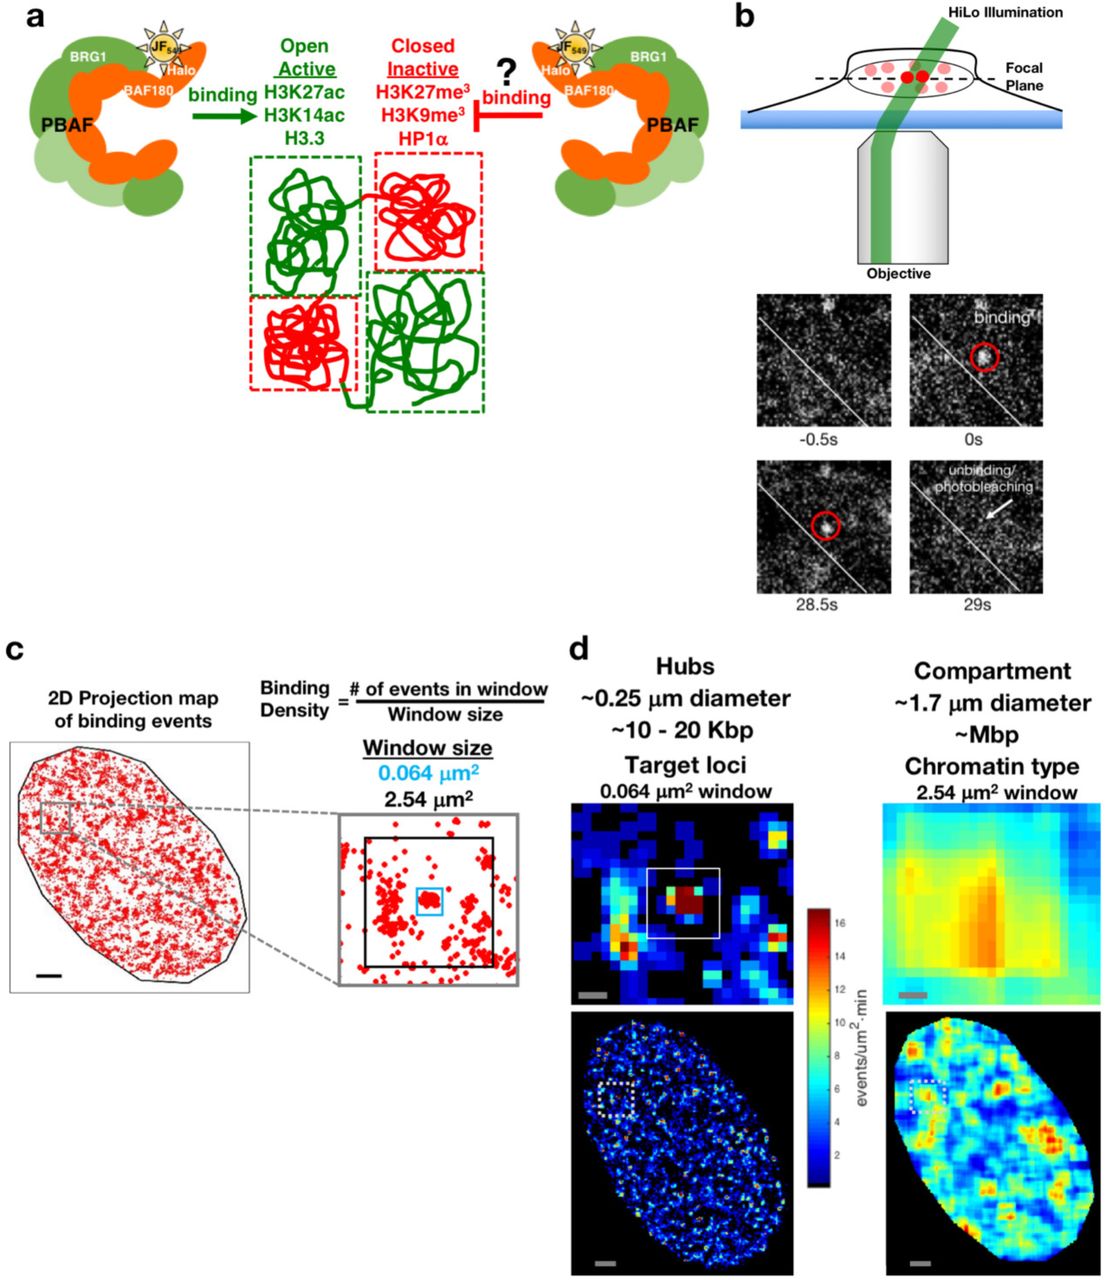
Active genomic compartments are enriched in acetylated chromatin and transcriptionally active genes1, 18. PBAF targets a variety of acetylated residues, including H3K14ac and H3K27ac, on chromatin via its 8-12 bromodomains based on in vitro studies19, 20. Therefore, we hypothesized that PBAF would dynamically localize to discrete nuclear compartments that were enriched in acetylated chromatin in vivo (Figure 1a).

(a) Transcriptionally active genomic compartments (green) contain open chromatin structures associated with acetylated histone marks (e.g. H3K27ac & H3K14ac) and the H3.3 histone variant. Transcriptionally inactive genomic compartments (red) contain closed chromatin structures associated with select methylated histone marks (e.g. H3K27me3 & H3K9me3) and heterochromatic protein HP1α. PBAF contains multiple bromodomains within the BAF180 subunit known to bind acetylated histone marks associated with open chromatin compartments.
(b) Motion Blur HiLo microscopy (top panel) of a single U2OS cell stably expressing Halo-BAF180 WT. PBAF containing Halo-BAF180 WT molecules that rapidly diffuse in the nucleoplasm are blurred, while chromatin bound PBAF appears as single bright spots (highlighted by red circles, lower panels). Disappearance of a spot (white arrow) is due to unbinding or dissociation of PBAF from the chromatin.
(c) Strategy for measuring the non-homogeneous localization of PBAF chromatin binding events in a nucleus. A 2D projection map of PBAF binding events (red dots) in the nucleus over 18 minutes of imaging is shown. A grey box (left panel, zoomed view in the right panel) outlines a representative window of PBAF binding events in a subnuclear region. Binding events occurring within different sized windows (0.064 μm2 [blue box] and 2.54 μm2 [black box], right panel) in this subnuclear region are counted as the window is scanned over the nucleus. PBAF binding density is thereby determined by counting the number of binding events located within a given size window. Scale bar, 2 μm.
(d) PBAF binding event frequency heat maps were obtained from two different scanning sized windows using the 2D projection map in (c). Regions of high (red) and low (blue) PBAF binding frequency is presented for the cell shown in (c). Top panels are zoomed in views of dashed boxes in lower panels. PBAF hubs (top left panel, white box) were identified as clusters of frequent PBAF chromatin binding to target loci. PBAF hubs were grouped to form distinct compartments (right panels). Scale bar, 0.25 μm (top panels) and 2 μm (bottom panels), respectively.
To characterize the dynamic binding of PBAF to chromatin in vivo, we chose to fluorescently tag the BAF180 subunit (i.e. Halo-BAF180 WT, Figure S1), since it harbors six bromodomains critical for interaction with acetyl-lysine residues on histones21, 22. Motion Blur HILO microscopy combined with live-cell Single Molecule Tracking (SMT) 23 was used to dynamically detect PBAF molecules stably bound to chromatin (Figure 1b and Supplemental Movie S1). At long camera exposure rates (∼500 ms), fast-diffusing nuclear PBAF complexes are blurred out and cannot be localized. Single PBAF molecules, stably bound to chromatin targets, appear as distinct Point Spread Functions (PSFs) that can be spatially and temporally resolved (Figure 1b). PSFs, representing PBAF’s binding and unbinding on chromatin, appear and disappear stochastically throughout the time course of imaging (Figure 1b and Supplemental Movie S1). We confirmed that these Halo-tagged BAF180 proteins were incorporated into the large multi-subunit PBAF complex via co-immunoprecipitation studies and live-cell fast diffusion measurements (Figures S1 and S2).
Two dimensional (2D) projection maps showed select nuclear regions that contained high densities of PBAF’s chromatin binding events alongside deserts devoid of binding (Figures 1c, left panel, and S3c). Based upon these maps, we hypothesized that PBAF’s distinct localization pattern was due, in part, to dynamic interactions between PBAF’s bromodomains and acetylated chromatin. Therefore, we developed an approach to spatially define the frequency of PBAF’s chromatin binding within nuclear subregions. These dynamic binding frequency heat maps were generated by raster scanning across the nucleus and counting the number of PBAF-chromatin binding events in a given sized window (binding events/µm2/sec) (Figures 1c and 1d). Spatially isolated regions representing high frequency PBAF binding to chromatin were scattered throughout the nucleus (Figure 1d, yellow spanning to red regions).
Analysis with the smallest scanning window (0.064 µm2) revealed hubs of repeated PBAF binding events to target loci within an area of ∼250 nm in diameter (Figure 1d, top panel). Importantly, no hubs were detected in simulations where localizations of an equivalent number of binding events were randomized throughout the nucleus (Figure S4a). These results are consistent with previous studies showing hubs of EWS/FLI1, Sox2 and RNA Polymerase II at enhancers and promoters in nuclear domains of roughly equivalent sizes13, 14, 16, 24. Therefore, we speculate that these PBAF hubs represent repeated binding or “cycling” on nucleosomes in small genomic regions at enhancers and promoters.
The largest scanning window (2.54 µm2) indicated clusters of binding hubs grouped together to form a large compartment (∼1.7 µm in diameter, Figure 1d, right panel). Importantly, the average size of our PBAF binding compartments in live cells was only slightly larger than active and inactive chromatin compartments measured by super-resolution microscopy in fixed cells4. Overall, these results suggest that PBAF is likely targeting chromatin in a permissive state over select genomic regions that are packaged in confined hubs that are grouped in compartments.
PBAF targeting and cycling on chromatin hubs is regulated by BAF180 bromodomains
It is generally thought that arrays of acetylated nucleosomes are repeatedly targeted by bromodomain containing chromatin remodeling complexes such as PBAF (Figure 2a)25. Multiple PBAF subunits contain bromodomains that recognize a large variety of acetyl-lysine residues in chromatin20, 26–28. Notably, BAF180 contains six bromodomains while BRG1 and BRD7 each contain one bromodomain. Therefore, we hypothesized that BAF180 bromodomains would have major role in PBAF’s targeting and cycling on hubs (Figure 2a).

(a) A schematic representation where PBAF cycles on and off an array of nucleosomes.
(b) Clustering analysis algorithms indicate PBAF binding events (red dots) within hubs (left panel, blue outlines). The right panel displays an expanded inset of a boxed region in the left panel.
(c) The number of hubs formed per cell, which express either wild-type PBAF WT or the mutant PBAF ΔBD. N.S. = Not significant, p-value * = < 0.05 and ** = < 0.01. (N=39 WT DMSO cells, 17 ΔBD DMSO cells, 37 WT SAHA cells, and 22 ΔBD SAHA cells)
(d) Temporal occupancy of PBAF at a representative chromatin binding hub. Snapshots of PBAF binding foci at different timepoints in movie (seconds) and the appearance of PBAF binding highlighted by white boxes (top panel). The width of the black bars represents the duration of individual PBAF/chromatin binding events in a hub (bottom panel). White gaps represent latent time periods when the region containing a hub is not occupied by PBAF. Timepoints (▴) from the top panel where PBAF binds in the hub. Timepoints (△) where PBAF does not bind the hub.
(e) Median number of binding events per hub per cell (N=39 WT DMSO cells, 17 ΔBD DMSO cells, 37 WT SAHA cells, and 22 ΔBD SAHA cells). N.S. = Not significant and p-value * = < 0.05.
(f) The long latency time in PBAF binding hubs (N=39 WT DMSO cells, 17 ΔBD DMSO cells, 37 WT SAHA cells, and 22 ΔBD SAHA cells). p-value ** = < 0.01 and *** = < 0.001.
For data in panels (c), (e) and (f), the white bar in the solid black box is the median, while the lower and upper boundaries of the black box correspond to the 25th and 75th percentiles of the data respectively. Outliers typically represented less than 10% of the dataset and therefore were omitted for clarity.
To determine if chromatin hubs were targeted via PBAF bromodomain/acetyl-lysine interactions, we compared the high frequency binding of wild-type PBAF and a mutant PBAF lacking the six BAF180 bromodomains (i.e. ΔBD) (Figure 2b). Interestingly, the number of PBAF binding hubs in each cell was reduced upon deletion of BAF180 bromodomains (Figure 2c). Correspondingly, the number of PBAF binding hubs increased in a BAF180 bromodomain-dependent manner when global levels of histone acetylation were elevated via SAHA treatment (Figures 2c and S4b). Overall, our data indicate that target hubs are defined by repeated rounds of PBAF binding to chromatin via BAF180 bromodomains/acetyl-lysine interactions.
We next investigated how chromatin in target hubs is temporally occupied by PBAF. Chromatin hubs are occupied via a series of PBAF binding and unbinding events interspersed with latent periods of non-occupancy (Figure 2d). We found that both wild-type PBAF and mutant PBAF ΔBD, on average, exhibited ∼9-10 rounds of repeated binding at target hubs over ∼18 minutes of continuous imaging (Figure 2e). Furthermore, elevated histone acetylation levels led to a slight but significant increase in the number of PBAF binding cycles at target hubs for both wild-type and mutant PBAF (Figure 2e). We speculate that residual bromodomains in mutant PBAF’s BRD7 and BRG1 subunits may compensate to increase cycling on select arrays of hyperacetylated nucleosomes.
To assess further assess the molecular origins of cycling on chromatin hubs, histograms of PBAF latency times were generated and fit to single, double and triple exponential decay models (Figure S4b). Statistical analysis indicated that a triple exponential decay model best fit the distribution of PBAF latency times. This enabled us to classify latency times as either short (∼4.5 sec), intermediate (∼21 sec) or long (∼205 sec) (Figure S4b). Removal of BAF180 bromodomains altered PBAF’s latency at hubs (Figures 2f and S4d), specifically increasing the long latency time of mutant PBAF cycling events (compare WT vs ΔBD). Notably, this difference in latency between wild-type and mutant PBAF was also further enhanced on hyperacetylated chromatin (Figure 2f, SAHA treatment). Therefore, PBAF’s cycling and re-occupancy of acetylated chromatin hubs may be aided via BAF180 bromodomains.
Dynamic mapping of PBAF, transcriptionally active and heterochromatic compartments
Thus far, our dynamic binding frequency heat maps allow us to quantitate PBAF target hubs grouped in close proximity (Figure 1d). We have termed these grouped hubs as PBAF binding compartments given their large size and distinct localization patterns (Figures 1d and 3a). Previous studies have established that PBAF binds nucleosomes at promoters of both transcriptionally active and repressed genes19, 29–32. To test if PBAF localizes on chromatin in different compartment types, we used a similar strategy as above to dynamically image transcriptionally active (H3.3-SNAP) and heterochromatic (SNAP-HP1α) nuclear subregions in single cells (Supplemental Movies S2 and S3). Compartments containing dense high frequency H3.3-SNAP genomic interactions were found within distinct subregions in the nucleus (Figure 3b, left panel). Likewise, heterochromatic compartments harboring high frequency SNAP-HP1α/chromatin interactions were also observed (Figure 3b, right panel). HP1α compartments defined in this manner roughly resembled the size of phase-separated heterochromatin33. These results demonstrate that we can identify large transcriptionally active and inactive regions of the genome clustered in select compartments in a live cell.

(a) Filtered heat map indicating regions of high PBAF chromatin binding frequency shown in yellow and red for cells expressing wild-type Halo-BAF180 (i.e. WT, left panel) and Halo-BAF180 ΔBD (i.e. ΔBD, right panel), respectively. Numbers of compartments (yellow boxes) are indicated. The nucleus is outlined by a white dashed line. Scale bar = 2 μm.
(b) Filtered heat maps indicating regions of high frequency H3.3 and HP1α genomic binding shown in yellow and red for cells expressing H3.3-SNAP (left panel) and SNAP-HP1α (right panel), respectively. Yellow boxes highlight individual compartments. The nucleus is outlined by a white dashed line. Scale bar = 2 μm.
(c) Median number of H3.3 and HP1α compartments in a cell expressing Halo-BAF180 wild-type (WT) or Halo-BAF180 ΔBD (ΔBD) (N=32 WT cells and N=31 ΔBD cells).
(d) Median size of H3.3 and HP1α compartments in a cell expressing Halo-BAF180 wild-type (WT) or mutant Halo-BAF180 ΔBD (ΔBD) (N=32 WT cells, 31 ΔBD cells).
For data shown in (c) and (d), the white bar in the solid black box is the median, while the lower and upper boundaries of the black box correspond to the 25th and 75th percentiles of the data respectively. (N=16 BAF180 WT/H3.3 cells, 16 BAF180 ΔBD/H3.3 cells, 16 BAF180 WT/ HP1α cells, and 15 BAF180 ΔBD/ HP1α cells). N.S. = not significant, p value ** = < 0.01 and *** = <0.001. Outliers typically represented less than 10% of the dataset and therefore were omitted for clarity.
Our analysis allows us to quantitate the number and sizes of compartments in a single cell. Interestingly, the number of PBAF compartments was reduced with a minimal impact on their size in our mutant PBAF ΔBD expressing cells (Supplemental Figures S5a and S5b). These results suggest that a subset of PBAF compartments is defined via BAF180 bromodomain targeting to select acetylation marks in chromatin hubs. We also found that the number and size of the H3.3 compartments were significantly diminished in our mutant PBAF BAF180 ΔBD cells (Figures 3c and 3d). Therefore, PBAF may be regulating the establishment of a subset of H3.3 compartments. Moreover, there were no differences in the number and size of HP1α compartments between wild-type and mutant PBAF cells (Figures 3c and 3d). Overall, our results suggest that establishment of H3.3 compartments, in part, requires PBAF’s BAF180 bromodomains.
Select spatial targeting of chromatin in transcriptionally active and heterochromatic compartments
To further reveal any spatial correlations between different compartments, dual color single molecule imaging was performed to map PBAF’s binding to chromatin alongside transcriptionally active or inactive compartments inside a single cell (Figure 4). First, we observed some high frequency PBAF binding that overlapped with both transcriptionally active and heterochromatic compartments (Figure 4a). In terms of total compartment area, approximately 27% and 24% of our mapped PBAF compartments overlapped respectively with the H3.3 and HP1α compartments (Figure 4b). Collectively, over 50% of the total area of PBAF’s compartments coincide with compartments containing H3.3 and HP1α marked chromatin. We surmise that the chromatin within the remaining non-overlapping regions of PBAF compartments might be associated with additional subtypes of inactive compartments not marked by HP1α2.

(a) Overlap (blue) between areas of high binding frequency compartments for Halo-BAF180 WT (orange) and either H3.3-SNAP (left panel, green) or SNAP-HP1α (right panel, red). Scale bar, 2 μm.
(b) Quantification of total area within a cell (μm2) for PBAF’s chromatin binding compartments (orange), transcriptionally active (H3.3, green, top panel) and heterochromatic (HP1α, red, bottom panel) compartments. The percentage of overlaps between compartments is indicated.
(c) Distribution of PBAF’s total chromatin binding events within transcriptionally active (H3.3, green, top panel) or heterochromatic (HP1α, red, bottom panel) compartments in a cell. The percentage PBAF chromatin binding events within H3.3 or HP1α marked compartments in a cell is indicated.
(d) Representative spatial distribution of PBAF’s chromatin binding events (orange dot) within a transcriptionally active H3.3 compartment (left panel) and a HP1α heterochromatic compartment (right panel). The periphery of the H3.3 and HP1α compartment is shown in green and red respectively. The scale bar is indicated.
(e) Spatial probability of wild-type PBAF (WT, top panels) and mutant PBAF ΔBD binding events (bottom panels) distributed in either H3.3 (left) or HP1α (right) compartments. N=16 WT/H3.3 cells, 16 ΔBD/H3.3 cells, 16 WT/ HP1α cells, and 15 ΔBD/ HP1α cells. N.S. = not significant, p value * = < 0.05, ** = < 0.01 and *** = < 0.001. The white bar present in the solid black box is the median, while the lower and upper boundaries of the black box correspond to the 25th and 75th percentiles of the data, respectively. Outliers typically represented less than 10% of the dataset and therefore were omitted for clarity.
Next, to better characterize chromatin states within compartments, PBAF SMT trajectories within H3.3 or HP1α compartments were isolated (Figures S6a and S6b). Roughly 23% and 21% of PBAF’s total nuclear chromatin binding events respectively occurred within transcriptionally active H3.3 or HP1α marked compartments (Figure 4c). Notably, upon close inspection, a large number of PBAF’s chromatin binding events localized to the periphery of H3.3 or HP1α marked compartments (Figure 4d).
To quantitatively determine PBAF’s preferential targeting inside compartments, we examined the ratio between the number of PBAF binding events inside of compartments (nPBIC) and the area of compartments (nAC, see methods). A value greater than 1 for the nPBIC/nAC ratio indicates enrichment of PBAF binding inside a specific type of compartment relative to global chromatin. A value less than 1 for the nPBIC/nAC ratio indicates depletion of PBAF binding inside compartments. Overall, we observed an enrichment of PBAF binding inside the H3.3 and HP1α compartments (i.e. Entire Comp. shown in Figure 4e, top panels).
To pinpoint where PBAF was mostly enriched inside compartments, we then plotted nPBIC/nAC ratios as a function of PBAF’s distance away from the compartment periphery (Figure 4e). We found a significant differential enrichment of wild-type PBAF’s chromatin binding within ∼84 nm of the periphery inside of H3.3 and HP1α compartments (top panels). In stark contrast, mutant PBAF that lacks BAF180 bromodomains (i.e. ΔBD) displayed no spatial enrichment close to the periphery of H3.3 and HP1α compartments (bottom panels). Thus, these findings reveal that chromatin at the edge of both transcriptionally active and heterochromatic compartments likely contains distinct acetylation marks that target PBAF via BAF180 bromodomains.
To support our live-cell dynamic tracking of PBAF binding on select distinct chromatin, super-resolution STORM microscopy in fixed cells was also conducted (Figure S7). The analysis validates the overlap between wild-type PBAF and H3.3/HP1α marked chromatin (Figure S7, cyan). In many subnuclear regions, PBAF binds chromatin and forms a distinct close interface surrounding H3.3 marked chromatin domains (Figure S7, bottom left panel, highlighted in red stars), consistent with the results in Figure 4. A similar but less pronounced pattern was seen with PBAF and HP1α marked chromatin domains (Figure S7, bottom right panel). Taken together, these studies illustrate that PBAF can selectively bind distinct transcription-regulated chromatin via BAF180’s bromodomains.
Transcriptionally active versus heterochromatic chromatin is differentially engaged by PBAF
Chromatin states are thought to significantly differ between transcriptionally active and heterochromatic compartments1, 18. To further characterize these different chromatin states, we determined PBAF’s genomic residence time in transcriptionally active H3.3 and heterochromatic HP1α compartments (Figure 5a). Residence time analysis revealed two chromatin-binding populations of PBAF in a representative H3.3 compartment (Figure 5b, red line). The predominant PBAF population (∼83% of molecules) transiently bound chromatin for ∼0.8 seconds. This PBAF population most likely represents non-specific binding since residence time analysis for the Halo-tag alone also showed brief (0.8 sec) interactions with chromatin23. The remaining PBAF molecules (∼17%) stably bound to chromatin in this H3.3 compartment for ∼9 seconds on average. Importantly, we are measuring PBAF’s dissociation from chromatin, as its residence time (9 sec) is significantly shorter than our dye photobleaching rates (t1/2 of approximately 100-200 sec).
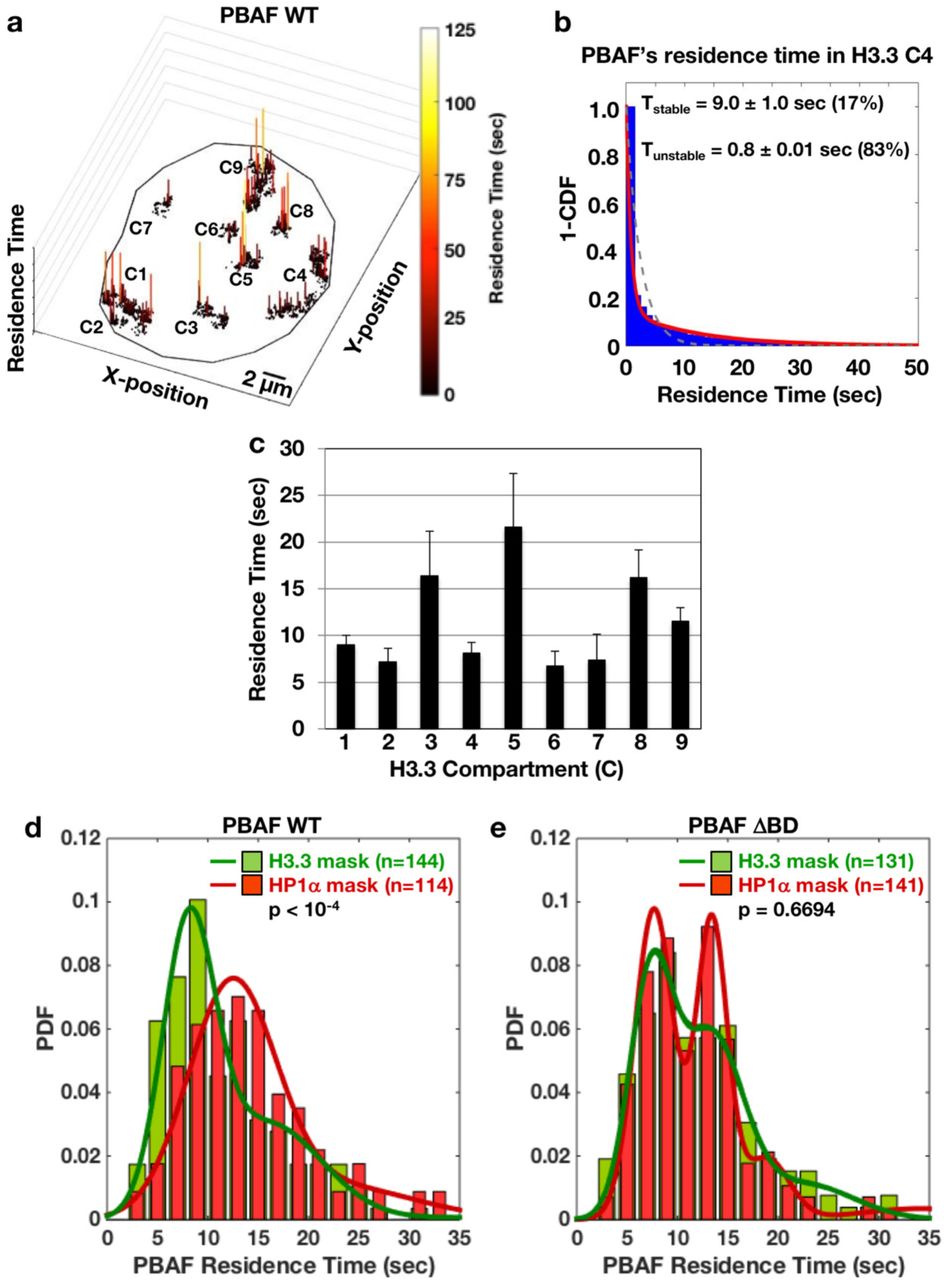
(a) Positions of PBAF tracks within transcriptionally active compartments were plotted with residence times (color-coded based on duration) in the third dimension in a representative cell. Compartment (C) identity is listed.
(b) 1−Cumulative Distribution Function Plot (1−CDF) of PBAF bound to chromatin in compartment 4 (C4) from the cell presented in (a) was fitted to a single (gray dashed) or two-component (red solid) exponential decay model. Fitting analysis of residence times reveals two populations (i.e. stable and unstable) of PBAF that bound to chromatin. Percentages of the stable and unstable binding populations are listed next to the residence time.
(c) Stable residence time of PBAF bound to chromatin for H3.3 marked compartments 1-9 (C1 to C9) from the cell presented in (a) is shown.
(d) Gaussian fits were generated to show the distribution of stable residence times of chromatin bound wild-type PBAF (WT) within individual H3.3 (green bars, dark green line) and HP1α (red bars, dark red line) compartments. (N=144 H3.3 marked compartments from 16 Halo-BAF180 WT cells and N=114 HP1α marked compartments from 16 Halo-BAF180 WT cells). Bin size = 2 seconds.
(e) Gaussian fits of the distribution of stable residence times of chromatin-bound mutant PBAF BAF180 ΔBD within individual H3.3 (green bars, dark green line) and HP1α (red bars, dark red line) compartments. (N=131 H3.3 marked compartments from 16 Halo-BAF180 ΔBD cells, N=141 HP1α marked compartments from 16 Halo-BAF180 ΔBD cells). Bin size = 2 seconds.
PBAF’s residence time broadly varied from ∼7-22 seconds within different H3.3 compartments in the same cell (Figure 5c). Global analysis reveals two subclasses of H3.3 compartmentalized chromatin across different cells that are targeted by PBAF (Figure 5d, green line). PBAF bound to chromatin for ∼8 seconds in the majority of H3.3 compartments, with a minor population of compartments exhibiting a residence time of 16 seconds. Comparatively, there was only one class of heterochromatic HP1α compartments displaying an average PBAF residence time of ∼12 seconds on chromatin (Figure 5d, red line). Overall, the majority of PBAF molecules that localized to H3.3 marked chromatin bound for a shorter duration than tracks within HP1α regions (Figure 5d). These results indicate that our dynamic imaging can segment compartments containing different chromatin states. Furthermore, this underlying chromatin state of target nucleosomes in different compartments affects PBAF’s binding.
To assess if BAF180 bromodomains regulate PBAF’s stability on chromatin, we examined the residence time of mutant PBAF ΔBD on chromatin globally (Figure S8) and in compartments (Figure 5e). Mutant PBAF ΔBD had a decreased percentage of stable global chromatin binding events, indicating an inefficient target search mechanism (Figure S8a). Compared to wild-type PBAF, mutant PBAF ΔBD had reduced residence times on chromatin globally (Figure S8b) and in high frequency PBAF compartments (Figure S8c). Thus, PBAF lacking BAF180 bromodomains has defects in associating with and anchoring to chromatin. Intriguingly, while there was a significant reduction in stability on global chromatin, mutant PBAF ΔBD exerted little difference in residence times between transcriptionally active H3.3 and heterochromatic HP1α compartments (Figure 5e). Notably, PBAF ΔBD exhibited a bimodal distribution profile of residence times (∼8 and ∼13 sec) within heterochromatic HP1α compartments. Therefore, a subclass of distinct heterochromatic compartments is defective for interacting with PBAF ΔBD (∼8 sec) compared to PBAF WT (residence time ∼12 sec, Figure 5d versus 5e). We speculate that PBAF may target at least two different types (i.e. BAF180 bromodomain dependent and independent) of HP1α-marked heterochromatic compartments via distinct subunits and mechanisms.
Surveying the local chromatin environment of PBAF target loci
ATP-dependent nucleosome remodelers, such as PBAF, are known to reposition nucleosomes along the DNA34, 35. In the cell, PBAF’s movement when bound to a genomic scaffold could be due to (1) translocation along the DNA, (2) local constrained diffusion of the genomic DNA that is dependent on local chromatin density, or (3) a combination of both translocation and DNA diffusion. Regardless of its origin, we surmised that PBAF’s movement could serve as a probe of the local condensation status of chromatin (Figure 6a). Thus, we hypothesized that PBAF would move faster when bound to nucleosomes within open euchromatic versus condensed heterochromatic loci (Figure 6a).

(a) Euchromatin contains a low density of nucleosomes resulting in fast local diffusion of chromatin bound PBAF (left panel). Heterochromatin contains densely packed nucleosomes that restrict local diffusion of chromatin bound PBAF (right panel).
(b) Representative plots of two nearby PBAF chromatin binding events within similar time frames displaying curvilinear directional non-brownian movement. Localizations from individual PBAF binding trajectories (yellow and blue thin lines) were time-averaged and highlighted (orange and dark blue thick lines). Frame to frame X, Y displacements were measured from the beginning of the binding event (green dot) to the end (red dot).
(c) A representative PDF plot showing PBAF’s velocity of individual binding trajectories within a nucleus. N=4362 binding trajectories in 16 PBAF WT cells. Across all conditions, PDF plots were fit with multiple Gaussian models to segment four different populations of distinct velocities (slow, medium, fast1, and fast2). The percentage for each population is listed.
(d) Population distribution of velocities for chromatin bound PBAF WT or mutant PBAF ΔBD within H3.3 or HP1α compartments. The percentage for each population of PBAF’s velocity (i.e. fast, medium and slow) within the same compartment is presented. N=549 binding trajectories of PBAF WT inside H3.3 compartments from 16 cells. N=527 binding trajectories of PBAF WT inside HP1α compartments from 16 cells. N=613 binding trajectories of the mutant PBAF ΔBD inside of H3.3 compartments from 16 cells. N=787 binding trajectories of the mutant PBAF ΔBD inside HP1α compartments from 15 cells.
To study PBAF’s movement on chromatin, we measured the frame-to-frame X, Y positional displacements of individual genome bound PBAF SMT trajectories (Figure 6b). Interestingly, both unfiltered (thin blue/yellow lines) and smoothed (thick dark blue and orange lines) SMT trajectories of chromatin bound PBAF predominantly displayed asymmetric elongated curvilinear movement (Figure 6b). This movement was not due to cell migration or microscope drift as trajectories occurring in close spatial and temporal proximity often moved in opposing or distinct directions. Our results were consistent with previous studies showing that chromatin moves via a curvilinear mechanism36, 37.
We next sought to address whether different chromatin states of target nucleosomes would impact PBAF’s velocity. To begin tackling this task, we quantitatively characterized the movement of individual trajectories (Figure S9a). The velocity of PBAF’s curvilinear movement was discontinuous, occurring in a series of starts and stops. Furthermore, multiple Gaussian model fitting of the individual trajectory’s average velocities revealed at least three to four distinct populations of PBAF velocities (Figure 6c). These four populations may reflect four different chromatin states bound by PBAF. For clarity, we combined the two fast PBAF movement populations into a single category. We suspected that less crowded euchromatic loci would allow fast movement of PBAF (Figure 6a, left panel). Correspondingly, heterochromatin would result in medium and slow moving PBAF (Figure 6a, right panel). Notably, throughout the nucleus, approximately 77% of PBAF’s global chromatin binding events displayed medium and slow velocities on chromatin (Figure 6c). This suggests that the majority of chromatin throughout the nucleus is in a densely packed heterochromatic state (Figure 6a, right panel).
Next, we compared PBAF’s movement when bound to H3.3 versus HP1α marked chromatin (Figure 6d). HP1α marked chromatin compartments contain a significantly higher percentage of slow moving PBAF relative to H3.3 containing chromatin. Correspondingly, open euchromatic H3.3 marked chromatin harbors an elevated percentage of fast moving PBAF molecules versus condensed heterochromatic loci (Figure 6d), likely reflecting differences in the local nucleosome density surrounding target loci.
Throughout the nucleus, global chromatin is relatively closed and thought to contain predominantly the histone H3.1 variant in place of H3.338. Therefore, as a control, we further examined PBAF’s velocity outside of H3.3 marked compartments. Indeed, there was an increased percentage of slow moving wild-type PBAF bound to H3.1 marked chromatin outside of H3.3 marked compartments (i.e. 37% vs. 21%, Figures S9b and 6d). On the other hand, we observed a decrease in the slow moving PBAF population outside of HP1α marked compartments (i.e. 35% vs. 42%, Figure S9b and 6d). This suggests that the global chromatin on average is slightly less densely packed compared to HP1α marked chromatin. Collectively, PBAF’s differential velocities likely reflect chromatin compaction, which increases from H3.3 to H3.1 to HP1α marked chromatin states. However, we can’t exclusively rule out the possibility that PBAF may bind these distinct types of chromatin via different mechanisms and subunits, resulting in distinct velocities regardless of compaction states.
Residence time analysis indicated that removal of PBAF’s bromodomains altered binding in heterochromatic compartments (Figure 5e). Therefore, we exploited mutant PBAF ΔBD’s velocity to infer the local chromatin density of its targets within heterochromatin. Interestingly, we observed a decreased percentage of slow moving mutant PBAF ΔBD molecules relative to wild-type PBAF in heterochromatic HP1α compartments (Figure 6d). It is important to note that these results are consistent with the residence time analysis (Figures 5d and 5e), implying mistargeting of mutant PBAF ΔBD to potentially unstable nucleosomes within heterochromatic compartments. Taken together, our studies suggest that PBAF uses bromodomains for targeting distinct chromatin states within heterochromatic compartments.
Discussion
A battery of work has now established that transcriptionally co-regulated genes are clustered in compartments containing Topologically Associated Domains (TADs) or transcription factories in the nucleus (Figure 1a)1, 13, 18, 39. However, little is known about how these compartments are dynamically targeted and shaped by chromatin modifiers. We proposed that PBAF could act to remodel chromatin in promoters, enhancers and boundary elements in distinct subnuclear compartments. Using dynamic live-cell single molecule tracking, chromatin binding frequency heat maps allowed us to visualize compartmentalized chromatin binding of PBAF at different scales dependent on the size of our scanning window (Figure 1d). As expected, different chromatin interacting proteins, such as the H3.3 histone variant and the HP1α heterochromatic binding protein, also displayed compartmentalized binding in our live-cell imaging analysis (Figure 3b). Therefore, we and other research groups have established that dynamic single molecule tracking is useful for identifying and characterizing compartmentalized genomic binding of a broad range of nuclear factors16, 17.
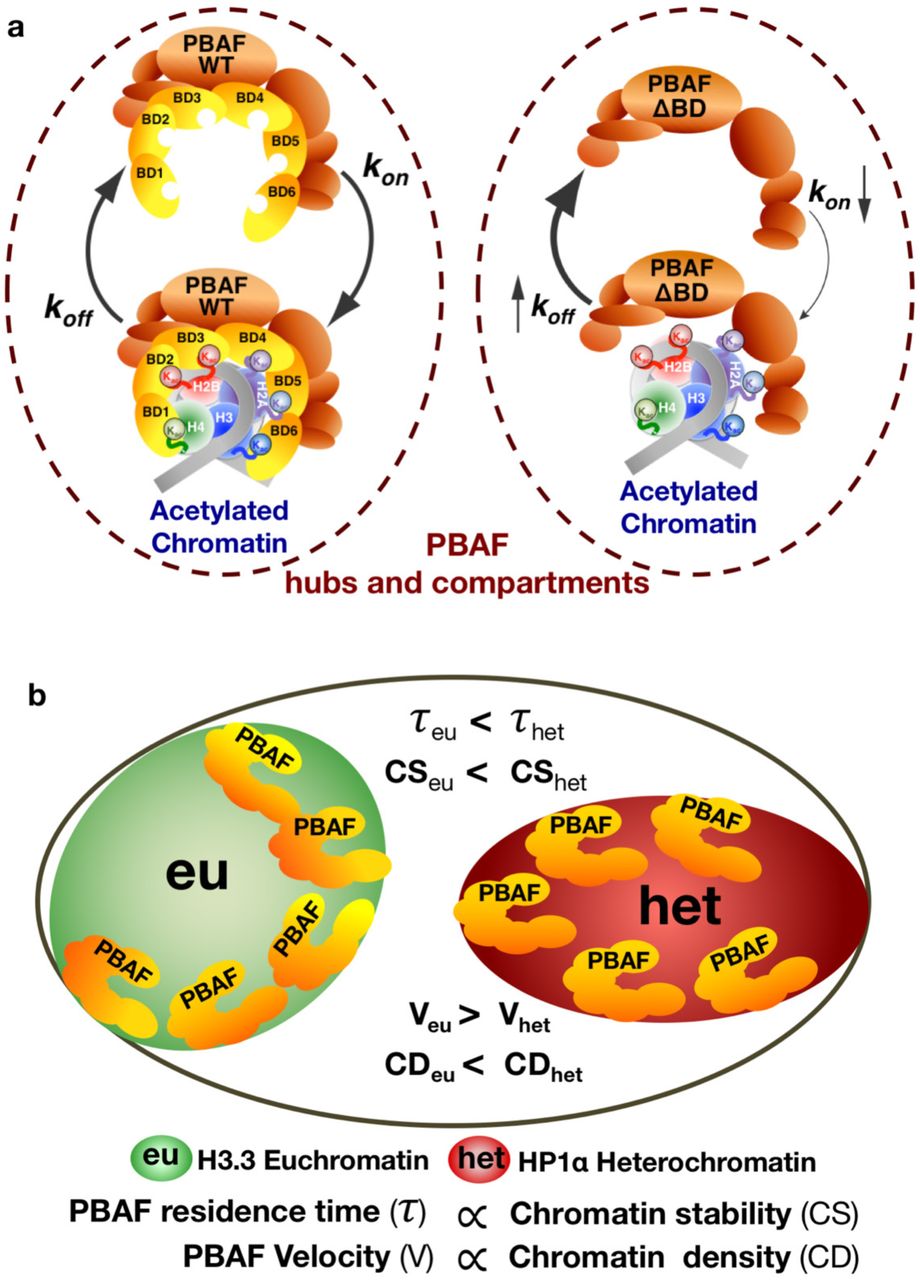
Large chromatin domains (∼2-30 kb) can be found to be acetylated throughout the genome 40, 41. We proposed that the discrete PBAF hubs identified in our heat maps (Figure 1d) represent repeated binding to arrays of closely spaced acetylated nucleosomes during our live-cell imaging (Figure 2). Indeed, removal of BAF180’s bromodomains reduced the number of PBAF hubs, while elevated global histone acetylation increased the number of hubs (Figure 2c). Therefore, we surmise that PBAF binding hubs represent acetylated loci (Figure 7a). Interestingly, our latency analysis reveals that BAF180 bromodomains also increase PBAF cycling on acetylated chromatin in hubs (Figure 2f). Therefore, our studies support that PBAF utilizes bromodomain/acetyl interactions to remain in the immediate vicinity of target chromatin, likely facilitating repeated rounds of remodeling events on nucleosomal arrays (Figures 2a and 7a).

(a) Highly localized histone acetylation in hubs and compartments increases PBAF’s association, revisiting and anchored binding via BAF180 bromodomains. Removal of PBAF’s bromodomains decreases residence time (elevated koff) in compartments and increases latency between binding events (reduced kon) in hubs.
(b) PBAF helps to shape H3.3 compartments by binding to boundary elements at the periphery to prevent invasion of heterochromatin into transcriptionally active compartments. In H3.3 rich euchromatic compartments, less stable chromatin results in PBAF binding for a shorter duration of time than within stable HP1α rich heterochromatin. PBAF’s residence time on chromatin is proportional to chromatin stability. The velocity of genomic bound PBAF is decreased in densely packed heterochromatin relative to H3.3 rich chromatin. Therefore, PBAF’s velocity may reflect chromatin compaction surrounding target nucleosomes.
Our data visualized large compartments encompassing grouped hubs of transcriptionally active genomic regions (Figure 3b, left panel). This result complements Hi-C genomic studies1, 18, indicating that compartmentalized regions of the genome contain acetylated histone marks associated with active transcription. Notably, formation of transcriptionally active compartments is likely regulated via PBAF’s peripheral targeting of acetylated chromatin (Figures 3c, 3d, 4d, 4e and 7b). We speculate that reduced targeting of mutant PBAF ΔBD away from the periphery may lead to enhanced heterochromatic spreading decreasing both the size and number of transcriptionally active compartments (Figures 3c and 3d). Our findings are consistent with BAF180’s role in promoting H3.3 loading during the formation of functional boundary elements to prevent pericentric heterochromatin spreading in Drosophila42. In addition, RSC, the yeast homolog of PBAF, is known to play a major role in establishment of nucleosome free regions at the boundaries of chromatin interaction domains leading to a less compact genome11. Therefore PBAF may have conserved role in shaping genome topology via prevention of heterochromatic spreading into compartments containing transcriptionally active genes.
Previous studies have focused on the ability of PBAF and related chromatin remodeling complexes to strictly engage facultative heterochromatin and antagonize Polycomb mediated repression43, 44. Our data indicate that PBAF also functions at the periphery of constitutive HP1α marked heterochromatic compartments (Figure 4a, right panel). Reports documented that the BRG1 subunit of PBAF binds to HP1α and is required for loading of HP1α onto heterochromatin in vitro and in vivo45, 46. HP1α prevents spreading of H3K27me3, a well-known target of Polycomb, in pericentric heterochromatin47. We speculate that PBAF aids heterochromatic loading of HP1α at the periphery of constitutive heterochromatic compartments to disrupt spreading of H3K27me3 and antagonize Polycomb binding. Therefore, our studies uncover a novel role for PBAF in chromatin remodeling of HP1α marked heterochromatic regions.
Different chromatin states can be, in part, defined by their nucleosome stability48. Thus, different chromatin states may also be reflected by the genomic residence time of chromatin remodelers in a live cell. Our imaging experiments support this idea by showing that PBAF displayed shorter residence times in H3.3 marked transcriptionally active regions compared to HP1α containing heterochromatic regions (Figure 5d). This is completely consistent with previous in vitro and in vivo studies showing inherent instability of H3.3 containing nucleosomes49–51. Thus, rapid turnover of PBAF’s chromatin occupancy in transcriptionally active regions may directly reflect nucleosome stability (Figure 7b), which could help define different chromatin states.
Time-dependent averaging of PBAF chromatin binding trajectories revealed directional movement (Figure 6b). Furthermore, there is a strong correlation between chromatin structure and PBAF’s velocity (Figure 6d), with complexes moving slower as nucleosome density increases (Figure 7b). Surprisingly, mutant PBAF lacking BAF180 bromodomains moved faster compared to wild-type PBAF in HP1α marked heterochromatic compartments (Figure 6d). Thus, our data indicate that mutant PBAF ΔBD may be mistargeted to distinct local heterochromatin environments containing less densely packed nucleosomes. This is further supported by data showing that mutant PBAF ΔBD binds for shorter periods of time relative to wild-type PBAF in HP1α marked heterochromatic compartments (Figure 5d vs 5e). Alternatively, it is also possible that different subunits and mechanisms, independent of chromatin compaction states, regulate mutant PBAF ΔBD’s velocity on heterochromatin.
Thus far, numerous research groups have uncovered a plethora of histone post-translational marks (PTM) utilized by chromatin remodelers to regulate transcriptional activation52. Previous genomic studies have mapped these histone acetylation marks to broad chromatin domains along with select regions of promoters and enhancers40, 41, 53. Recent studies on 3D organization of the genome revealed compartments containing histone marks associated with activated transcription18, 54. By characterizing the dynamic genomic binding of PBAF, which recognizes many of these acetylation marks, our work helps to define the spatial and temporal histone modification of chromatin hubs and compartments. Future live-cell single molecule imaging studies of additional histone PTM writers, readers, and the histone marks themselves will shine new light on the spatiotemporal organization of the 4D epigenome.
Methods
Plasmid constructions, biochemistry and generation of cell lines
Details of plasmid construction, biochemical analysis of Halo-BAF180 and generation of cell lines are described in the Supplemental Methods section.
Live-cell fluorescent labeling of Halo-BAF180 WT and Halo-BAF180 ΔBD
Cells stably expressing Halo-BAF180 WT were grown to a density of ∼5×10⁵ cells on 35 mm MatTek imaging dishes. Twenty-four hours prior to transfection of Halo-BAF180 ΔBD, parental U2OS cells were grown to a density of ∼1×10⁵ cells in 35 mm MatTek imaging dishes. Cells were then transiently transfected with the pFRT-Halo-BAF180 ΔBD plasmid and incubated overnight prior to further treatments.
Twenty-four hours before labeling, cells were treated with either 2.5 μM SAHA (Cayman Chemical) or matching vehicle control (DMSO, 0.25% final concentration) (Sigma) and were incubated at 37°C with 5% CO2. Immediately prior to imaging, cells were incubated with 0.4 nM JF549-HTL dye for 15 minutes at 37°C. Cells were then washed 3 times with 1X PBS, replaced with complete DMEM and incubated for 30 minutes at 37°C to remove unincorporated dye. Cells were then washed 2 times with 1X PBS and placed in L-15 imaging media (Life technologies) + 10% FBS for imaging.
Dual color live-cell fluorescent labeling of Halo-BAF180 WT/ΔBD and H3.3-SNAP or SNAP-HP1α
Cells stably co-expressing Halo-BAF180 WT along with either H3.3-SNAP or SNAP-HP1 were grown to a density of ∼5×10⁵ cells on 35 mm MatTek imaging dishes. Immediately prior to imaging, cells were incubated with 10 nM SNAP-Cell 647-SiR (New England Biolabs) and 0.4 nM JF549-HTL at 37°C for a total of 30 and 15 minutes, respectively. Cells were then washed 3 times with 1X PBS, replaced with complete DMEM and further incubated for 30 minutes at 37°C to remove unincorporated dye. Cells were then washed 2 times with 1X PBS and placed in L-15 imaging media (Life technologies) + 10% FBS for imaging. Two color labeling of Halo-BAF180 ΔBD along with H3.3-SNAP or SNAP-HP1α was performed as described above, except that Halo-BAF180 ΔBD were electroporated with pSNAP plasmids 24-72 hours prior to labeling.
Live-cell single molecule imaging of Halo-BAF180 WT/ΔBD, H3.3-SNAP or SNAP-HP1α
All imaging sessions were carried out at room temperature. Cells were continuously illuminated using a 532 nm (13 W/cm2, Coherent) or 640 nm (9.5 W/cm2, Coherent) laser for JF549-HTL and SNAP-Cell 647-SiR imaging respectively. Time-lapse two-dimensional (2D) images of single molecules were acquired with a customized inverted Nikon Eclipse Ti microscope with a 100X oil-immersion objective lens (Nikon, 1.49 NA) and further magnified 1.5X post-objective. BAF180 images were acquired at 2 Hz for ∼18 minutes using an EMCCD (iXon, Andor) with a 512 x 512 pixel field of view (final pixel size of 84 nm). SNAP imaging proceeded at 2 Hz for ∼4.5 minutes in cells that also expressed either SNAP-Cell 647-SiR labeled H3.3-SNAP or SNAP-HP1α.
Image Processing and single molecule tracking
Movies of acquired images were processed to subtract background in ImageJ using a rolling ball radius of 50 pixels. Background subtracted movies were subjected to Multi-Target Tracking (MTT) to resolve the trajectories of individual molecules 55 using a GUI based implementation, SLIMfast 56. Localization of individual molecules was achieved by fitting Point Spread Functions (PSFs) of discrete single spots with a 2D gaussian function. Tracking of single molecule chromatin binding events was performed by connecting BAF180 localizations between consecutive frames. Tracking was based upon a maximum expected diffusion constant of 0.05 μm2/second and allows for 1.5 second gaps in trajectories due to blinking or missed localizations. Track positions from individual trajectories were averaged to generate a 2D projection map of BAF180 binding events over 18 minutes of imaging.
Nuclear BAF180 tracks were identified based on the boundaries from 2D projection maps of 180 binding events. BAF180 tracks that fell outside of the nucleus were excluded. Photobleach rates were then determined for each background-subtracted movie based upon exponential decay of the global fluorescence of chromatin bound Halo-BAF180 WT/ΔBD, H3.3-SNAP, SNAP-HP1α.
Analysis of PBAF chromatin binding residence times
Chromatin binding residence time was determined by plotting a survival curve (1-Cumulative Density Function, 1-CDF) of the track-lengths of chromatin bound Halo-BAF180 in each cell. Single and double-exponential models were then fitted to these 1-CDF plots to determine residence times. One-way ANOVA followed by Tukey’s post-hoc t-tests were performed to determine pairwise significance of global residence times and percentages of stable PBAF binding events.
Analysis of PBAF clustering in hubs
2D projection maps of BAF180 binding events lasting at least one second (Figures 2e and 2g) or eight seconds (Figure 2c) were expanded 10 fold in the X and Y directions yielding a final pixel size of 8.4 nm. Areas of high PBAF binding densities were determined by counting the number of binding events within an octagon window (diameter 168 nm) as it was raster scanned across the nucleus of the expanded 2D projection map. Contiguous octagon widows centered on an individual pixel containing at least 3 PBAF binding events were defined and labeled as hubs. The total number of hubs per cell were then normalized to the total PBAF binding events per cell and multiplied to produce the number of PBAF hubs formed per 10,000 PBAF binding events (i.e. Number of PBAF hubs) for each cell. Overall significance was determined with a two-sample Kruskal-Wallis test to determine pair-wise significance.
To quantitate PBAF binding latency times in hubs, tracks of binding events in individual hubs were further analyzed to determine the time periods between single PBAF binding events. 1-CDF survival plots of all PBAF latency times in hubs in a single cell were fit with a single, double, and triple exponential decay model. Overall significance was determined with a two-sample Kruskal-Wallis test to determine pair-wise significance.
Mapping of PBAF binding compartments
Contiguous nuclear regions of compartments containing high frequency PBAF binding in cells were determined by raster scanning of a 19 x 19 pixel (2.54 μm2) window across the nucleus. Binding events that fell within this window were then counted to generate an overall binding density for individual pixels throughout the nucleus. Pixels in the resulting PBAF density map, which displayed a lower binding density than the average global binding density, were filtered out and eliminated. Remaining continguous areas containing at least 10 pixels displaying a high frequency of PBAF binding events were grouped as compartments. For residence time analysis, compartments with fewer than 120 binding events were eliminated to permit more robust statistical analysis of events. Track lengths for molecules within these remaining compartments were then plotted as a 1-CDF survival curve and fit to single- and double-exponential decay functions. Residence times of the specific binding population for each compartment were plotted as Probability Density Functions (PDF). Statistical differences between genotypes or treatment conditions were then assessed using a two-sample Kolmogorov-Smirnov test.
Characterization of PBAF localization to H3.3 or HP1α compartments
High binding density H3.3 or HP1α compartments were mapped using MTT and raster scanning as described above. Remaining compartments were then filtered, such that regions below a threshold of 0.5% of total nuclear binding events for H3.3 and HP1α were eliminated. PBAF binding events within each compartment were summed and normalized to the total number of PBAF binding events within the cell (nPBIC). This was further normalized to the percentage of the total nuclear area occupied by either H3.3 or HP1α compartments (nAC). For analysis of binding probability in relation to compartment periphery, the number of PBAF binding events within a 1 pixel (84 nm) band around the perimeter of the compartment was determined and normalized to the total number PBAF binding events in the cell. This was further normalized to the percentage of nuclear area occupied by the 1 pixel (84 nm) band around the perimeter of the compartment. The outer band of the compartment was then removed and the subsequent binding probability analysis for the 84-168 nm, 169-252 nm, 253-336 nm, 337-420 nm bands away from the compartment periphery were performed in a similar manner. Overall significance was determined with a two-sample Kruskal-Wallis test to determine pair-wise significance.
Characterization of PBAF binding dynamics within H3.3 or HP1α compartments
Track lengths for PBAF molecules within compartments were plotted as a 1-CDF survival curve and fit to single- and double-exponential decay functions. Residence times of the specific binding population for each compartment were plotted as Probability Density Functions (PDF). Statistical differences between genotype or treatment conditions were then assessed using a two-sample Kolmogorov-Smirnov test.
Velocity analysis of chromatin bound PBAF
To assess the average velocity of chromatin bound PBAF within compartments (Figure 6), we analyzed PBAF molecules bound between 7.5 and 15 seconds, based on the average residence times of PBAF within H3.3 and HP1α marked compartments (Figures 5d and 5e). Localizations (i.e. X, Y positions) from PBAF binding trajectories (Figure 6b) were time averaged using a top hat filter with a sliding window of 5.5 seconds. The distance of the displacement between time-averaged localizations from subsequent frames (0.5 seconds) was then used to generate a velocity for each individual step throughout the binding trajectory (Figure S9a). Velocities throughout the binding trajectory were then averaged to obtain a mean velocity for an individual PBAF chromatin binding event. Histograms of mean PBAF velocities within compartments were then fit using a four component Gaussian mixture model employing an iterative Expectation Maximization algorithm in MATLAB. The resulting Gaussian mixture models revealed populations containing 4 unique subclasses of velocities for PBAF genomic binding events. The data are represented by the mean percentage and standard deviation of each subclass from 50 independent Gaussian mixture models fit to the histograms of PBAF velocities.
Data Availability
Datasets generated in this study are available at the NIH 4D Nucleome Data portal (data.4dnucleome.org) : 4DNES2DS2N1U, 4DNESL67GMLC, 4DNES3RWS1Y5, 4DNES6IJ8J3X, 4DNESC234IRM, 4DNESCE4GQDC, 4DNESGYDFIM4, and 4DNESEAOOIOB.
Author contributions
Designed and supervised experiments: RAC, CAK, SHL, PC, WL, RHS
Generated material: CAK (cell lines, constructs), VW (cell lines, constructs), PD (cell lines), LDL (JF dyes)
Performed experiments: CAK, SHL, PC, VW
Analyzed data: CAK, SHL, PC, VW, RAC, WL
Wrote paper: RAC, WL, CAK
Competing Interests
The authors declare no competing interests.
Acknowledgements
We thank Y.J. Chen and C.S. Peng for development of initial Matlab scripts used for SMT tracking. We are grateful to Z. Liu for providing the Matlab script and technical advice for analysis of diffusion rates. We thank S. Healton for reagents and technical assistance in acid extraction of histones, and J.C. Wheat for providing SAHA reagent and initial aliquots of acetyl-H3 antibody. We also thank D. Shechter for providing the histone H3 antibody. This work was supported by a grant from the NIH (8U01DA047729-04, RAC and RHS) as part of the 4D Nucleome project, the NIH (1R01GM126045-01, RAC) and a NIH Medical Scientist Training Program Grant (T32GM007288, CAK).
Footnotes
Clarifications throughout main body of text to further emphasize dynamic interactions, probing of different chromatin states, and mechanism for PBAF targeting of different compartments. This includes new figures 2, 4, and 6. Figures 1, 3, 5 and 7 are a revision of previously submitted figures 1-6.


