

Abstract
Genetic diversity plays a central role in tumor progression, metastasis, and resistance to treatment. Experiments are shedding light on this diversity at ever finer scales, but interpretation is challenging. Using recent progress in numerical models, we simulate macroscopic tumors to investigate the interplay between global growth dynamics, microscopic composition, and circulating tumor cell cluster diversity. We find that modest differences in growth parameters can profoundly change microscopic diversity. Simple outwards expansion leads to spatially segregated clones, as expected, but a modest cell turnover can result in mixing at the microscopic scale, consistent with experimental observations. Whereas simple range expansion models predict maximum diversity at the tumor edge, turnover models predict maximum diversity near the core of the tumor and a higher potency of CTCs for metastasis. Using multi-region sequencing data from a Hepatocellular Carcinoma patient to validate our models, we propose that deep multi-region sequencing is well-powered to distinguish between some of the leading models of cancer evolution. The genetic composition of circulating tumor cell clusters, which can be obtained from noninvasive blood draws, is therefore informative about tumor evolution, the position of origin of the cluster within the tumor, and its metastatic potential. It is therefore a promising tool for both fundamental and medical research.
Introduction
Most cancer deaths are due to metastasis of the primary tumor, which complicates treatment and promotes relapse [1–3]. Circulating tumor cells (CTC) are bloodborne enablers of metastasis that can be isolated and genetically characterized [4,5]. Counts of single CTCs have been used to predict tumor progression [6,7] and monitor curative and palliative therapies in breast [8,9] and lung cancers [10]. CTCs have also been isolated in clusters of 2-30 cells [11]. These CTC clusters, though rare, are associated with more aggressive metastatic cancer and poorer survival rates in mice and breast and prostate cancer patients [5].
Cellular growth within tumors follows Darwinian evolution with sequential accumulation of mutations and selection resulting in subclones of different fitness [12,13]. Certain classes of mutations are known to give cancer cells advantages beyond local growth rates. For example, acquiring mutations in ANGPTL4 in breast tumors does not appear to provide a growth advantage to cells in the primary, however it enhances metastatic potential to the lungs [14]. Similarly, breast tumors are more likely to metastasize into the lung or brain if they acquire mutations in TGFβ or ST6GALNAC5, respectively [14,15]. These mutations are referred to as metastasis progression genes or metastasis virulence genes [1,16].
Mutations, including metastasis progression and virulence genes, are not uniformly distributed in the tumor. Tumors show substantial intratumoral heterogeneity (ITH) [17–19] where subclones have private mutations that can lead to subclonal phenotypes [20–22] and contribute to therapy resistance and relapse [3,23]. Studying ITH is therefore important for cancer treatment and prognosis [23–25]. This requires multiple samples across a tumor to capture the complete mutational spectrum of a primary tumor.
Next-generation sequencing (NGS) of single CTCs has shown that they have similar genetic composition to both the primary and metastatic lesions [26]. This opens the way for using CTC and CTC clusters as a non-invasive liquid biopsy to study tumors, monitor response to therapy, and determine patient-specific course of treatment [26–29].
Here we ask whether genetic heterogeneity within individual circulating tumor cell clusters can be informative about solid tumor progression. Because CTC clusters are thought to originate from neighboring cells in the tumor [5], heterogeneity within CTC clusters is closely related to cellular-scale genetic heterogeneity within tumors. Here, we therefore suppose that CTC cluster diversity is a direct function of diversity in small cell clusters within the tumor.
We study the interplay of tumor dynamics, CTC cluster diversity, and metastatic outlook through large-scale tumor modelling. We show that fine-scale tumor heterogeneity, and therefore CTC cluster composition, depend sensitively on the tumor growth dynamics and sampling location. Simulated data is consistent with recent sequencing experiments, but slightly finer sampling will provide stringent tests that distinguish between state-of-the-art models. These findings further reinforce the utility of fine-scale tumor profiling and CTC clusters as clinical tools to elucidate tumor information and clinical outlook [30,31].
Tumor growth model
To simulate the growth of solid tumors, we use TumorSimulator [32]. The software is able to simulate a tumor containing 108 – 109 cells, or roughly 2 cubic centimeters, in 24 core-hours. The tumor consists of cells that occupy a 3D lattice. Empty lattice sites are assumed to contain normal cells which are not modelled in TumorSimulator.
Each cell has an associated list of genetic alterations which represent single nucleotide polymorphisms (SNPs) that can be either passenger or driver. Driver mutations increase the growth rate by a factor 1 + s, where s ≥ 0 is the average selective advantage of a driver mutation.
At t = 0, the simulation begins with a single cell that already has an unlimited growth potential. The TumorSimulator algorithm then proceeds to grow the tumor through the following steps:
Select a random cell to be the mother cell.
Set the cell birth rate to b’ = b(1 + s)k, where b is the initial tumor birth rate, s is the average selective advantage of a driver mutation, and k is the number of driver mutations present in the mother cell.
Randomly select a lattice point adjacent to the mother cell. If empty, create a genetically identical daughter cell at that position with a probability proportional to the birth rate, b’. If no cell created, or no empty sites are found proceed to 5.
Independently give mother and daughter cells additional passenger and driver mutation. The number of passenger and driver mutations are drawn according to Poisson distributions with mean λp and λd, respectively, and are drawn independently for the mother and daughter cell. Each mutation is unique and there is no back-mutations or recurrent mutations.
Kill (i.e., remove) the mother cell with probability proportional to the death rate d.
Update time by a small increment dt = 1/(bmaxN), where N is the total number of cancer cells in the tumor and bmax is the maximum birth rate in the population of cells.
We consider three turnover scenarios corresponding to three values of the death rate d: (i) No turnover (d = 0), corresponding to simple clonal growth; (ii) Surface Turnover (d(x,y,z) > 0 only if x,y,z is on the surface), corresponding to a quiescent core model [33] (iii) Turnover (d > 0 everywhere), a model favored in [32] to explore ITH.
The birth rate (b = In(2)), and selective advantage (s = 1%) were kept consistent with [32]. In addition to varying the turnover model (full, surface, or none), we vary its intensity by controlling the death rate, d ∈ {0.05, 0.1,0.2, 0.65}. TumorSimulator also has a parameter that controls migration of cells to form new independent cancer lesions. We did not allow such local migrations, as they would have little effect on the very fine-scale diversity in the primary tumor. We tried two values for the passenger mutation rate: λp = 0.02 to facilitate comparison with simulations from [32], and λp = 0.0375 to match experimental observations from [34].
CTC cluster synthesis
Experimental evidence suggests that CTC clusters are formed from neighboring cells in the primary tumor and not by agglomeration or proliferation of single CTCs in the blood [5,35]. To represent circulating tumor cell clusters, we therefore sampled spherical clusters of cells in different areas of the tumor. We varied the number of cells in the cluster from 2 to 30 to allow comparison to empirical findings [11].
Results
Global composition
To determine the effect of the growth dynamics on global intra-tumor heterogeneity, we first consider the allele frequency spectra for different turnover models (Fig 1, S1). In all cases, a majority of driver and passenger genetic variants are at frequency less than 1%, as expected from theoretical and empirical observations [36]. Passenger mutations represent the bulk of ITH, consistent with the theoretical and experimental evidence that neutral evolution drives most ITH [37]. For simulations with low to moderate death rate, d = {0.05, 0.1, 0.2}, we find that the frequency spectra are indistinguishable between the three turnover models (Fig 1, S1).

Allele frequency spectra for low death rates, d ∈ {0.1,0.2} are indistinguishable.

A histogram of the allele frequencies in the tumor for S, the number of somatic mutations (circles), and Sd the number of driver mutations (triangles). (a) At low death rate, the frequency spectra are indistinguishable, whereas for (b) higher death rate, the turnover model produces elevated diversity across the frequency spectrum for both driver and neutral mutations.
When the death rate is increased to d = 0.65, as in [32], the different models produce distinct frequency spectra (Fig 1b). As in [32], we find that the number of high-frequency drivers is higher in the turnover model than in the no turnover model. Whereas [32] interpreted this observation as an indication that turnover reduces diversity, we find that diversity is in fact increased for all types of variants and at all frequencies. The number of somatic mutations in the turnover model is 3.4 times higher than in the surface turnover model and 6.2 times higher than in the no turnover model. This is primarily due to a higher number of cell divisions required to reach a given tumor size when cell death occurs throughout the tumor (Table S1). The Waclaw et al model uses a death rate of d = 0.65, which is a staggering 95% of the birth rate. The turnover model therefore has 8.3 times more cell divisions to reach a given size, and the surface turnover has 4 times more cell divisions than the no turnover model (Table S1).
Average number of generations for a cell in each model (estimated from the number of somatic mutations per cell divided by the mutation rate).
Cluster diversity depends on sampling position and turnover rate
To study the effect of cluster size, position of origin, and evolutionary model on CTC cluster composition, we sampled groups of cells across tumors. To assess genetic heterogeneity within clusters, we consider the number of distinct somatic mutations, S(n), among cells in clusters of size n.
As expected, we find that larger CTC clusters have more somatic mutations (Fig 2, S2). By contrast with global diversity patterns, we find that moderate turnover has a profound impact: Clusters from models with low turnover have many more somatic mutations than in the no turnover model (Fig 2a,b). Surface turnover has little effect on cluster diversity (Fig S2).

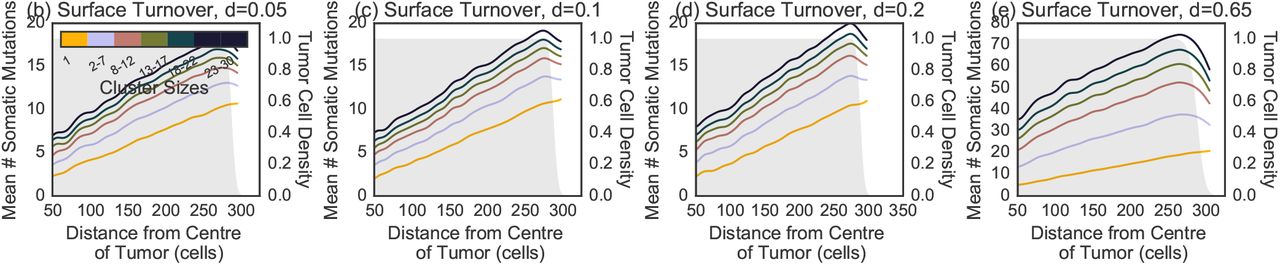
The spatial distribution of the number of somatic mutations per cluster in the (a) no turnover model is indistinguishable compared to surface turnover models with death rates (b) d = 0.05, (c) d = 0.1, (d) d = 0.2.

as a function of cluster size and position for a model with (a) no turnover, (b) turnover with d = 0.05, (c) turnover with d = 0.1 and (d) turnover with d = 0.2. A higher number of somatic mutations increases the likelihood that a metastatic progression mutation is present. The number of mutations in single CTCs increases at the edge, reflecting the larger number of cell divisions. The trend is reversed for larger clusters with at higher death rate. The shaded gray area represents the density of tumor cells at each position. The smoothed curves were obtained by a Gaussian weighted average using weight wi(x) = exp(–(x – xi)2), with xi is the distance from the centre of the tumor.
Fig 2 also shows the relationship between a CTC cluster’s shedding location (i.e. its distance to the tumor center-of-mass when it was sampled) and its genetic content. No turnover and surface turnover models show similar trends of increasing diversity with distance (Fig S2). Full turnover models show an opposite trend of decreasing diversity with distance in clusters of intermediate size (Fig 2b-d and S3 for d ∈ {0.1, 0.2} and {0.65}, respectively). However, these trends revert again when considering large clusters with thousands of cells 3.
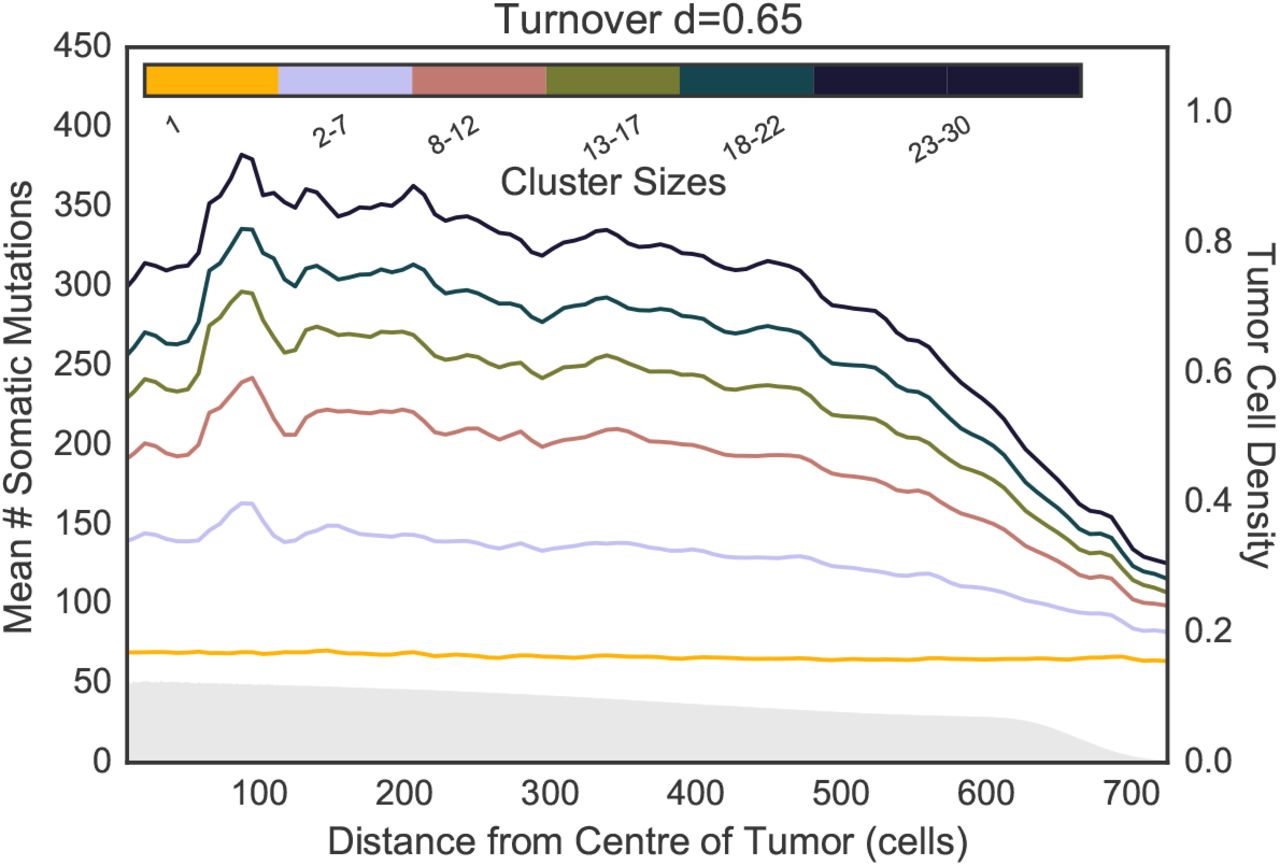
The spatial distribution of the number of somatic mutation per cluster in a turnover model with d = 0.65.
Comparison with multi-region sequencing data
To validate predictions of our model, we used multi-region sequencing data from a Hepatocellular Carcinoma (HCC) patient presented in [34] (Fig 3a). The HCC data contained 23 sequenced samples each with ≈ 20,000 cells, therefore we used our sampling scheme that produces CTCs to produce 23 biopsies of comparable sizes (20, 000 cells). The distance measurements were made using ImageJ [38] and Fig S1 from [34]. Since [34] could only reliably call variants at more than 10% frequency, we used a similar frequency cutoff in our simulations. Interestingly, even though the spatial trend in diversity are undetectable in large clusters (Fig S6), they are restored if we impose a frequency cutoff (Fig 3c, d). The spatial trends therefore strongly depends on our choice of sample size and frequency cutoff (Fig S6), with low cutoff showing weaker spatial patterns. For large samples and low cutoffs, the large number of rare, recent variants overwhelms the signal for older common variants. Such trends are similar across turnover models (Fig 2c, d) and are barely detectable with the current sample size (Fig 3b). The trends observed in the HCC data (Fig 3a) are consistent with these but not sigificant.

Cluster advantage for weak turnover models: even weak mixing (turnover model with d = 0.05) can lead to substantial differences in the cluster advantage.

Number of somatic mutations observed in a sample as a function of the frequency cutoff.

The power to detect spatial trends in diversity as a function of the frequency cutoff. With no frequency cutoff, the number of rare variants in a large biopsy (n = 20, 000 cells) overwhelms the detectable spatial pattern contributed by common variants.

Spatial distribution of the number of somatic mutations of 23 samples (20,000 cells each) in the (a) hepatocellular carcinoma patient, and (c) no turnover and (d) turnover simulated models. (b) shows the number of samples necessary to detect spatial trends from a regression analysis for CTCs and biopsies in the turnover model (d = 0.2). The shaded gray area of (a) represents the tumor purity of the samples at each position. The shaded gray area of (c) and (d) represents the density of tumor cells at each position.
Fig 3b shows the number of different samples necessary to reliably identify spatial trends. For biopsies containing tens of thousands of cells, the number of spatially distributed samples needed is ≈ 40, roughly twice the size of the HCC dataset. Furthermore, these show similar qualitative trends for both models, with an increase in diversity at the edge (Fig 3b and S7). Alternatively, ≈ 30 small cluster (23-30 cells) samples are necessary to detect spatial patterns. Furthermore, intermediate-sized clusters show qualitatively opposite trends in the different models (Fig 3b and S7). Thus small cluster sequencing may increase our power in discriminating between leading models.

The number of samples necessary to detect spatial trends from a regression analysis for CTCs and biopsies in the no turnover model.
CTC clusters derived from turnover models are more likely to contain virulent mutations
Metastasis is an inefficient process [4] in that most CTCs are eliminated from the circulatory system or fail to survive in the new microenvironment. We hypothesize that the genetic composition of CTC clusters influences the likelihood of implantation into a new microenvironment. More specifically, genetic heterogeneity within a cluster may contribute to implantation by increasing the likelihood that a metastasis progression mutation is present. If a cluster has S somatic mutations, and each mutation has a small probability p ≪ 1 of being a metastasis progression or virulence gene, the probability of having at least one such metastasis virulence gene is 1 − (1 − p)S ≈ Sp.
Diverse CTC clusters do not carry more virulent mutations, on average, than homogeneous ones, but they are more likely to carry some virulent mutations because of the increased diversity. Unless implantation probability is exactly proportional to the number of cells carrying virulent mutations in a cluster, which seems unlikely, diversity will impact implantation rate.
To compare the increased likelihood that CTC clusters possess metastatic progression genes compared to single CTCs, we determine the relative increase in the number of distinct somatic mutations in a CTC cluster versus a single CTC, i.e.,  , where S(n) is the number of somatic mutations in a cluster of size n. We refer to A(n) as the cluster advantage. A higher cluster advantage indicates that a CTC cluster is more potent relative to a single CTC from the same tumor. In other words, a higher cluster advantage means less genetic redundancy within a cluster. To disentangle the contributions from the microscopic and macroscopic diversity, as well as cluster size effects, we compute the cluster advantage for clusters composed of neighboring cells, as well as for random sets of cells sampled across the tumor (Fig 4).

as a function of cluster size for a random subset of 500 clusters drawn uniformly across the tumor. A law of diminishing returns applies to all models because of redundancy of mutations. The turnover model shows a 2-fold increase in the cluster advantage over the no turnover model.
Whereas randomly sampled sets of cells show similar and almost linear increase of the cluster advantage with sample size, cell clusters show more variability. Turnover models have the highest cluster advantage, followed by the surface turnover model, and the no turnover model (Fig 4). Higher turnover increases the cluster advantage (Fig S4). Even low turnover with at a death rate of d = 0.05 doubles the cluster advantage compared to the no turnover and surface turnover model (Fig S4).
Discussion
Even though the results of our simulations are consistent with Waclaw et al. at the tumorwide level [32], we reach opposite conclusions about the effect of cell turnover on genetic diversity. Waclaw et ah argued that turnover reduces diversity based on the observation that more high-frequency variants were observed in the tumor with turnover: A small number of clones make up a larger proportion of the tumor. Even though we can reproduce the observation, we find that turnover models in fact vastly increase diversity according to more conventional metrics, for example by increasing the number of segregating mutations across the frequency spectrum. Both the increase in dominant clone frequency and increased overall diversity have the same simple origin: A tumor model with turnover requires more cell divisions to reach a given size. An early driver mutation has more time to realize a selective advantage and occupy a high fraction of the tumor, but carrier cells are also more likely to accumulate new mutations along the way leading to increased diversity (Figure 1 and Table S1).
The impact of turnover on cellular heterogeneity is particularly pronounced when considering small cell clusters. These fine-scale patterns, observed in Figs 2 and S2, can be interpreted by considering the expansion dynamics of each model and their impact on cell division and mixing. In all turnover models, the number of somatic mutations in a given cell is ≈ 2.75 × higher at the edges than at the center of the tumor, reflecting the higher number of divisions to reach the edge: The center of the tumor is occupied early, which slows down cell division.
In the no turnover and surface turnover models, cell clusters show the same overall pattern of additional diversity at tumor edge. In the turnover model, however, we observe the opposite pattern: Even though edge cells still carry the most mutations, core clusters are now more diverse than edge clusters.
Turnover increases diversity by increasing the number of cell divisions required to reach a given size, especially in the core. More cell divisions lead to more somatic mutations in single cells: core cells in the model with d = 0.2 have ≈ 3.99 somatic mutations, compared to ≈ 1.83 for the no turnover model. However, this has only a modest effect on the spatial patterns of diversity: without turnover, the number of somatic mutations per cell is 3.5 times higher at the edge than in the core, and the ratio is reduced to 2.2 when turnover is present (d = 0.2).
More importantly for diversity, turnover allows for mixing of cells from nearby clones (Fig 5c). This mixing has a smaller effect at the edge of the tumor, where the range expansion produces serial bottlenecks which reduce the effective population size relative to the tumor core. For moderate cluster sizes, this differential mixing effect overwhelms the “number of divisions” effect, and core clusters are much more diverse than edge clusters, producing distinctive gradients of diversity.

(a) In the no turnover model, the tumor front expands in the outward direction with no cell dying. There is little to no mixing and no divisions in the core: The number of somatic mutations increases with distance from the tumor center, (b) In the surface turnover model, the cells dying on the surface permit a small amount of mixing. This accounts for the higher number of somatic mutations per cluster. We still find increased diversity at the edge of the tumor because of the quiescent core, (c) In the turnover model, cells that die within the tumor can be replaced by cells from the surface as well as cells from the center. Continued division and cell mixing within the tumor mass.
The difference in somatic diversity between single CTCs and CTC clusters, measured through the cluster advantage, follows the expected law of diminishing returns: the more cells in the cluster, the fewer the number of unique mutations per cell. However, the trends vary by growth model and cluster origin. Cell mixing afforded by turnover reduces neighboring cell similarity and increases cluster advantage.
Under the assumption that the presence or absence of a metastatic progression allele modulates metastatic potential of tumor cell clusters, the proportion of metastatic lesions that derive from circulating tumor cell clusters is highest in the turnover model. We can think of this as interference occurring between cells within a cluster. Alternately, this is an illustration of the advantage of not putting all one’s egg in the same basket, applied to tumor metastasis: Assuming that there is a chance component to cluster implantation, mixing increases the likelihood that at least one virulence cell makes it to a hospitable site. Such an effect should be robust to details of the growth model.
In experiments, CTC clusters derived from primary breast and prostate tumors produced more aggressive metastatic tumors [5] compared to single CTCs. This is likely due to differences in mechanical properties of the cluster or the creation of a locally favorable environment by the cluster, rather than by genetic differences. However, the present analysis suggests that this advantage can be enhanced by diversity within the cluster.
Both fine-scale mixtures of cell phenotypes and clonally constrained mutations have been observed experimentally in tumors [17,20]. Similarly, multi-region sequencing revealed high tumor heterogeneity in clear cell renal carcinoma (ccRCC) [22], but low levels in lung adenocarcinomas [21]. This strongly suggests that the amount of migration and mixing varies substantially across tumors, with ccRCC data being better described by a model with turnover, whereas lung adenocarcinoma data more closely resembles a model with low or no turnover.
Distinguishing between migration effects, turnover effects, and tumor growth idiosyncrasies is obviously challenging. Among limitations of our model, we note the assumption of spherical tumor shape and the absence of complex physical contraints (which HCC tumors may experience). Another limitation of the present model is the rigid computational grid which prevents cells from pushing each other out of the way, which constrains growth rate in the center of the tumor. This constraint plays a role in reducing diversity at the center of the tumor, but it may not be realistic in the earlier stages of tumor growth.
The importance of such effects is largely unknown, and it is likely to vary between tumors and tumor types. Fortunately, we have shown that we are at the cusp of being able to test such models quantitatively. A sampling experiment with twice as many samples than were collected in the HCC patient studied above would enable us to either validate or reject the current state-of-the-art models (Fig 3b), and sequencing of small clusters would further allow us to discriminate between the different models studied here. The HCC data is from whole exome sequencing, as are most deep tumor sequencing datasets. We expect that power would be further increased in a whole-genome sequencing experiment, however, we were unable to perform whole-genome simulations due to memory constraints.
Future data collection schemes including the lung TRACERx study [24] will help us put the state-of-the-art models to the test and identify such important parameters of tumor growth. Given our power analysis, we find that sequencing small contiguous cell clusters provides a richer picture of tumor dynamics compared to larger biopsies, with little to no loss in power, provided that few-cell sequencing can be performed accurately.
This work set out to answer two simple questions: First, should we expect substantial heterogeneity at the cellular scale within tumors and within circulating tumor cell clusters? The answer to the first question is most likely yes, as even the models with no turnover exhibit measurable cluster heterogeneity.
The second question was whether this heterogeneity, sampled through liquid biopsies or multi-region sequencing, is informative about tumor dynamics. Given that state-of-the-art models produce very different predictions about the level of cluster heterogeneity, the answer is also positive. This work identified some of the key factors that determine cluster diversity, especially the interaction between range expansion, cell turnover, and mixing. Even if no diversity were observed at all in CTC clusters, it would enable us to reject the present models in favor of models including additional biological factors that favor the clustering of genetically similar cells. Measuring diversity, or the lack of diversity, within circulating tumor cell clusters or fine-scale multi-region sequencing is therefore a promising tool for both fundamental and medical oncology.
Acknowledgments
We thank Robert Sladek, Yasser Riazalhosseini, Julien Jouganous and Hamid Nikbakht for useful discussions. This research was made possible thanks to a Canadian Institutes of Health Undergraduate Research Award in computational biology, funding reference numbers 139962 and 145987. This research was undertaken, in part, thanks to funding from the Canada Research Chairs program and a Sloan research fellowship.
Footnotes
↵* simon.gravel{at}mcgill.ca


