

Abstract
Transcription factors regulate gene expression by binding to DNA for short durations and by often binding to low-affinity DNA sequences. It is not clear how such temporally brief, low-affinity interactions can drive efficient transcription. Here we report that the transcription factor Ultrabithorax (Ubx) functionally utilizes low-affinity binding sites in the Drosophila melanogaster shavenbaby (svb) locus in nuclear microenvironments of relatively high Ubx concentration. By manipulating the affinity of svb enhancers, we revealed an inverse relationship between enhancer affinity and Ubx concentration required for transcriptional activation. A Ubx cofactor, Homothorax (Hth), was enriched together with Ubx near enhancers that require Hth, even though Ubx and Hth did not co-localize throughout the nucleus. These results suggest that low affinity sites overcome their kinetic inefficiency by utilizing microenvironments with high concentrations of transcription factors and cofactors. Mechanisms that generate these microenvironments are likely to be a general feature of eukaryotic transcriptional regulation.
Introduction
Genomic regions near coding genes, called enhancers, direct specific patterns of gene expression1–3. Enhancers contain short DNA sequences that bind sequence-specific activating and repressive transcription factor proteins; the integration of these positive and negative signals directs gene expression4. Protein-DNA binding is often an ephemeral event; studies in mammalian cells demonstrate that transcription factors disassociate within seconds of binding to DNA5–10. Furthermore, recent studies in animals ranging from fruit flies to mammals have revealed that low affinity DNA binding sites are critical to allow related transcription factors to distinguish between binding sites with similar DNA sequences11–23. Increasing the affinity of binding sites, to more stably recruit transcription factors, activates promiscuous gene expression12,24, which may lead to developmental defects. It is unclear how brief protein-DNA contacts can mediate transcription from enhancers containing low affinity binding sites.
One possible mechanism that could mitigate low binding affinity is an increase in the local concentrations of transcription factors. At the scale of a single enhancer a few hundred base pairs long, multiple low-affinity binding sites for the same transcriptions factor in close proximity could increase the frequency of binding events by locally trapping the protein compared to an isolated binding site. Furthermore, interactions of transcription factors and cofactors with multiple localized enhancers could generate “microenvironments”2 of high transcription factor concentrations.
We have explored this problem using the shavenbaby (svb) locus, which contains multiple enhancers that drive specific patterns of svb gene expression that are required for proper development of Drosophila embryos. Each of three characterized enhancers contains clusters of low-affinity binding sites for the Hox gene Ultrabithorax (Ubx). These enhancers also require a Ubx cofactor Homothorax (Hth) to function11. We have exploited robust transgenic tools in Drosophila, new fluorescent dyes, and new approaches to prepare embryos for microscopy to systematically perturb these svb enhancers and directly image the results at a sub-nuclear level. We find that microenvironments of high Ubx and Hth concentrations mediate transcription from low-affinity enhancers.
Results
Ubx is present in microenvironments of varying local concentrations
We first examined whether nuclei in Drosophila embryos possess Ubx microenvironments by performing immunofluorescence (IF) staining in fixed embryos and super-resolution confocal imaging using Airyscan (Carl Zeiss Microscopy, Jena, Germany). We found that Ubx protein was not distributed uniformly, but rather exhibited regions of high and low Ubx intensities (Figure 1a, b). To observe Ubx distribution at higher resolution, we expanded the size of the embryos25 by approximately four-fold in each dimension (Figure 1c, materials and methods). Nuclei of expanded embryos revealed distinct regions of high Ubx intensity separated by regions of low Ubx intensity. We observed, on average, 184.9 ± 24.6 (n = 12, 3 embryos) clusters per nucleus that were stronger than one-quarter of the maximum Ubx intensity (Figure 1d, e, & S1).

(a) 3D projection of a single nucleus stained for Ubx protein. (b) Surface plot of contiguous Ubx regions containing a minimum of four pixels with signal intensity greater than twenty-five percent of the maximum intensity. (c) Centroids of the Ubx regions found in panel (b).
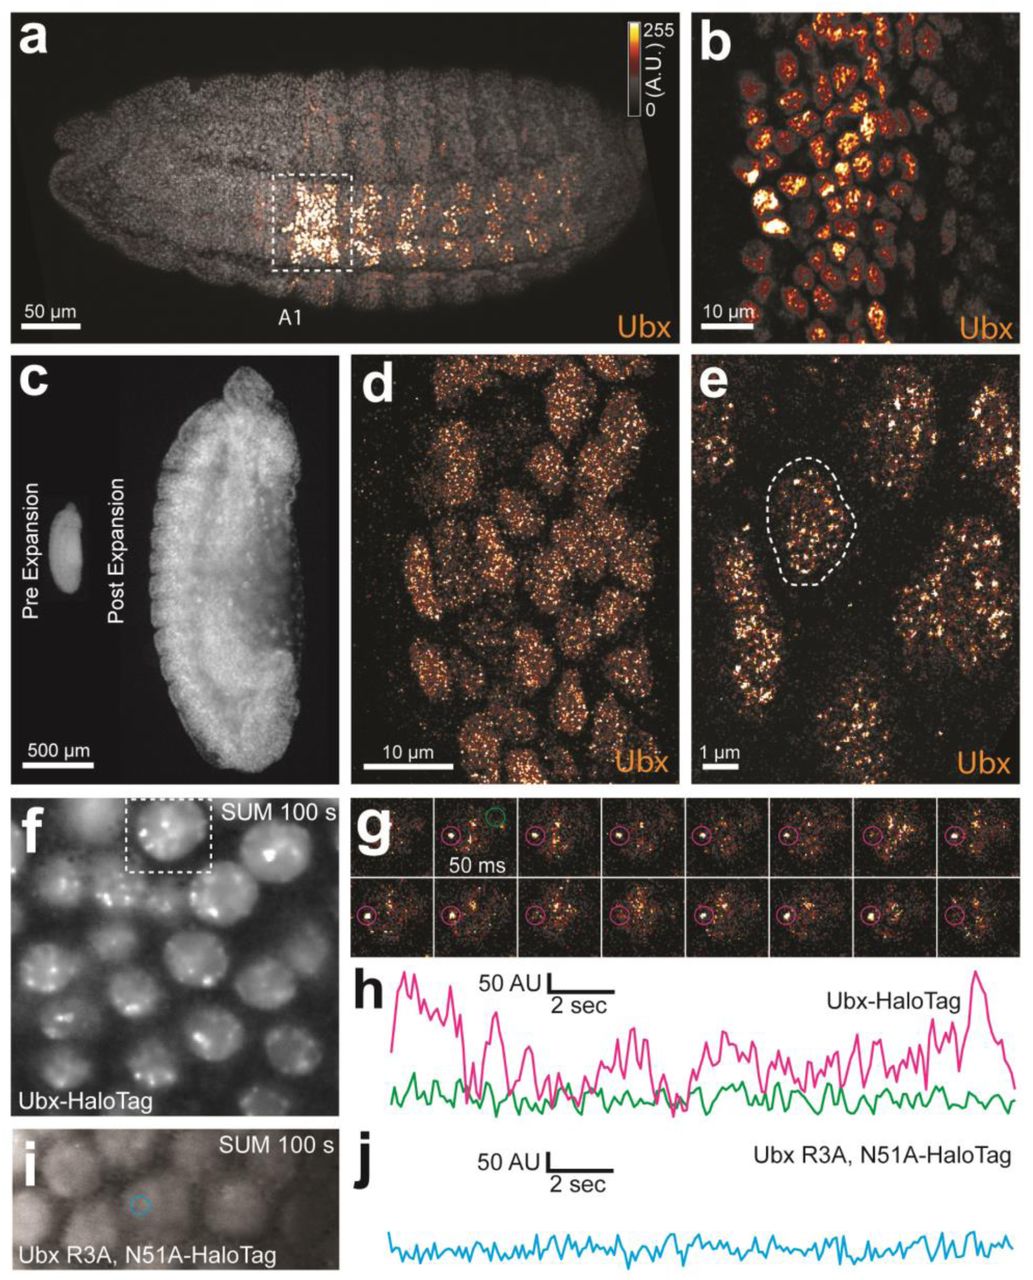
(a, b) Stage 15 embryos stained for Ubx protein with a bounding box indicating a ventral region of abdominal segment one (A1). (b) Higher magnification, Airyscan image of the region indicated in panel (a). (c) Stage 15 embryo pre- and post-expansion. (d, e) Expanded stage 15 embryos stained for Ubx protein. The dashed line encircles a single nucleus (e). (f, i) Projections of summed pixel intensity over 100 seconds from videos of nos::GAL4, UAS::HaloTag-Ubx for either a wild-type Ubx (f) or a binding deficient Ubx (i), imaged with JF635 Dye. (g) Sixteen individual, 50 millisecond video frames of the nucleus surrounded by a dashed box in panel (f). (h, j) Temporal traces of the signal intensity of the regions noted in panel (g) or (i). The color of each trace corresponds to the colors of the circles in panels (g) and (i). AU indicates Arbitrary Units of fluorescence intensity.
One explanation for the observed distribution of Ubx is that transcription factors localize generally to accessible regions of the nucleus that have high levels of transcriptional activity. This mechanism, if shared by transcription factors in general, should yield Ubx distributions that mostly overlap with that of other transcription factors. Engrailed (En), a transcription factor unrelated to Ubx, displayed non-uniform sub-nuclear concentrations, but its distribution only partially overlapped that of Ubx (Figure S2a-c, white regions indicate overlap). We similarly observed only partial overlap between Ubx and Even-skipped (Eve) (Figure S2d-f). Abdominal-A (AdbA), a paralog of Ubx that is expressed mainly in separate cells from Ubx and that has similar DNA binding specificity as Ubx, was excluded from Ubx regions in the few nuclei where both were expressed (Figure S3g-i). These results indicate that the distributions of these transcription factors do not result from a shared mechanism that limits the distribution of all transcription factors to the same sub-nuclear space.

(a-c) Stage 15 embryo stained with an antibody against Engrailed (En) and Ubx protein (b and c). (c) A higher magnification of the area in the bounding box of panel (a). (d-f) Stage 15 embryo stained with an antibody against histone Eve and Ubx protein (e and f). (f) A higher magnification of the area in the bounding box of panel (d). (g-h) Stage 15 embryo stained with an antibody against histone AbdA and Ubx protein (h and i). (i) A higher magnification of the area in the bounding box of panel (g).
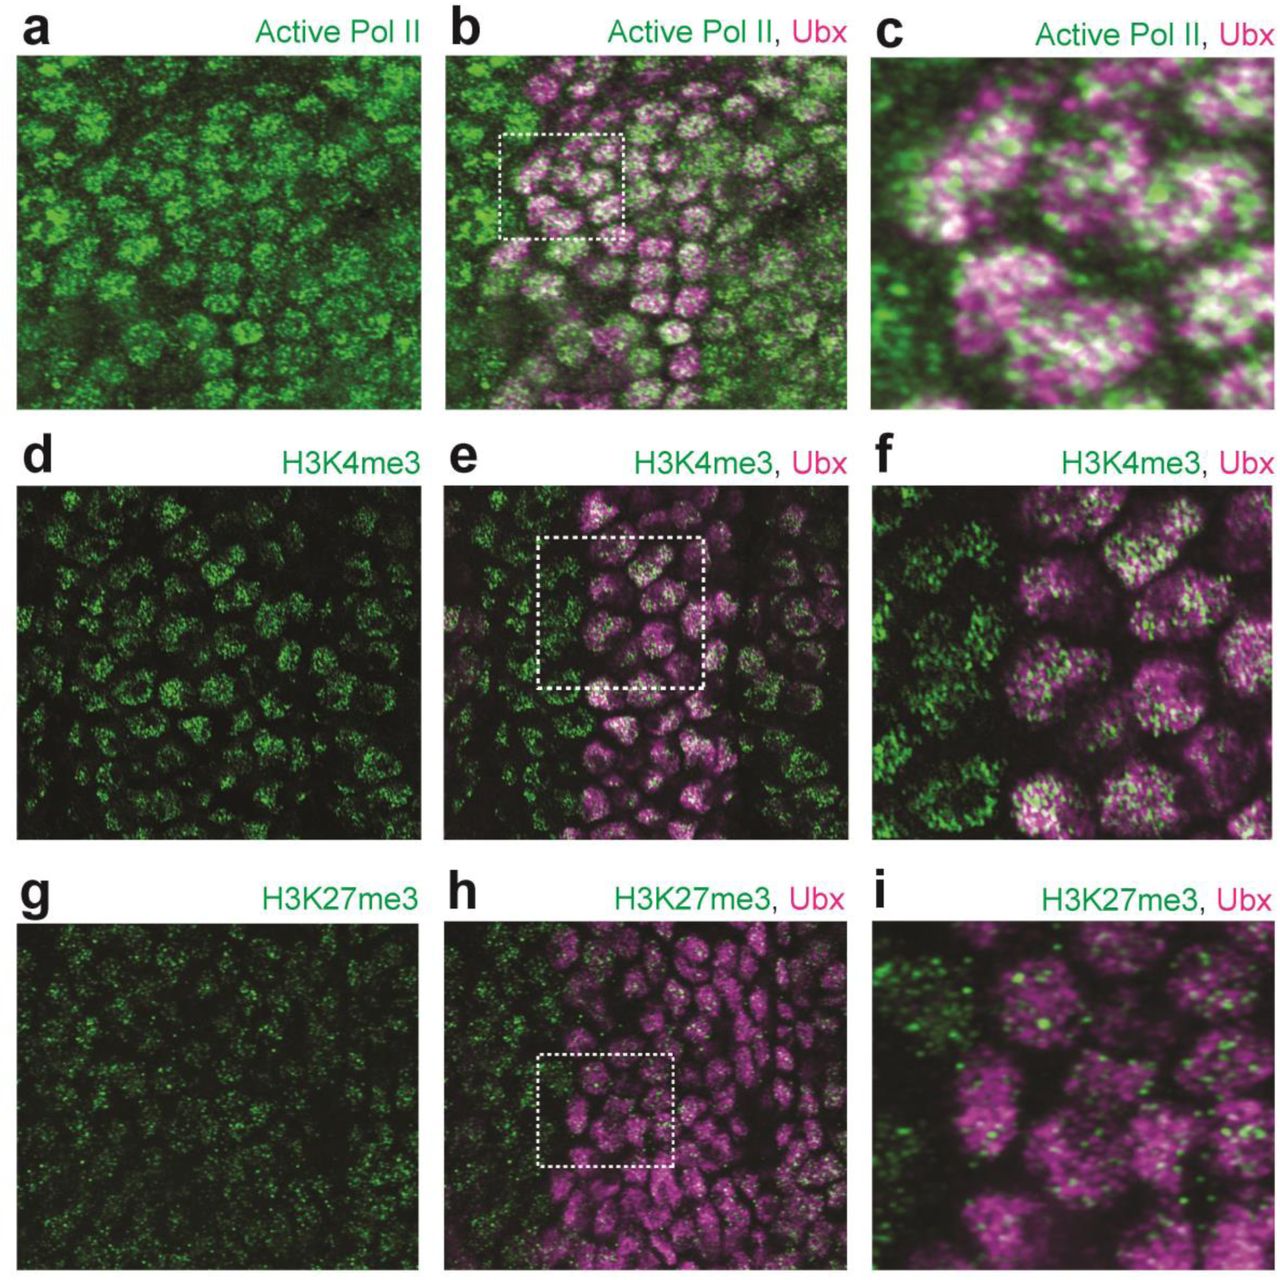
(a-c) Stage 15 embryo stained with an antibody against RNA Polymerase II RPB1 (active Pol II) and Ubx protein (b and c). (c) A higher magnification of the area in the bounding box of panel (b). (d-f) Stage 15 embryo stained with an antibody against histone H3K4me3 and Ubx protein (e and f). (f) A higher magnification of the area in the bounding box of panel (e). (g-h) Stage 15 embryo stained with an antibody against histone H3K27me3 and Ubx protein (h and i). (i) A higher magnification of the area in the bounding box of panel (h).
We also examined whether Ubx simply occupies regions containing actively transcribed DNA. Both active RNA Polymerase II (Pol II) and the methylated histone H3K4me3, which marks actively transcribed DNA, only partially overlapped with Ubx (Figure S3a-f). In contrast, the histone mark H3K27me3, which marks regions of repressed chromatin, displayed almost no overlap with the distribution of Ubx (Figure S3g-i). Thus, Ubx is not simply restricted to regions inside the nucleus that are available to other transcription factors or to regions of high transcriptional activity.
Ubx repeatedly binds to specific regions in nuclei of live embryos
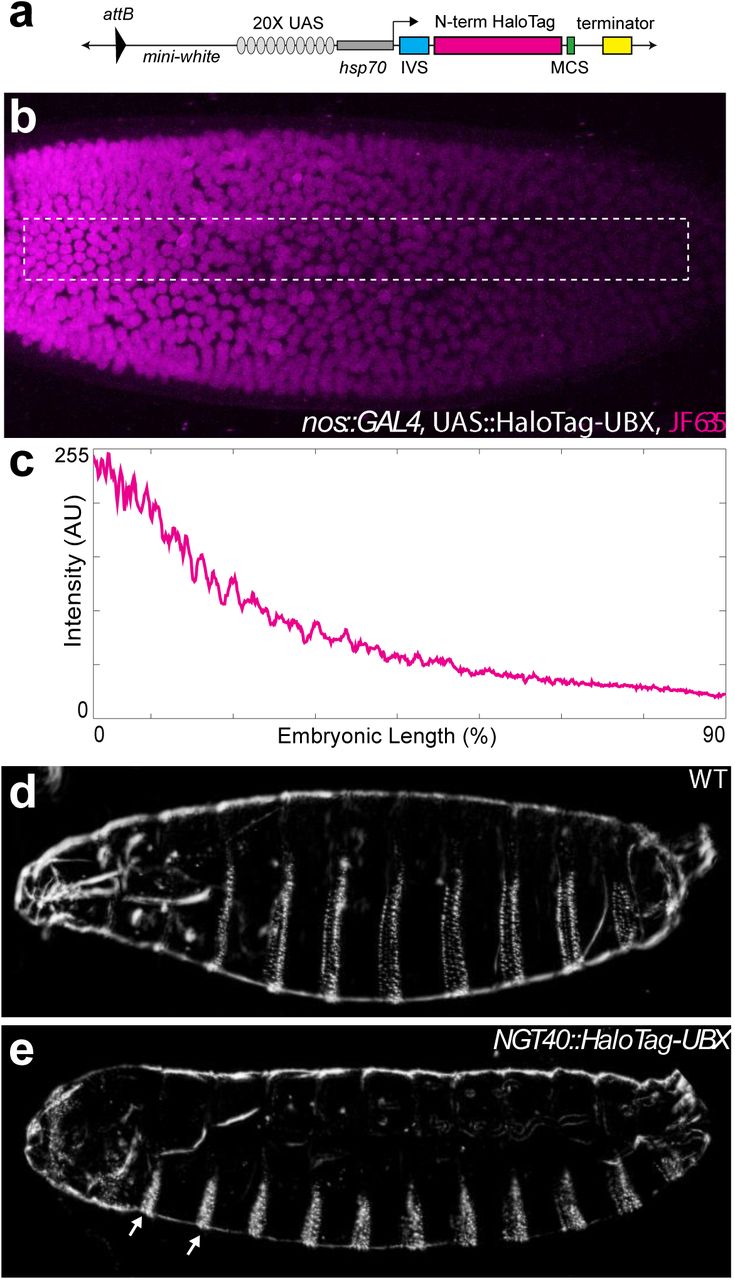
We tested whether the heterogeneous protein distributions we observed were an artifact of the fixation protocol26 by examining the spatiotemporal dynamics of single Ubx molecules in live Drosophila embryos (Figure S4a, material and methods). Single-molecule imaging has been performed previously in cell-lines because live-imaging studies in embryos requires overcoming several new challenges, including imaging at lower signal-to-noise ratios than in cells, compensating for rapid changes during embryonic development, and determining how to deliver fluorescent dyes. We overcame these challenges by generating a HaloTag-Ubx transgene that allowed precise control of fusion protein levels (Figure S4a) and coupling HaloTag-Ubx in vivo to new, strongly fluorescent dyes27. Over-expression of the HaloTag-Ubx transgene recapitulated known embryonic developmental defects, indicating that the HaloTag-Ubx protein retained its function to activate transcription (Figure S4d & e). We then expressed HaloTag-Ubx with a nanos promoter, which resulted in HaloTag-Ubx expression in all cells at early developmental stages, and injected the HaloTag ligand of Janelia Fluor 635 (JF635)28 into these live embryos. JF635 is minimally fluorescent in solution but its fluorescence increases by over 100-fold when bound to a HaloTag protein, allowing the detection of labeled Ubx molecules against a background of dim freely diffusing dyes. The fluorescence intensity of labeled Ubx scaled with distance from the site of dye injection (Figure S4b & c), consistent with dye diffusion from the site of injection.

(a) Schematic of the N-terminal HaloTag construct. (b) Stage 5 embryo with nos::GAL4, UAS::HaloTag-Ubx and injected with JF635 dye at the anterior end (magenta). (c) Quantification of the signal intensity of the bounded region in panel (b) along the embryonic axis. A.U. indicates Arbitrary Units of fluorescence intensity. (d, e) Cuticle preps of first instar larva from either a wild-type (WT) (d) or nos::GAL4, UAS::HaloTag-Ubx embryo. (e) Arrows point to the nos::GAL4, UAS::HaloTag-Ubx induced transformation of anterior segments.
To measure the density of HaloTag-Ubx in nuclei of live embryos, we calculated the average intensity over 100 s (2000 frames). We observed regions of Ubx signal (3-10x background) similar to the high-intensity clusters observed in fixed embryos (Figure 1f). We examined the dynamics of HaloTag-Ubx in nuclei by plotting fluorescence intensity over time (Figure 1g & h and Figure S6). This revealed binding of HaloTag-Ubx in specific nuclear domains with residence times on the order of seconds. These timescales are consistent with transcription factor-DNA binding dynamics measured in live-cell imaging experiments using mammalian cell lines5,7–10,29. These repeated binding events apparently produced the high intensities observed in the time-averaged projections. These live-imaging results indicate that Ubx concentrates and remains within specific nuclear regions.

(a) Fifty millisecond video frame from video of nos::GAL4, UAS::HaloTag-Ubx with a higher number of HaloTag-Ubx molecules (compare with Fig 1), imaged with JF635 dye. (b) 3D surface plot of the nucleus indicated in panel (a). (c) Individual, 50 millisecond video frames of the nucleus from panel (a). (d) Signal traces of the signal intensity of the regions noted with red and green circles in panel (c). AU indicates Arbitrary Units of fluorescence intensity.

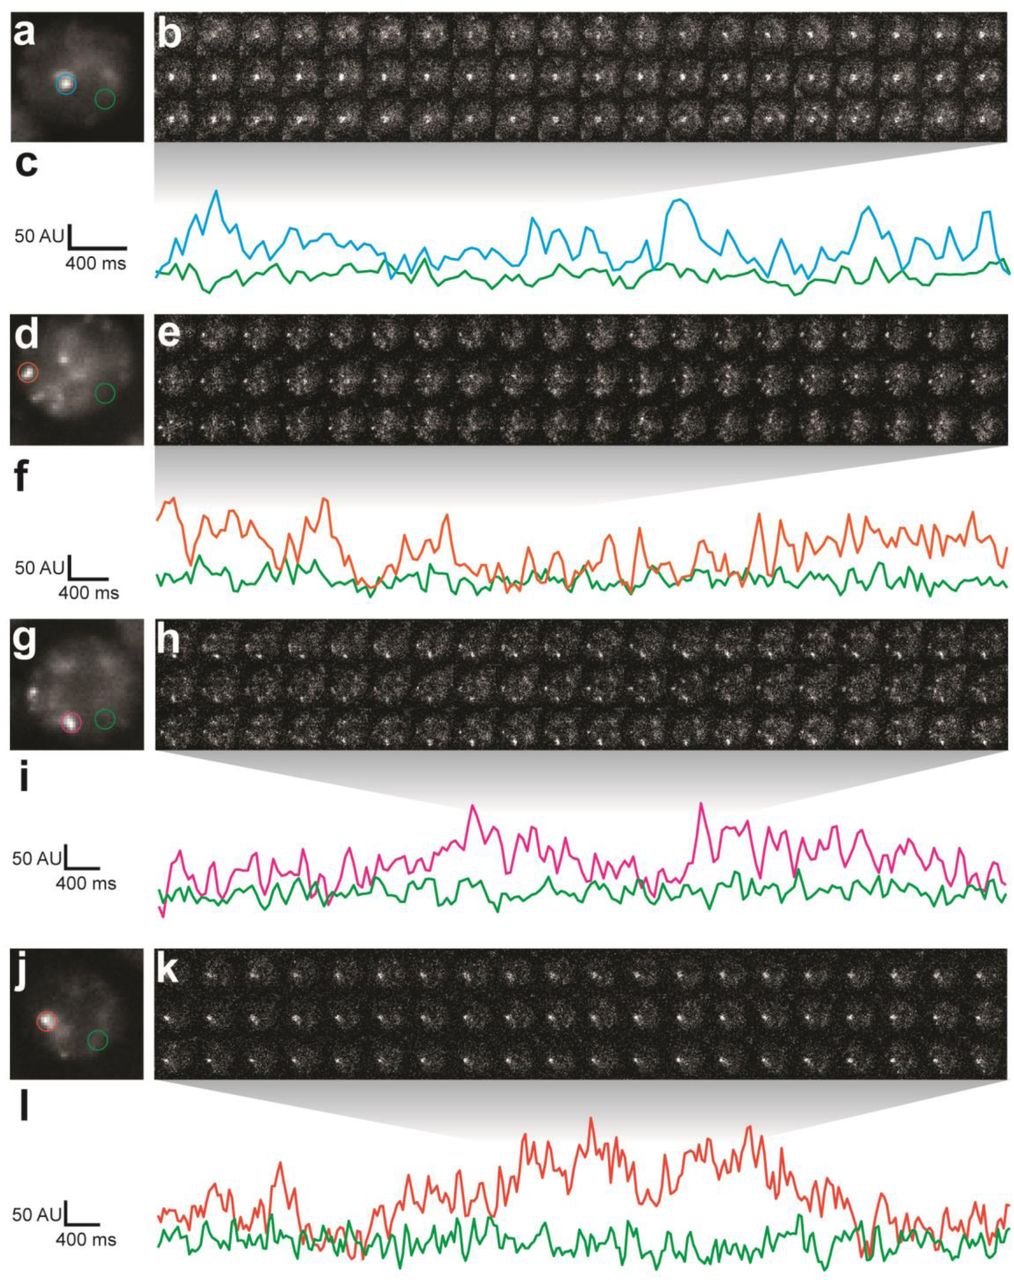
(a, d, g, j) Projections of summed pixel intensities over 100 seconds of nos::GAL4, UAS::HaloTag-Ubx nuclei imaged with JF635 dye. (b, e, h, k) Individual 50 millisecond video frames of the nuclei in panels (a, d, g, j). (c, f, i, l) Signal traces of the signal intensity of the regions noted in panels (a, d, g, j), where color of trace corresponds to color of circle. AU indicates Arbitrary Units of fluorescence intensity.
To determine whether regions of high Ubx concentration depended on DNA binding, we performed the same experiments with a version of the HaloTag-Ubx transgene in which Arg3 and Asn51 of the homeodomain were mutated to Ala (R3A and N51A), which abrogates DNA binding30. The DNA-binding deficient Ubx did not display any spatial heterogeneity nor fluctuations in intensity consistent with transcription-factor DNA binding events (Figure 1i & j), suggesting that binding of Ubx to DNA is required to generate restricted nuclear distributions of Ubx.
Transcriptionally active svb loci and enhancers correlate with regions of high Ubx concentration
The heterogeneous distributions of Ubx we observed are consistent with the hypothesis of nuclear “microenvironments”2, whereby high local concentrations of transcription factors may drive transcription. Therefore, we examined whether these regions of high Ubx concentration co-localized with sites of active transcription. The svb gene is directly regulated by Ubx protein through binding of Ubx to low-affinity sites in multiple svb enhancers11. We marked sites of active svb transcription by fluorescence in situ hybridization (FISH) and compared the localization of actively transcribed svb loci to Ubx protein concentration (Figure 2a & b). We observed high local Ubx concentrations surrounding active svb transcription sites (Figure 2c-f). To quantify Ubx distributions around these sites, we calculated the average Ubx intensity as a function of distance r from the point of maximum FISH intensity for each svb transcription site (Figure 2g-i and materials and methods). Ubx intensity was normalized to 1 at r = 0 (maximum FISH intensity) and averaged across all sites measured. To adjust for background fluorescence, we located the minimum intensity in the averaged Ubx distribution (r = 2-4 μm) and subtracted that value from the distribution. The first μm of the radially averaged 3D distribution is shown, with the shaded area representing the variance (Figure 2j). Within the first μm, svb transcription sites showed a relative enrichment of Ubx and were located on average at a local maximum of Ubx concentration. The normalized Ubx intensity after background subtraction at the site of svb transcription was 0.60 ± 0.17 (n = 59, 4 embryos, uncertainty is the variance of the background) and decreased approximately 250 nm away from the site. Thus, active svb transcription sites colocalized with areas of high Ubx concentration spanning approximately a few hundred nanometers.

(a-d, g) Embryos co-stained for both Ubx protein and svb intronic mRNA. Bright spots of svb intronic mRNA mark actively transcribed svb loci. (b) Higher magnification, Airyscan image of the region noted in panel (a), revealing sites of svb transcription (green). (c, d) Higher magnification, Airyscan images of the nuclei noted in panel (b). (e, f) 3D surface plots of the images in panels (c) and (d), centered on the sites of svb transcription (green), where height represents Ubx intensity. (h) 3D view of the confocal stack from the nuclei in panel (g). (i) Schematic outlining the method of Ubx quantification surrounding svb transcriptional sites. A 3D radial distribution of the average Ubx intensity on the surface of a sphere centered at the site of svb transcription, was calculated. The gray sphere and white outlines is an example of the sphere with a radius r = 1 μm. (j) Quantification of the average relative concentration of Ubx and the distance from svb transcription sites (n = 59, see supplemental methods “settings for extracting radially averaged distributions” for how relative concentration is computed). The shaded region indicates the variance. A.U. indicates Arbitrary Units of fluorescence intensity.
If Ubx protein co-localizes with actively transcribed svb loci because Ubx drives svb expression, then we would expect that transcription at a locus not regulated by Ubx should not co-localize with high Ubx concentrations. Indeed, we observed that active transcription sites driven by a synthetic enhancer containing binding sites for a TALEA transcription factor4,31,32 did not show Ubx enrichment on average despite wide fluctuations in Ubx levels, with a relative enrichment of Ubx at TALEA driven enhancers of 0.02 ± 0.63 (Figure 3a-c, n = 29, 3 embryos).

(a) Schematic of the synthetic TALEA transcription network driven by the Hunchback (Hb) promoter, indicating TALEA binding sites with green circles. (b) Early stage 15 embryos carrying the TALEA synthetic network stained with an antibody against β-Galactosidase. (c) Quantification of the relative concentration of Ubx based on the distance from synthetic network transcription sites. (d) Schematic of the shavenbaby locus, indicating embryonic cis-regulatory enhancers in boxes. The ventral embryonic enhancers DG3, E3N and 7H are highlighted in magenta, yellow and blue boxes, respectively. (e, g, i, k, m, o, q) Early stage 15 embryos carrying the reporter constructs DG3-lacZ (e), E3N-lacZ (g, i, k), or 7H-lacZ (m, o, q) stained with an antibody against β-Galactosidase, with Ubx-Exd sites altered as indicated. (f, h, j, l, n, p, r) Quantification of the relative concentration of Ubx versus the distance from svb transcription sites. The shaded regions in panels (c, f, h, j, l, n, p, r) indicate the variance. A.U. indicates Arbitrary Units of fluorescence intensity.
Manipulation of binding site number and affinity changes the level of Ubx enrichment around svb enhancers
The experiments described so far showed that the actively transcribed native svb locus co-localizes with local concentration maxima of Ubx in the nucleus. We wondered whether binding site affinity modulates the location of transcription relative to Ubx microenvironments. To address this question we examined transcription driven by the individual svb enhancers DG3, E3N, and 7H, each of which contains a cluster of low-affinity Ubx binding sites and can independently drive transcription of a reporter gene when moved from their native location11. Transcription sites driven by these relocated enhancers also colocalized with regions of high Ubx concentration (Figure 3d). The relative Ubx enrichment for each of the three enhancers was 0.56 ± 0.16 for DG3 (n = 61, 3 embryos), 0.51 ± 0.19 for E3N (n = 142, 11 embryos), and 0.68 ± 0.10 for 7H wildtype (n = 38, 3 embryos) (Figure 3e-h, m, n). These results indicate that low-affinity enhancers actively transcribed far from the native svb locus also co-localize with microenvironments of high Ubx concentrations.
Increasing the binding affinity of a site should increase its sensitivity to lower Ubx concentrations. We found previously that replacing a single low-affinity Ubx site with one of a higher affinity led to higher levels of expression and sometimes drove promiscuous transcription11, suggesting that more stable Ubx-DNA interactions allowed higher transcriptional activation. Consistent with these previous results, we observed that increasing the affinity of a single low-affinity binding site in the E3N enhancer decreased enrichment in Ubx microenvironments to 0.44 ± 0.27 (Figure 3i & j, E3N High Affinity, n = 36, 3 embryos).
In contrast, we reported previously that deletion of low affinity binding sites reduced transcription11. Removing some Ubx binding sites should lower the effective affinity of the entire enhancer and we hypothesized that this may result in transcription only when genes are associated with areas of higher Ubx concentrations. Consistent with this model, when we deleted two low-affinity sites in E3N, active transcription was observed in regions of increased Ubx enrichment (0.65 ± 0.18, Figure 3k & l, E3N Mut23, n = 62, 5 embryos). Deletion of two low-affinity Ubx sites for the 7H enhancer did not alter Ubx enrichment around transcription sites (0.63 ± 0.37, Figure 3o & p, 7H Mut23 n = 81, 6 embryos). But, deletion of three Ubx binding sites in the 7H enhancer increased relative Ubx enrichment, consistent with the pattern we observed for the E3N enhancer (0.91 ± 0.27, Figure 3q & r, 7H Mut123, n = 52, 8 embryos).
Across all manipulations, we observed an inverse correlation between affinity and the distribution of Ubx intensities at transcription sites (Figure S7). Thus, the number of Ubx binding sites and their affinities determine the response of svb enhancers to local Ubx concentration. Lower affinity enhancers require higher Ubx concentrations to drive transcription. Conversely, higher affinity enhancers can drive transcription at lower local Ubx concentrations.

The Ubx intensity distributions at transcription sites were plotted for the E3N and 7H enhancers after subtraction of background fluorescence from raw Ubx intensities. The naming convention of the enhancers follows that of Figure 3. The density (y- axis) for each distribution is calculated by the count per bin divided by a normalization factor. The normalization factor is the bin size multiplied by the number of transcription sites (n) in the dataset. The dotted gray line is the median of the distributions, which are: (a) 160 for E3N High Affinity, (b) 290 for E3N WT, (c) 400 for E3N Mut23, (d) 260 for 7H WT, (e) 350 for 7H Mut23, and (f) 440 for 7H Mut123.
The Ubx cofactor Homothorax (Hth) is co-enriched around transcription sites with Ubx
Co-factors can stabilize low-affinity binding interactions through cooperative interactions with transcription factors. A co-factor-dependent enhancer would require sufficient concentrations of both the factor and the co-factor to drive transcription. The homeodomain proteins Extradenticle (Exd)/Pbx and Homothorax (Hth)/MEIS30,33–35 interact with Ubx during DNA binding and Ubx and Hth regulate a partially overlapping set of genes36,37. In vitro, Ubx requires Hth/Exd to bind to the low-affinity sites in 7H and E3N11. In vivo, Hth deficiency led to the loss of expression for both 7H and E3N (Figure 4a-d). Consistent with this co-requirement for Ubx and Hth, Hth was co-enriched with Ubx around active transcription sites driven by 7H or E3N (Figure 4e-t). The relative enrichment for Ubx and Hth respectively was 0.58 ± 0.14 and 0.41 ± 0.16 for 7H (n = 51, 7 embryos) and 0.66 ± 0.13 and 0.39 ± 0.24 for E3N (n = 74, 5 embryos). These results suggest that transcription from co-factor-dependent enhancers requires microenvironments that contain high concentrations of both transcription factors and their co-factors.

(a-d) Early stage 15 embryos with 7H-lacz (a-b) or E3N-lacZ reporter constructs (c-d) stained with an antibody against ß-Galactosidase in either Wild-type (WT) (a and c) or hthP2 mutant embryos (b and d). (e-h) A nucleus displaying active transcription of the 7H-lacZ reporter construct denoted by a bounding box (e-h) and co-stained for Ubx protein (f), Hth protein (g), or both Ubx and Hth proteins (h). (i-l) A nucleus displaying active transcription of the E3N-lacZ reporter construct denoted by a bounding box (i-l) and co-stained for Ubx protein (j), Hth protein (k), or both Ubx and Hth proteins (l). (m-p) 3D surface plots of the images in panels (f, g, j, k), centered on the sites of enhancer activity (yellow). The height of the plot is Ubx intensity in panels (m) and (o) and Hth intensity in panels (n) and (p). (q-t) Quantification of the relative concentration of Ubx (q, s) and Hth (r, t) versus distance from active enhancer sites. The shaded regions indicate the variance. A.U. indicates Arbitrary Units of fluorescence intensity. (u, v) A conceptual model showing nuclei with multiple regions of high local concentrations of Ubx or Hth (u) and high local concentrations of both Ubx and Hth that allow rapid ON rates (v, grey arrows) and collectively may recruit RNA pol II complexes.
Discussion
Biological systems often generate locally high concentrations of interacting molecules to increase the efficiency of biochemical reactions38,39. This appears to be true also for transcription from low-affinity enhancers. Microenvironments2 of high local concentrations of transcription factors and their co-factors may circumvent the instability of low-affinity interactions by promoting more frequent DNA binding and cooperative interactions13 (Figure 4u & v). Many mechanisms might create these observed transcription factor microenvironments. First, clustered binding sites for the same transcription factor18 could lengthen the dwell time of proteins near enhancers and increase effective local protein concentrations40–45. Second, cooperative interactions between transcription factors and co-factors, each of which may bind independently to enhancers, may stabilize transcription factors at low-affinity sites13,46. Finally, clustering of enhancers could trap transcription factors over longer length scales47–51, perhaps generating the 200 to 400 nm microenvironments that we observed. This last model is supported by recent findings that multiple promoters can share the same enhancer in a common local environment52.
Transcription factor microenvironments may be a general feature of eukaryotic transcription, as supported by studies showing mouse and human cells exhibiting RNA polymerase II crowding53,54, transcription factors using local clustering to efficiently find their binding sites5,7, and chromatin packaging in Drosophila cells generating distinct chromatin environments at the kilobase-to-megabase scale55. Collectively, these findings are consistent with a phase-separated model of transcriptional regulation56, whereby transcription occurs in distinct microenvironments containing the correct combination of proteins. Enhancers acting as DNA scaffolds for protein binding could provide the anchoring interactions that form transcriptional microenvironments. These microenvironments could, in turn, provide a mechanism to allow efficient transcription from low-affinity enhancers.
Materials and methods
Preparing fixed Drosophila embryos
D. melanogaster strains were maintained under standard laboratory conditions. All enhancer constructs were cloned into the placZattB expression construct with a hsp70 promoter1. Transgenic fly lines were made by Rainbow Transgenic Flies Inc. E3 and 7H were integrated at the attP2 landing site. DG3 was integrated at ZH-86Fb.
Immuno-fluorescence staining of transcription factors and in situ hybridization to mRNA
Flies were reared at 25 °C and embryos were fixed and stained according to standard protocols1. Primary antibodies were detected using secondary antibodies labeled with Alexa Fluor dyes (1:500, Invitrogen). In situ hybridizations were performed using DIG labeled, antisense RNA-probes against reporter construct RNA or the first intron of svb. DIG RNA products were detected with a DIG antibody: Invitrogen, 9H27C19 (1:200) or LacZ: Promega anti-ß-Gal antibody (1:1000).
The following primary antibodies were used at the indicated concentrations:
Ubx: Developmental Studies Hybridoma Bank, FP3.38-C (1:20)
Hth: Santa Cruz Biotechnology (dN-19), sc-26186 (1:50)
Eve: Developmental Studies Hybridoma Bank, 2B8-C (1:20)
AbdA: Santa Cruz Biotechnology (dN-17), sc-27063 (1:50)
En: Santa Cruz Biotechnology (d-300), sc-28640 (1:50)
RNA PolII RPB1: BioLegend, (920304), (1:200)
Histone H3K27me3: Active Motif, 39157 (1:200)
Tri-Methyl-Histone 3K4: Cell-signaling technology C42D8 (1:200)
Imaging fixed embryos with Airyscan
Fixed Drosophila embryos mounted in ProLong Gold mounting media (Molecular Probes, Eugene, Oregon, USA) were imaged on a Zeiss LSM 880 confocal microscope with Airyscan (Carl Zeiss Microscopy, Jena, Germany) using Airyscan in SR mode to obtain images with 1.7-fold higher resolution compared to diffraction-limited confocal imaging57 (supplemental methods: imaging setup for Airyscan). Images presented in the figures were processed with ImageJ58.
Expanding fixed embryos
To expand embryos, after fixation and staining, embryos were embedded into poly-acrylate gels and expended according to a previously published protocol25 (supplemental methods: handling expansion gels).
Imaging expanded embryos
Expanded gels containing embryos were imaged in 6-well glass bottom plates (Cellvis, Mountain View, California, USA) using a Zeiss LSM 800 confocal microscope (Carl Zeiss Microscopy, Jena, Germany) using standard settings (supplemental methods: imaging setup for expanded embryos).
Preparing embryos for live imaging
Embryos were injected following previously established protocols59 with the HaloTag ligand of JF635. Briefly, embryos were collected for 30 minutes at 25 °C and placed in oxygen permeable Halocarbon 27 oil. The stock dye solution of 1 mM JF635 with a HaloTag ligand in DMSO was diluted 1:100 into fly injection buffer and injected into the posterior end of the embryos. The embryos were then aged to stage 8 and imaged in oxygen permeable Halocarbon 27 oil.
Live imaging of Drosophila embryos
Injected embryos were imaged on a customized inverted Nikon Ti-Eclipse (Nikon Instruments, Tokyo, Japan) with the appropriate settings (supplemental methods: imaging setup for live embryos).
Radially averaged distributions centered around transcription sites
To obtain the distributions of Ubx and Hth around a transcription site, the processed stacks obtained from the Zeiss LSM 880 confocal microscope were analyzed in Fiji60 using native functions and the 3D ImageJ Suite plugin61. Radially averaged distributions were computed in Matlab (MathWorks, Natick, Massachusetts, USA) using custom scripts (supplemental methods: settings for extracting radially averaged distributions).
Acknowledgements
We thank Richard Mann, Timothée Lionnet, Paul Tillburg and Brian English for experimental design advice and assistance. We thank François Payre for advice on data presentation. We thank all members of the Stern and Singer labs for discussion. Albert Tsai is a Damon Runyon Fellow of the Damon Runyon Cancer Research Foundation (DRG 2220-15). Robert H. Singer is supported by the 4D Nucleome Award U01-EB21236.


