

Abstract
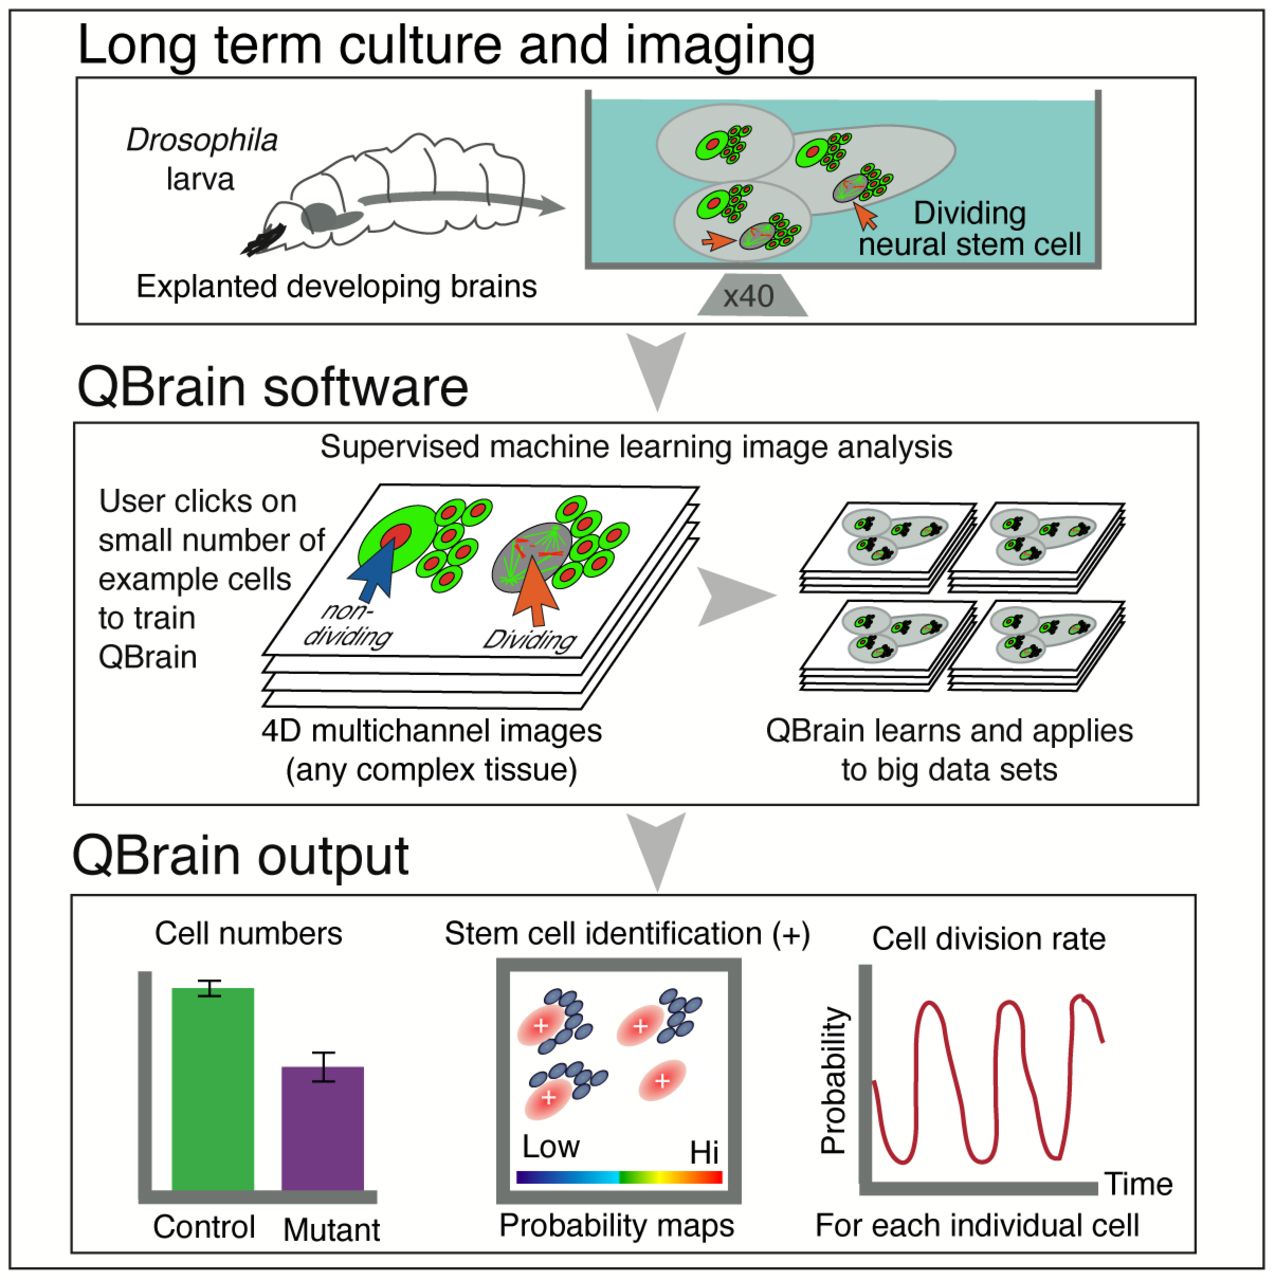
In Brief We have optimised imaging of explanted Drosophila brains and developed novel 4D machine learning image analysis software that out performs existing methods in characterising brain malformation mutants. Our new techniques can be applied widely to analyse the development of complex tissues in terms of the behaviour of individual cells.

Highlights
Time-lapse imaging of developing ex-vivo cultured brains in excess of 30 hours
QBrain: machine learning quantitation of cell types and division in complex tissue
Outperforms other state-of-the-art machine learning image analysis tools
Automated characterisation of cause of a complex enlarged mutant brain phenotype
SUMMARY Brain malformations often result from subtle changes in neural stem cell behaviour, which are difficult to characterise using current methods on fixed material. Here, we tackle this issue by establishing optimised approaches for extended 3D time-lapse imaging of living explanted Drosophila brains and developing QBrain image analysis software, a novel implementation of supervised machine learning. We combined these tools to investigate brain enlargement of a previously difficult to characterise mutant phenotype, identifying a defect in developmental timing. QBrain significantly outperforms existing freely available state-of-the-art image analysis approaches in accuracy and speed of cell identification, determining cell number, location, density and division rate from large 3D time-lapse datasets. Our use of QBrain illustrates its wide applicability to characterise development in complex tissue, such as tumours or organoids, in terms of the behaviour in 3D of individual cells in their native environment.
INTRODUCTION
The human brain develops through the regulated proliferation and differentiation of a small number of neural stem cells, leading to a vast and diverse population of neurons and glia (Kohwi & Doe, 2013). Elucidating the molecular basis of these processes is important for basic neuroscience and critical for discovering new treatments for neurological diseases. However, this goal is daunting due to the huge complexity of the human brain, which consists of 1011 neurons, and the difficulty of imaging mammalian brains at cellular resolutions using light microscopy. Simpler model systems offer a way forward, as whole zebrafish and Drosophila brains can be effectively imaged at the cellular level (Barbosa & Ninkovic, 2016; Dray et al., 2015; Medioni et al., 2015; Rabinovich et al., 2015; Cabernard & Doe., 2013; Graeden & Sive, 2009). Of these two models, Drosophila has been characterised more extensively, using genetic screens for genes that regulate brain development (Li et al., 2016; Neumüller et al., 2011; Perrimon et al., 2010; Patton & Zon, 2001). The Drosophila larval brain contains 104 neurons, can be cultured ex-vivo and imaged using standard fluorescence microscopy (Cabernard & Doe., 2013; Prithviraj et al., 2012). In the larval central brain (CB), neural stem cells, also known as neuroblasts (NBs), undergo asymmetric division to produce another stem cell and a ganglion mother cell (GMC). GMCs terminally divide to produce a pair of cells that differentiate to become neurons or glia (Homem & Knoblich, 2012). These divisions are highly regulated and defects in the process can result in under-proliferation or over-proliferation, which can lead to cancer-like phenotypes (reviewed in Homem et al., 2015; Laurenson et al., 2013; see also Narbonne-Reveau et al., 2016; Laurenson et al., 2013; Miles et al., 2011; Chia et al., 2008; Bello et al., 2006; Caussunus & Gonzalez, 2005).
Functional screens in Drosophila have significantly extended the number of components known to regulate NB proliferation and differentiation leading to defects in brain size or tumour formation (Berger et al., 2012; Homem & Knoblich, 2012; Neumüller et al., 2011). Such screens have the power of genome wide coverage, but, to be effective, often require time-consuming detailed manual characterisation of phenotypes that are frequently subtle and complex. One such mutant phenotype, is that of the conserved RNA binding protein Syncrip (Syp), previously described as exhibiting a very weak NB under-proliferation in a high-throughput screen of genes affecting brain development (Neumüller et al., 2011). SYNCRIP/hnRNPQ, the mammalian homologue of Syp, has interesting roles in mammalian hippocampal cells. Syp also determines neuronal fate in the Drosophila brain (Ren et al., 2017; Liu et al., 2015) and is required for neuromuscular junction development and function (McDermott et al., 2014; Halstead et al., 2014). Much of the work characterising the syp phenotype and the developmental defects of other neuronal mutants has relied on immuno-labelling of fixed material in which cell types must be identified manually from fixed “snapshots” of the developing brain, or from disaggregated cells in culture (Ren et al., 2017; Homem et al., 2014; 2013; Moraru et al., 2012; Berger et al., 2012; Wu & Luo, 2006; Savoian & Rieder, 2002; Furst & Mahowald, 1985). This reliance on fixed material and largely manual analysis constitutes a significant limitation to progress in the field.
MOTIVATION AND DESIGN
Here, we describe our development of an optimised live-imaging method for Drosophila larval brains and a generally applicable, novel machine learning image analysis tool for characterising complex tissue development at the cellular level.
In general, live-imaging allows a more definitive characterisation of subtle mutant phenotypes (Homem et al., 2014; 2013; Walker, 1954) than can be achieved in fixed material. However, the ability to track and quantitate the proliferation and differentiation of individual cells in intact living brains remains a major unsolved experimental challenge. To date, culturing and imaging of living explanted Drosophila larval brains has only been partially successful (Cabernard & Doe, 2013; Prithviraj et al., 2012). Moreover, progress in the field of brain development is further limited by the lack of image analysis methods for high-throughput automated identification of cells and their pattern of divisions and differentiation (Schmitz et al., 2014; Myers, 2012; Neumüller et al., 2011; Scott & Baier, 2009). Existing automated methods can identify cells in 3D images, but lack the flexibility, speed and ease of use to make them effective solutions for time-lapse movies as large and complex as a whole developing brain (Lou et al., 2014; Cabernard & Doe, 2013; Homem et al., 2013; Meijering, 2012; Meijering et al., 2012).
Our optimised culture and imaging methods support normal cell divisions in explanted living brains over extended periods of over 30 hours of continuous high-quality 4D image acquisition, significantly extending what has previously been achieved (Cabernard & Doe, 2013). To analyse the resulting vast image data sets, we developed QBrain, an innovative, freely available, robust and easy to use machine learning based image analysis software. Using these tools, we characterised the syp mutant, showing a brain overgrowth phenotype that, surprisingly, is not due to an increase in the rate of NB division suggested by conventional analysis in fixed material. Instead, we show that brain overgrowth in syp mutants is due to an extension in the time over which NBs continue dividing. Our exemplar use of QBrain to characterise the syp mutant phenotype in the intact living larval brain, illustrates the power of our approach to quantitate the proliferation of individual cells in a large and complex tissue. We anticipate that QBrain could be applied effectively to many kinds of other complex tissues, such as normal or mutant mammalian embryoids or organoids, as well as many other Drosophila mutants.
RESULTS
An optimised approach for extended time-lapse imaging of developing ex-vivo brains
Drosophila larval brains develop for more than 120 hours (Homem & Knoblich, 2012) but imaging of live brain development at the cellular level has so far only been possible by imaging explanted brains for relatively short periods of a few hours (Cabernard & Doe, 2013; Prithviraj et al., 2012) or by studying disaggregated brain cells in culture (Homem et al., 2013; Moraru et al., 2012; Savoian & Rieder, 2002; Furst & Mahowald, et al., 1985). To address this major technical gap, we modified the previous state-of-the-art methods of Cabernard & Doe (2013) to develop an easy, effective protocol for long-term culture and imaging of intact explanted larval brains for the analysis of stem-cell behaviour in whole-mounted living brains.
We first improved the isolation and culture of larval brains by combining gentle scissor-based dissection of second or third-instar larvae with an optimised culture medium and an improved brain mounting technique (Figure 1; Experimental Procedures). Second, we used bright, endogenously expressed protein traps Jupiter::GFP and Histone::RFP as markers of microtubules and chromosomes, respectively (Figure 1B). These provided sufficient information to identify cell types and follow their behaviour under live-imaging conditions with relatively low doses of excitation light. This allowed us to follow cell division in individual cells by imaging at subcellular resolution in 3D (Figure 1D). Generic cytological markers are more easily recognised across wild-type (WT) and different mutants than more specific markers, such as Deadpan (Dpn), Asense (Ase) or Prospero (Pros), commonly used to identify NBs, GMCs and progeny (Figure S2), but which are often disrupted in mutants. Finally, we optimised our imaging conditions using a standard commercial confocal microscope to reduce excitation light exposure while providing 3D data sets of sufficient temporal and spatial resolution to support analysis of cell proliferation over time (see Experimental Procedures).

A) Diagram of the chamber and sample preparation for long-term time-lapse imaging on an inverted microscope (see Experimental Procedures). B) 24 h, confocal 3D time-lapse imaging of a developing larval brain lobe (see insert diagrams) labelled with Jupiter::GFP and Histone::RFP. Images were aligned across time by reference features to take account of movements and shape changes. Arrowheads indicate NBs (magenta) and progeny (cyan); a dashed white line indicates the boundary to the medulla. The insert reference diagram, top left, and corresponding reference map in (C), show the orientation and region of the brain imaged. C) Plot of brain lobe diameter growth over 24 h (n = 3) under wide-field fluorescence imaging conditions in culture for a Jupiter::GFP; Histone::RFP L3 brain. The red crosses indicate average lobe diameter (n= 13) for freshly isolated brains from free living larvae at the wL3 and pre-pupal stages; inserts diagram the brain orientation and region of the brain imaged. C’) and C”), bright field images at two time-points during culture and examples of freshly dissected free living larvae at corresponding developmental stages, respectively. D) An individual dividing NB from a confocal time-lapse image sequence of the brain lobe. D’) Plot of cell cycle length over time in culture for cultured L3 brains showing that cell cycle length for NB does not lengthen significantly over at least 20h under imaging conditions. Scale bars B, C’ D” 50 μm; C 100 μm; D 10 μm.
To assess whether our culturing and imaging protocol supports normal development, we used a number of criteria. Overall, we found that by all the criteria we measured, brain development was normal in our ex vivo conditions. First, our brains generally did not show signs of damage during preparation, which can be easily seen as holes or lesions in the tissue that expand with time in culture. Second, our cultured larval brains consistently continue to develop and increase in size (Figure 1C-C”). Finally, we do not observe significant lengthening or arrest of the cell cycle in NBs for 22 h, which is approximately the length of the wandering third instar larval stage (wL3) (Figure 1D-D’). With longer duration culture and imaging, up to 48 h, we observe an increase in cell cycle length, which might be expected for wL3 brains transitioning to the pupal state. NB division rates were 60-90 min per cycle for wL3, as previously published (Homem et al., 2013; Bowman et al., 2008; Figure 1D-D’; Movie S1 and S2). We conclude that our culturing and imaging method of intact explanted larval brains allows long term 3D imaging of development for at least 22h with sufficient time resolution to effectively track the cell cycle.
Easy automated quantification of cell types in an intact living brain
Progress in elucidating the molecular mechanisms of regulated cell proliferation during larval brain development has largely depended on the characterisation and quantification of mutant phenotypes by painstaking manual image analysis (Neumüller et al., 2011). Our live cell 3D imaging in particular, results in datasets consisting of thousands of images. Analysing such large datasets manually is impractical, therefore, automating this process would be a significant advance (Rittscher, 2010). Although there are freely available image analysis tools, we find that none of those we tested for this kind of automated analysis perform adequately on our datasets, in terms of speed or accuracy (Table 1). To overcome this limitation, we developed QBrain, an easily deployed, machine learning based software. QBrain facilitates automated classification of cell types and quantitative analysis of cell number, distribution and proliferation from time-lapse movies of multichannel 3D image stacks of complex tissues (Figure 2; S1). In essence, the user “trains” QBrain by selecting a few examples of the cell type of interest and the program determines the pixel characteristics that identify that cell type, allowing subsequent characterisation of cell number, distribution and behaviour (see Supplemental Material for full description).
Performance for a series of freely available tools for identifying cells was tested and compared to QBrain on the same computer, including time taken to provide user annotations for a standard data set (150 or 35 time-points, 30-Z). Computer specifications: MacBook Pro11,5; Intel Core i7 2.88GHz;16GB RAM. For manual annotations, the time taken to annotate the full dataset was estimated from the time to annotate 10 time-points. Only freely available approaches capable of analysing data in 4D were tested. Values ± standard deviations are shown, n=3. Fiji, ImageJ V1.51d; FIJI, local threshold V1.16.4; FIJI-WEKA, WEKA3.2.1; Ilastik (V1.17).

A) Overviews of the wL3 brain highlighting the dorso-anterior-lateral region of the CB containing cells of the type I NB lineage; OL optic lobe; M medulla; VNC ventral nerve chord; DAL dorsal anterior lateral. A’) Confocal image of the CB region with the type I NB lineage identified in fixed material by DAPI, Ase-Gal4 driving UAS mCD8::GFP and anti-Pros immuno-labelling. A”) Enlarged region of (A) showing a single NB lineage; NB neuroblast; GMC ganglion mother cell. B) Workflow for automated identification of cell types by QBrain. Refer to the Main Text and Methods for details. Briefly, training is performed by single click annotation within a user defined region of interest (ROI) to identify the cell class of interest. The resultant “probability” map for cell class identification is evaluated manually to assess the success of training. A successful identification regime / “Model” is saved and may be used to batch process multiple image data sets. Multiple outputs are produced including a list of the co-ordinates of identified cells. Multiple identification regimes can be sequentially applied to identify multiple cell classes from a single data set.
Ease of training is critical to the effective use of machine learning algorithms (Sommer & Gerlich, 2013). To minimise the supervision required of the user during the training process, we developed QBrain to use a novel implementation of supervised machine learning (see Experimental Procedures), in which the user trains the program in 2D on a limited number of images (Figure 2B). In practice, the user simply selects, with a single mouse click, the approximate centre of all examples of a particular cell type within user-defined regions of interest in the image. This supervision approach is more convenient and faster than other machine learning based approaches, such as FIJI-WEKA (Arganda-Carreras et al., 2016) or Ilastik, (Sommer et al., 2011), that require extensive labelling of areas at the pixel level that include both cells and background (see Figure S1 for details of the user interface). During the learning of the model, QBrain chooses from a collection of filters and scores and combines them to find features in the image that identify the user-defined cell centres. In this way, a series of transformations of the image data (referred to as the “Trained Model”) are learned. This model is applied pixel by pixel to further data sets, and QBrain then outputs both an estimated probability map of cell identification and the predicted cell centre co-ordinates. To optimise training, users can apply the probability map output to assess the accuracy of the prediction and if necessary, provide additional training (Fig 2B). This probability map and the predicted locations of cell centres across the entire volume and time-series are saved and can be passed to ImageJ (FIJI) for further manipulation (Figure 2B; S2). Thus, the program requires a minimal amount of manual user input to achieve accurate automated cell identification that is highly scalable to large image data sets.
In order to evaluate the performance of QBrain, we compared its output to “ground truth” data, in this case image sets that were manually annotated by a user. We first established and validated the algorithm on 3D images of fixed whole mounted (wL3) larval brains immuno-labelled against Ase and Dpn and including DAPI, which allowed definitive identification of NBs and GMC’s (Neumüller et al., 2011; Bayraktar et al., 2010; Boone & Doe, 2008). Dpn marks NBs uniquely, whereas Ase is expressed in NBs and in GMCs (Figure S2). We assessed the performance of the algorithm by plotting Precision-Recall graphs (Figure 3A; Davis & Goadrich, 2006) where optimum performance maximises the number of cells correctly identified (recall) while also maximising the accuracy of identification (precision). We used this analysis to explore parameters, such as the threshold setting, that affect algorithm performance, allowing us to decide which parameters should be fixed and which need to be user-modified (Figure 3A and Experimental Procedures). In particular, this approach allowed us to assess the level of training required to achieve good detection of cell types of interest with different datasets (Figure 3B). In all cases tested, we found that successful identification of NBs or GMCs required minimal user training (of the order of tens of examples for only a few image planes) and increasing training gave only marginal improvement (Figure 3A; Figure S3). Taking our results so far, we conclude that our machine learning based approach performs accurate and efficient identification of cells from large multidimensional image sets of complex tissues.

A) Assessment of algorithm performance in identifying NB from confocal image data of a live brain labelled with Jupiter::GFP, Histone::RFP. The Precision-Recall (P/R) relationship (see main text) was plotted for different levels of training from annotation of one cell (NB), to annotations of 21 individual NB. The dark blue shaded area highlights the optimum performance of precision and recall; the X corresponds to the image data in (A’) and (A”). A’) Ground Truth manual identification of NB centres. A”) Corresponding identifications (green markers) and “misses” (cyan markers) for the point on the P/ R curve (A) corresponding to 70% precision and recall, marked with a red cross. Zoomed regions correspond to the white dashed regions in the main image. Scale bars 50 μm. B) Validation of parameters: B’) assessing level of training (Number of NB identifications) required for optimum detection accuracy at the default threshold of 0.05; B”) The value of sigma (∼object size in pixels) required for optimal detection accuracy at the default threshold value, 0.05. Near-optimal performance is achieved at a range of sigma values.
We next determined how well QBrain performed cellular identification in the more challenging case of generic cytological markers. To assess whether QBrain can effectively identify the NBs and their progeny from generic markers, we fixed Jupiter::GFP / Histone::RFP expressing brains and labelled them for Dpn and Pros to identify NBs and their progeny (Figure 4A). After training, based only on the Jupiter::GFP / Histone::RFP labels, QBrain successfully and accurately identified both NBs (96% ± 4 Dpn positive, n = 12, 3 repeats) and progeny (92% ± 2 Pros positive, n = 189, 3 repeats) (Figure 4B-B”). We conclude that QBrain can be used effectively to identify NBs and progeny from either specific cell type markers or from generic markers of cell components that are expressed in all cells in the brain.

A) A fixed Jupiter::GFP, Histone::RFP labelled brain (A’), immuno-labelled for Dpn and Pros (A”) to permit unequivocal identification of NB and their progeny. B) Validation of QBrain identification of NB and progeny from generic cytological makers. B’) Cell centre predictions are shown from QBrain analysis of the dataset from (A’) with generic markers. B”) Corresponding identifications of NB and progeny based upon Dpn and Pros markers. B”’) Plot showing that identification based upon Jupiter::GFP, Histone::RFP labelling alone effectively identifies NB and progeny compared to identification from Dpn and Pros labels: 96% ± 4 NB identification (n=12, 3 repeats) and 92% ± 2 progeny identification (n=189, 3 repeats). Scale bars 20 μm.
QBrain outperforms other automated analysis approaches
To assess and quantitate how QBrain analysis of complex multidimensional image data compares to other freely available programs (Table 1), we used our live-imaging time-series of the generic cytological markers Jupiter::GFP / Histone::RFP as standard test datasets. For our baseline performance tests of QBrain, we quantified the number of NBs identified in five time-points from a movie sequence. We then compared the output from QBrain to that of other algorithms applied to the same test dataset. In each case, we attempted to optimise the parameters used, based, whenever possible, on the published information. In our tests we found that QBrain significantly outperformed all the other freely available approaches in accuracy, speed and simplicity of use (Table 1). We conclude that QBrain represents a significant advance over the other current freely available state-of-the-art methods of analysis, especially in its ability to accurately and automatically analyse the large volumes of data that result from live imaging of an intact complex tissue such as a brain.
Analysis of syp mutants by QBrain highlights multiple subtle causes of brain over-growth
To test the power and versatility of using QBrain in the analysis of a complex and subtle brain mutant phenotype, we characterise the brain overgrowth phenotype of syp mutants. Syp has previously been identified in a screen for genes required for normal brain development (Neumüller et al., 2011), although the mutant was not characterised in detail. Therefore, we characterised the phenotype of mutant syp brains in greater detail using QBrain. We found that in early wL3, the brains of syp loss-of function mutants (eliminating Syp expression in the NB lineages, Figure S3) were significantly enlarged compared to WT larvae at the same stage of development. syp brain lobes exhibit a 23% increase in diameter (WT 206.5 μm ± 5.0, n = 10, syp 253.7 μm ± 11.0, n = 5), and a 35% increase in CB volume (Figure 5A-A”). We, first investigated whether our observed increase in volume was due to an increase in cell size. Using QBrain to locate cell centres within the CB region, we found that the average cell density is not significantly different between WT (104 cells/μm ± 12, n = 5) and syp mutants (92 cells/μm ± 4, n = 4), indicating no difference in average cell size (Figure 5B-B”). Given that cells were tightly packed in the CB and we did not observe substantial spacing (Figure 5B’), it follows that the increased area of the CB in syp mutants must contain more cells if cell density is not affected. We, therefore, conclude the larger CB region size must be explained by an increase in the number of cells.

A) syp mutants have significantly enlarged brains compared to WT, at wL3. A’-A”) Comparison of brain dimensions for WT and syp mutants highlighting enlargement of the brain lobes. B) Average cell size is not increased in the CB region of syp mutants: B’-B”) cells are similarly tightly packed in both WT and syp RNAi CB; B”’) there is no difference in cell density between WT and syp mutants indicating cell size is unchanged. C) Mitotic index determination for CB NB by PH3 labelling shows no significant increase in the rate of division of syp mutants compared to WT. C’) Histogram comparing mitotic index: WT 17 +/- 8 (n = 21); syp RNAi 22 +/- 6 (n = 15); syp Null 21 +/- 6 (n = 15). Images show a typical PH3 labelling, zoomed regions correspond to the white dashed areas in the main image; Dpn and DAPI permit NB identification. D) Central brain NB produce significantly more progeny in syp mutants than WT by EdU uptake. Images show a typical EdU uptake, all progeny produced within the 4h period are labelled, zoomed regions correspond to the white dashed areas in the main image; a single NB and progeny are highlighted with a white dashed line. D’) Histogram comparing numbers of progeny produced: WT 3.3 +/- 0.2 (n=7); syp Null 4.6+/- 0.1 (n=7). Magenta arrows: NB; cyan arrowheads: progeny. Scale bars 20 μm in B; 50 μm elsewhere.
Given this increase in the number of cells in the CB, we investigated possible causes. In brain tumour mutants, brain overgrowth is caused by additional ectopic NBs (Bello et al., 2006). We tested whether this is also the case for the syp mutant brains. We used QBrain to accurately determine the total number of NBs in the CB of fixed syp mutant verses WT wL3 brains. Our results show that wL3 syp Null brains have a small but statistically significant increase of 10-15% in the number of NBs of the dorsal anterior lateral region, but syp RNAi knockdown are not different from WT (Figure 6C; WT 45.6 ± 1.3, n = 22, RNAi 44.1 ± 2.1, n = 15, syp 51.7 ± 1.5, n = 15). This difference between syp RNAi and syp Null likely reflects a role of Syp in other tissues, or stages of development that impacts the regulation of NB number. We furthermore, did not observe any difference in the number of type II NB, normally 8 per brain lobe, located medially on the dorsal posterior (Fig S4; Ren et al., 2017; Bello et al., 2006; Boone & Doe, 2008; Bowman et al., 2008). We conclude that an increase in NB numbers in syp mutants does not quantitatively account for the brain enlargement observed and further differences in cell proliferation must be contributing.

A) Automated identification of dividing NB using QBrain. (A’-A”) Raw image data and cell centre predictions are shown for single time-points from live, 3D time-lapse, confocal image data sets (imaged at one Z- stack / 10 min); magenta arrowheads indicate dividing NBs. B) Analysis of individual NB behaviour in the intact brain. B’) Variation in cell cycle length for four individual NB in a single WT brain see Figure S5). B”) The average cell-cycle time does not differ significantly between the syp RNAi and WT, indicating that there is no difference in the mitotic index of NB; average cycle time is plotted for consecutive cell cycles and as a mean cycle time (n=8). C) syp Null mutants, but not syp RNAi, show a small but significant increase in NB number (WT 45.6 ± 1.3 n = 22,; RNAi 44.1 ± 2.1 n = 15; syp 51.7 ± 1.5 n = 15). NB were identified by Dpn labelling and the average count for a comparable volume of a single optic lobe CB region is plotted. D) syp mutants are delayed in development compared to WT at the same time after embryo hatching (syp Null 170.5 ± 5.5 n = 4; syp RNAi 178.7 ± 19.0 n = 4; WT 123.1 ± 2.2 n = 12). Scale bar 50 μm.
syp mutants exhibit a normal neuroblast division rate
In addition to increased NB number, an increase in the NB division rate during development would contribute significantly to brain overgrowth. To test this possibility, we examined the mitotic activity of NB in syp mutants by estimating NB division rate either through the uptake of 5-ethynyl-2 deoxyuridine (EdU) into progeny or by quantitating the number of cells in mitosis by the presence of Phospho-Histone H3 (PH3). Interestingly, these two independent methods gave conflicting results (Figure 5C, D). We found that the number of progeny produced in the 4 h EdU incubation period in syp Null larval brains is significantly increased compared to WT (Figure 5D). Surprisingly, PH3 staining show no significant difference in the NB mitotic index between syp Null, syp RNAi, and WT (Figure 5C-C’). As previously noted (Walker, 1954), mitotic index determination from fixed material relies on assumptions about the cell cycle, so even small changes can make the results hard to interpret.
In order to resolve these conflicting results, we determined the rate of NB division in cultured living brains using our optimised methods. Using QBrain and time-lapse imaging provides unequivocal characterisation of cell division in a brain, as it directly quantitates each NB’s division rate individually (Figure 6B). We first validated that QBrain can automate the identification of individual dividing NB in WT from live image series (Figures 6A; S5). We then compared with syp mutants and found that the rate of division of NBs in syp mutant brains was not significantly different from WT (Figure 6B”). Interestingly, we also find that, while each NB has a consistent cycle period, there is considerable variation in cell cycle length between NB, however, there is no obvious spatial correlation of cell division rate (Figure S5) We conclude that mitotic activity of NB is unchanged in the absence of Syp expression and so does not contribute to the increased brain size at wL3. Nevertheless, these results illustrate the power of QBrain to analyse the pattern of cell divisions in much more detail and greater accuracy than conventional methods in fixed material.
syp mutant larvae develop more slowly causing brain overgrowth
So far, we have shown that an increase in NB numbers or their rate of proliferation does not explain the enlarged brains observed in syp mutant larvae. Another possible contributor to the enlarged brain phenotype could be that NBs divide for longer and produce more progeny. To test this possibility, we measured the time between embryo hatching and pupation in syp mutants compared with WT (Figure 6D). We found a significant developmental delay of approximately 50h for syp mutants to reach pupation (syp Null 170.5 ± 5.5, n = 4; syp RNAi 178.7 ± 19.0, n = 4) compared to WT (123.1 ± 2.2, n = 12). We conclude that a combined increase in NB numbers and developmental delay, prolonging the time over which NB generate progeny, accounts for the observed brain enlargement phenotype observed in wL3 syp mutant larvae.
Taken together our work demonstrates that QBrain is a powerful new analysis tool that transforms what is possible in the characterisation of mutant phenotypes at the level of individual cell behaviour in complex tissue in 3D. QBrain provides a simple, fast and effective approach for the analysis of subtle mutant phenotypes compared to existing automated methods or manual approaches. Our exemplar characterisation of syp mutant phenotypes illustrates the potential of QBrain to transform the analysis of developmental mutants, making it practical to work with very large 3D data sets of fixed material and 3D live-cell time-lapse imaging of complex intact tissues.
DISCUSSION
One of the great challenges in biology and biomedicine is to understand the development of the whole human brain at the single cell level, which is of major clinical significance (Dagley et al., 2017, Deistung et al., 2013). Whilst great strides have been made using isolated mammalian cells in culture and whole brain imaging using MRI approaches (Zorio et al., 2017; Ortega & Costa, 2016; Goense et al., 2016; Radecki et al., 2014; Deistung et al., 2013, Judenhofer et al., 2008), understanding developmental processes at the single cell level in the context of the whole brain is currently intractable in humans. Live-cell brain imaging in vivo is possible in rat and mouse model systems through cranial windows, for example, using multi-photon microscopes and Brainbow technology (Mahou et al., 2012), however, the rodent brain is still too complex to follow overall development at the single cell level (Ortega & Costa., 2016; Weigert et al., 2013; Hoffman, 2008). Whole zebrafish (Danio rario) brains can be followed in vivo at the cellular level using light sheet microscopy (Araya et al., 2016; Dray et al., 2015; Babin et al., 2014; Schmidt, et al., 2013; Keller et al., 2008), but the image resolution is insufficient to follow the intracellular molecular behaviour in detail. In contrast, Drosophila brains are tractable at the single cell level (Homem et al., 2015), and are sufficiently small to image the intracellular distribution of molecules at high resolution (Lemon et al., 2015; Cabernard & Doe, 2013; Homem et al., 2013; Prithviraj et al., 2012) this makes them an appealing model system.
A generally applicable, automated analysis tool to assess tissue development
In Drosophila and vertebrates alike, progress in understanding brain development has been limited by the lack of effective ways to culture and image whole brains for extended periods, while monitoring cell behaviour with intracellular molecular discrimination. Here, we describe how we address this by making it possible to culture and image the intact living explanted Drosophila larval brain for extended periods at high resolution. In parallel, we developed QBrain, convenient and rapid software that uses a machine learning image analysis algorithm to identify neural stem cells and other cell types and quantitate their numbers, size and rate of division on an individual cell level from extensive complex datasets. The use of QBrain in this study illustrates how our approach could be used on any complex 4D data set, including time-lapse movies of vertebrate tissues, being limited only by the culturing and imaging techniques.
The key developments of our live imaging approach are firstly, the optimised dissection and mounting protocol, combined with simplified culture medium to extend the period of viability and mechanical stability of the specimens. Secondly, our use of very bright generic markers of cellular morphology, which offers major advantages over more specific markers of cell identity. Generic cytological markers tend to be brighter, allowing the use of low laser power to maximise viability. Markers of cell morphology can also be used in almost all mutant backgrounds, unlike specific markers of cell identity, whose expression is often altered in specific mutant backgrounds. Therefore, as we show, images of generic markers can be analysed regardless of the genetic background or conditions used to image the development of the tissue, offering a general approach for most model organisms.
Our long term time-lapse experiments resulted in a huge volume of data, making manual image analysis impractical and certainly not scalable to include multiple conditions or genetic backgrounds, as discussed in Bria et al. (2016). The development of QBrain offers a generally applicable, automated analysis tool that can be applied to almost any equivalent kind of data sets in any organism. While a variety of powerful image analysis tools already exist and are in common use for handling 3D and 4D datasets (Luengo et al., 2017; Arganda-Carreras et al., 2016; Logan et al., 2016; Gertych, et al., 2015; Lou et al., 2014; Sommer et al., 2011), QBrain offers a simple solution for fast and accurate analysis of subtle phenotypic changes without the need for bespoke programming, script writing or optimisation of many parameters. Furthermore, while machine learning approaches are increasing in popularity (Chittajallu et al., 2015; Sommer & Gerlich, 2013), those currently freely available tend to be limited to the analysis of 2D data. Moreover, existing conventional tools that handle 3D datasets are often inflexible, expensive, hard to use or slow. We have demonstrated conclusively using detailed quantitative performance analysis in 4D that QBrain out-performs, by a significant margin, all the other freely available approaches that we tested. Our machine learning based approach, therefore, represents a step change in the scale of data sets that can be effectively analysed to obtain quantitative information on any user defined cell type, including changes in cell behaviour such as mitosis, cell number and size. Crucially, QBrain analysis of extensive live imaging data allows such parameters to be determined for individual cells in a complex tissue, rather than conventional methods that provide snapshots or an ensemble view of average cell behaviour.
Limitations
The approach we have developed depends critically on the use of “supervision” or training regimes, which by their very nature are subjective and user dependent. Supervised machine learning methods (Luengo et al., 2017; Arganda-Carreras et al., 2016; Logan et al., 2016; Chittajallu et al., 2015; Sommer et al., 2011) require the user to provide training examples by manually identifying a variety of cells or objects of interest, often requiring laborious “outlining” of features. However, our use of a “point and click” interface (Figure S1), which simplifies manual annotation, and probability maps, helps to overcome this drawback of many supervised machine learning approaches by making it quick and easy for a user to train and retrain. Probability maps provide the flexibility for tailoring experimental design to produce robust and reproducible results with a minimal effort. Using our novel approach, a user can quickly move from initial observations to statistically significant results based upon bulk analysis of data. Currently, a technical limitation of the “point and click” strategy is that the program “assumes” a roughly spherical cell shape. This means that cellular projections, for example neural extensions, would not be identified. However, the output data from QBrain can be opened in other programs, such as FIJI (ImageJ), allowing a user to benefit from the many powerful plug in extensions available to facilitate further extraction of information for defined cell populations from bulk datasets. The combination of all these features make QBrain widely applicable to many kinds of complex datasets, fixed or live, where there is a need to identify, quantitate and analyse cell types and behaviours.
Quantitative analysis of developing brains at the cellular level elucidates subtle developmental defects
In our exemplar analysis of syp mutant brain overgrowth, we show how the powerful combination of our live imaging and detailed quantitative analysis by QBrain can be brought to bear to elucidate even a subtle complex mutant phenotype where conventional approaches struggle to produce a definitive result. In the case of the syp mutant phenotype, previous analysis identified an issue in cell proliferation (Neumüller et al., 2011), however, using QBrain we reveal that the phenotype is more subtle and complicated than previously thought. Indeed, it has been shown that Syp has a large number of target genes so phenotypes might be expected to be complex (McDermott et al., 2014). By facilitating detailed analysis, increasing quantitative rigour and throughput to deal with appropriate numbers for statistical validity to tease out subtle affects, our approaches have significant implications for subsequent investigations of detailed molecular analysis to determine underlying molecular mechanisms. The use of bright generic cellular markers in conjunction with QBrain offers the potential to develop high throughput screening and data analysis for rapid and accurate identification of cell types in any complex tissue, for example applied to image data sets following cell fates in zebrafish labelled using the “spectrum of fates” approach (Araya et al., 2016; Chow et al., 2015; Almeida et al., 2014). Potential future applications could include high throughput analysis of the effect of growth conditions on organoid development (Walsh et al., 2014) and drug discovery experiments using phenotypic characterisation of embryos or larvae rather than single cells (Willoughby et al., 2013; Rand et al., 2010).
AUTHOR CONTRIBUTIONS
MH, DW and LY contributed equally to this work. MH, LY, TJS, TD, YA and RMP designed and performed experiments and MH, LY, TJS, TD and RMP analysed and interpreted data. DW originated the computational approaches used and developed in collaboration with MH the software for 3D analysis in QBrain. MH extensively validated and tuned the software to the application of interest. LY initiated the project intellectually and the biological application. DW initiated the computational approaches used. All authors discussed the results and conclusions, commented on and contributed to the revision of the manuscript. RMP and ID supervised the project, the biological application and user interface as well as jointly writing and revising the manuscript.
EXPERIMENTAL PROCEDURES
EXPERIMENTAL MODEL AND SUBJECT DETAILS
Fly strains
Stocks were raised on standard cornmeal-agar medium at either 21 °C or 25 °C. To assist in determining larval age, Bromophenol Blue was added at 0.05% final concentration in cornmeal-agar medium. The following Drosophila fly strains were used: [Wild-Type Oregon-R]; [Jupiter::GFP;Histone::RFP (recombination on the third)]; [AseGal4>UAS-MCD8-GFP]; [w11180;PBac(PB)sype00286/TM6B]; [Bloomington 9289, w11180 (homozygote syp Null)]; [Df(3R)BSC124/TM6B (crossed to BL 9289 for syp Null)]; [syp RNAi lines - w11180; P{GD9477} v33011, v33012].
METHOD DETAILS
Fixed Tissue Preparation and labelling
Flies of both genders were raised as described above and larvae from second instar to pre-pupal stages collected and dissected directly into fresh 4 % EM grade paraformaldehyde solution (from a 16 % stock. Polysciences) in PBS with 0.3 % TritonX-100 then incubated for 25 min at room temperature (RT). Following fixation, samples were washed 3 times for 15 min each in 0.3 % PBST (1x PBS containing 0.3 % Tween) and blocked for 1 h at RT in Immunofluorescence blocking buffer (1 % BSA prepared in 0.3% PBST). Samples were incubated with primary antibody prepared in blocking buffer for either 3 h at RT or overnight at 4°C. Subsequently, samples were washed 3 times for 20 min each with 0.3 % PBST followed by incubation with fluorescent labelled secondary antibodies prepared in blocking buffer for 1 h at RT. For nuclear staining, DAPI was included in the second last wash. Samples were mounted in VECTASHIELD (Vector Laboratories) for examination.
Culture of live explanted larval brains on the microscope
Brains were dissected from 3rd instar larvae in Schneider’s medium according to https://www.youtube.com/watch?v=9WlIoxxFuy0 and placed inside the wells of a pre-prepared culturing chamber (Figure 1A). To assemble the culturing chamber, 1 % low melting point (LMP) agarose (ThermoFischer) was prepared as 1:1 v/v ratio of 1 x PBS and Schneider’s medium (ThermoFisher 21720024) then pipetted onto a 3 cm Petri dish (MatTek) dish and allowed to solidify. After solidification, circular wells were cut out using a glass capillary ∼ 2 mm diameter. To secure the material in place, a 0.5 % LMP solution [1 % LMP solution brain diluted 1:1 with culturing medium (BCM)] was pipetted into the wells to form a cap. Finally, the whole chamber was flooded with BCM. BCM was prepared by homogenising ten 3rd instar larvae in 200 μl of Schneider’s medium and briefly centrifuge to separate from the larval carcasses. This lysate was added to 10 ml of 80 % Schneider’s medium, 20 % Fetal Bovine Serum (GibcoTM ThermoFisher), 10 μl of 10 mg/ml insulin (Sigma). A lid is used to reduce evaporation.
Imaging
Confocal, live imaging was performed using either an inverted Olympus FV1200 six laser line spectral confocal with environmental chamber, fitted with high sensitivity gallium arsenide phosphide (GaAsP detectors), x60 1.4 NA, or x60 SI 1.3 NA lenses. The confocal pinhole was set to one airy unit to optimise optical sectioning with emission collection. Laser power was kept less than ∼4 μW for both 488 nm and 559 nm excitation. Images were collected at 1024x124 pixels (pixel size 0.207 μm) with a scan dwell time of 2.0 μs/pixel (frame rate 6.5 s/frame, averaged x2). The total exposure time per Z stack (35) frames was 3 min, 48 s. Alternatively a GE Deltavision Core widefield system was used with a Lumencor 7-line illumination source. For live culture and imaging the culturing chamber containing the sample was closed with a lid was kept at 20 °C inside the microscope environmental chamber. For imaging of fixed material, either an Olympus FV1200 or FV1000 confocal was used with x20 0.75 dry or x60 1.4 NA. lenses. Settings were adjusted according to the labelling and were kept consistent within experiments.
Image Analysis
All programs used for image analysis were installed on a MacBook Pro11,5; Intel Core i7 2.88GHz; 16GB RAM. Basic image handling and processing was carried out in FIJI (ImageJ V1.51d; http://fiji.sc). The QBrain software was written in Python and can be installed as a stand-alone program. A full install is available (www.GitHub.com/dwaithe).
Western blot
Five wL3 brains of each genotype were dissected in Schneider medium and homogenised in 20 ul of lysis buffer (50 mM Tris-HCl pH 8.0, 150 mM NaCl, 0.5 % NP-40, 10 % glycerol, 1 mini tablet of Complete EDTA-free protease inhibitor). Proteins were separated by SDS-PAGE on a NuPage 4-12 % Novex Bis-Tris gradient gel (invitrogen) then transferred to nitrocellulose membrane with the Trans-Blot Turbo Transfer System (BioRad) following the manufacturer’s protocol. Membranes were blocked in 50 % Blocking Buffer (Odyssey) in 0.3 % PBST for 1 h at room temperature. The membrane was incubated with α-Syp antibody [guinea pig, 1:2000, (McDermott et al. 2014)], and α-Tubulin antibody (mouse, 1:500, Sigma) overnight at 4°C. After rinsing, the membrane was incubated with secondary antibodies for LICOR (1:2000) for 2 h at room temperature. Membranes were washed and the protein bands were visualised with the quantitative infrared imaging system (LI-COR Odyssey, LI-COR Biosciences; Lincoln, NE).
QUANTIFICATION AND STATISTICAL ANALYSIS
Mutant comparisons were performed using Student’s T test, following Shapiro-Wilk test to test normal distribution of the data. A p-value of <0.05 was considered significant. Numbers of replicates are detailed in the figure legends and main text. Unless otherwise stated, error bars shown are standard error (SEM).
DATA AND SOFTWARE AVAILABILITY
The following freely available image analysis tools were used: Fiji, ImageJ V1.51d (http://fiji.sc); Ilastik (V1.17) (http://ilastik.org; Logan et al., 2016; Sommer et al., 2011). The QBrain software was written in Python and can be installed as a stand-alone program. A full install is available (www.GitHub.com/dwaithe).
KEY RESOURCES TABLE
SUPPLEMENTAL MOVIES
Supplemental Movie 1: (See Figure 1B) Development of a live explanted larval brain under extended time-lapse imaging conditions. Time-series (13h) of one of the brain lobes, collected at 6 minute intervals and displayed at 3 fps. Red: Histone::RFP; Green: Jupiter::GFP. Asymmetric division of a NB regenerates a daughter NB and produces a smaller GMC. Scale bar 10 um.
Supplemental Movie 2: (See Figures 6; S5) Cell division followed by QBrain. Time-series (13h), collected at 6 minute intervals and displayed at 3 fps. Red: Histone::RFP; Green: Jupiter::GFP; heatmap (right hand panel overlay): probability of NB division (average of 5 frames, background subtracted for ease of viewing). Red indicates high probability of a NB division. Scale bar 10 um.
ACKNOWLEDGEMENTS
We are grateful to: Ivo A. Telley (Instituto Gulbenkian de Ciência) for fly stocks; David Ish-Horowicz and Alfredo Castello for discussions and critical reading of the manuscript. Thanks to MICRON (http://micronoxford.com, supported by a Wellcome Strategic Awards 091911/B/10/Z and 107457/ Z/15/Z) for access to equipment and assistance with imaging techniques. This work was supported by: a Clarendon Fellowship (Oxford University Press) to L.Y.; MRC/BBSRC/EPSRC (grant number MR/K01577X/1) and the Wolfson Foundation, Medical Research Council (MRC) Grants MC_UU_12010/Unit Programs G0902418 & MC_UU_12025 supporting D.W.; Wellcome Trust Senior Research Fellowship (081858) to I.D. and supporting R.M.P; Wellcome Trust Four-Year PhD Studentship (105363/Z/14/Z) to T.J.S. and by funding from the Engineering and Physical Sciences Research Council (EPSRC) and Medical Research Council (MRC) [grant number EP/ L016052/1] supporting M.H.
REFERENCES


