

ABSTRACT
Epithelial organs undergo steady-state turnover throughout adult life, with old cells being continually replaced by the progeny of stem cell divisions1. To avoid hyperplasia or atrophy, organ turnover demands strict equilibration of cell production and loss2-4. However, the mechanistic basis of this equilibrium is unknown. Using the adult Drosophila intestine5, we find that robustly precise turnover arises through a coupling mechanism in which enterocyte apoptosis breaks feedback inhibition of stem cell divisions. Healthy enterocytes inhibit stem cell division through E-cadherin, which prevents secretion of mitogenic EGFs by repressing transcription of the EGF maturation factor rhomboid. Individual apoptotic enterocytes promote divisions by loss of E-cadherin, which releases cadherin-associated β-catenin/Armadillo and p120-catenin to induce rhomboid. Induction of rhomboid in the dying enterocyte triggers EGFR activation in stem cells within a discrete radius. When we block apoptosis, E-cadherin-controlled feedback suppresses divisions, and the organ retains the same number of cells. When we disrupt feedback, apoptosis and divisions are uncoupled, and the organ develops either hyperplasia or atrophy. Altogether, our work demonstrates that robust cellular balance hinges on the obligate coupling of divisions to apoptosis, which limits the proliferative potential of a stem cell to the precise time and place that a replacement cell is needed. In this manner, localized cell-cell communication gives rise to tissue-level homeostatic equilibrium and constant organ size.
MAIN TEXT
Over an animal’s lifetime, mature organs undergo repeated rounds of cell turnover yet are able to remain the same approximate size. This remarkable ability implies the existence of robust mechanisms to ensure that turnover is zero-sum, with precisely equal rates of cell production and loss 1,2,10-12. In most organs, the production of new cells ultimately depends on the divisions of resident stem cells. Although much is understood about how excessive or insufficient divisions lead to disease, little is known about how equal rates of division and loss are sustained during the steady-state turnover of healthy tissues.
We investigated the regulation of turnover using the epithelium of the adult Drosophila midgut 8,9. To establish whether production of new cells equals loss of old cells, we examined the kinetics of cell addition and loss using escargot flp-out (esgF/O) >GFP labeling (Fig. 1a-e, Extended Data Fig. 1) 13. Upon 29°C temperature shift, all undifferentiated midgut cells are labeled by permanent, heritable GFP expression. Mature cells that were present before induction remain unlabeled, while mature cells that arise after induction inherit GFP expression from their progenitors. Focusing on the midgut’s R4ab region (also known as P1-2; Extended Data Fig 1b-e)14,15, we found that total (DAPI+) cells remained near-constant over time, while the number of newly added, GFP+ cells increased linearly (Fig 1e, Extended Data Fig 1g). At 4 days post-induction, virtually all cells in the R4ab region were GFP+, signifying that complete cell replacement had occurred. We conclude that production of new cells quantitatively equals loss of old cells.

a-e, The midgut R4ab compartment undergoes complete cell turnover in 4 days. a, Cartoon of esgF/O>GFP labeling strategy to quantify kinetics of turnover. Before induction, all progenitor cells (stem and enteroblast cells, small circles) and mature enterocytes (hexagons) are unmarked (tan). Upon induction by 29°C temperature shift, all progenitor cells express GFP (green). Postinduction, newly generated enterocytes inherit GFP expression from progenitors, while preexisting enterocytes stay unmarked. Cell turnover is complete when all cells are GFP+. See also Extended Data Fig 1. b-d, Representative images of esgF/O>GFP midguts before induction, 1 day post-induction, and 4 days post-induction. DAPI (blue) marks all nuclei. Armadillo (Arm, red) marks cell boundaries. e, Quantification of total (DAPI+) and new (GFP+) cells in the R4ab compartment over time 14,15. Number of total cells stays near-constant. Number of GFP+ cells increases linearly. After 4 days, number of GFP+ cells becomes equal to total cells. Each time point represents 3 midguts. f-g, Tracing stem cell divisions in a background of genetically manipulated enterocytes. f, Clonal labeling of stem cell divisions is induced by a brief pulse of FRT recombination that reconstitutes a split a-tub-nlslacZ transgene. Enterocyte-specific gene expression is turned on by 29°C shift that permits mexGAL4 to drive expression of UAS-gene X (mexts>gene X). See also Extended Data Fig. 2. g, Validation of genetic system using mexts>his2av::RFP. β-galactosidase marks a stem cell clone (outlined) in a background of His2av::RFP+ enterocytes. Within the 5-cell clone, only the enterocyte (yellow asterisk, polyploid) expresses his2av::RFP. h-k, Blocking enterocyte apoptosis causes fewer stem cell divisions but does not change total cell number. h, Clone size analysis in the R4ab compartment. Each point is the number of cells in one β-gal-marked clone. Data pooled from 4-5 midguts per genotype. Values are means ± S.D. Mann-Whitney test, p=0.009. i-j, Images show average-sized clones. k, Total R4ab cell counts are comparable for control, mexts>p35 and mexts>diap1 midguts. Cells were counted 4 days post-induction. N=4 midguts per genotype. Values are means ± S.D. Unpaired t-test, p>0.05. One of three representative experiments is shown in each graph. All scale bars are 25 μm.
Most cells in the midgut epithelium are polyploid enterocytes 16. Each enterocyte is the product of one asymmetric stem cell division; the enterocyte lineage contains no transitamplifying cells (Extended Data Fig. 1a) 9. To probe the relationship between cell production and loss, we devised a system to manipulate enterocytes and perform concomitant lineage tracing of stem cells by combining enterocyte-specific mexGAL4;GAL80ts (mexts) 17,18 with the clonal labeling system split-nlsLacZ 6,9,19-21 (Fig 1f; Extended Data Fig. 2). This two-pronged system was tested by de-repressing mexts>his2av::RFP with 29°C temperature shift and then inducing mitotic recombination and β-galactosidase expression in stem cells via a brief 38.5°C heat shock. As expected, His::RFP marked all enterocytes (polyploid cells), both within and outside of β- galactosidase-marked stem cell clones, but did not mark non-enterocyte, diploid cells (Fig 1g).
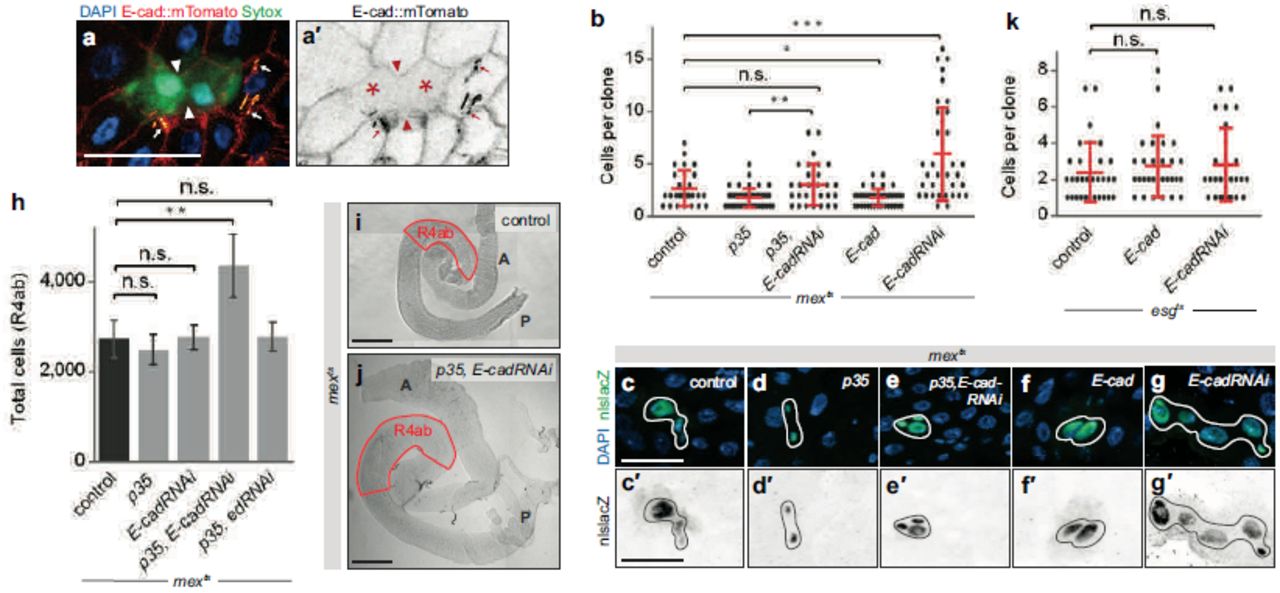
a, Dying enterocytes lose junctional E-cad. Endogenous E-cad tagged with mTomato (red hot LUT) localizes to the lateral membranes of healthy enterocytes but not dying, Sytox+ enterocytes (green; asterisks in a’). E-cad loss is most pronounced where two dying enterocytes are juxtaposed (arrowheads). In these live images, trachea exhibit bright, yellow-orange autofluorescence (arrows). Representative images are shown from two independent experiments; N=4 midguts per experiment, analyzed 6 days post-eclosion. Scale bar, 25 μm. b-g, Enterocyte E-cad is necessary and sufficient to repress stem cell divisions. b, Clone size analysis in the R4ab compartment using schema/timing in Fig. 1f. Stem cell clones are larger in mexts>p35, E-cadRNAi midguts compared to mexts>p35 alone (Mann-Whitney test, p=0.0034). Clones are also larger in mexts>E-cadRNAi midguts compared to control (p=0.0004). Clones are smaller in mexts>E-cad compared to control (p=0.04). c-g, Images show average-sized clones. Scale bars, 25 μm. h, Enterocyte E-cad is necessary to maintain constant cell number during apoptotic inhibition. Total cell number is normal in mexts>p35 and mexts>E-cadRNAi midguts but increases by ~70% in mexts>p35, E-cadRNAi midguts (unpaired t-test, p=0.007) after 4 days. This increase is unlikely caused by non-specific loss of cell-cell adhesion because total cell number remains normal in mexts>p35, echinoid(ed)RNAi midguts. N=4 midguts per genotype; means ± S.D shown. i-j, Enterocyte E-cad is necessary to maintain constant organ size during apoptotic inhibition. Organ size is larger in mexts>p35, EcadRNAi midguts compared to controls. A, anterior; P posterior. Scale bars, 200 μm. See also Extended Data Fig. 3a. k, Stem cell/enteroblast E-cad does not control stem cell divisions. Clone size analysis in R4ab as in Fig. 1f, except that esgGAL4 was used to manipulate E-cad in stem and enteroblast cells. Stem cell clones are comparably sized in esgts control midguts, esgts >E-cad midguts, and esgts >E-cadRNAi midguts (Mann-Whitney test, p>0.05). In b and k, data are pooled from 4-5 midguts per genotype. Values are means ± S.D. Each graph comprises data from three representative experiments.
Using this two-pronged system, we blocked enterocyte apoptosis and assessed the impact on stem cell divisions. Expression of the potent apoptotic inhibitor p35 in enterocytes (mexts>p35) resulted in fewer stem cell divisions, as indicated by smaller clone sizes (Fig 1h-j). Slowing down stem cell divisions could be a compensatory strategy to preserve overall cell number. Indeed, total cell numbers remained constant when apoptosis was blocked by p35 or by the native caspase inhibitor Diap1 (Fig 1k) after four days. The physical dimensions of apoptosis-inhibited midguts were similar to control guts (Extended Data Fig 3a), and epithelial tissue architecture remained intact (Extended Data Fig 4a-b, d-e). These results are supported by a prior report that fewer midgut cells incorporate BrdU in animals with impaired caspase activation 22. Altogether, these findings imply that enterocyte apoptosis regulates the rate of stem cell divisions to homeostatically maintain constant cell number and organ size.

a-f, Enterocyte E-cad inhibits stem cell EGFR signaling. a-c, Immunostaining for diphosphorylated ERK (dpERK). dpERK+ cells are sparse in control midguts, absent in mexts>E-cad midguts, and abundant in mexts>E-cadRNAi midguts. d-e, dpERK signal is eliminated following EGFR inhibition by oral administration of AG1478 or by temperature-induced inactivation of an egfrtsla/egfrf24 heteroallele. f, dpERK staining is limited to stem cells (HRP+, Su(H)lacZ-; arrowheads in f’ and f’’) and does not mark enteroblasts (HRP+, Su(H)lacZ+; asterisks in f’ and f’’), even in mexts>E-cadRNAi midguts. Representative images are shown from two independent experiments; N=4 midguts per genotype in each experiment, analyzed after 2 days of transgene expression. See also Extended Data Fig. 3b. g, EGFR activation is necessary for E-cad-depleted enterocytes to accelerate stem cell divisions. Clone size analysis in R4ab using schema in Fig 1f. Stem cell clones in mexts>p35, E-cadRNAi midguts are smaller when EGFR is inhibited by AG1478. Data pooled from 4-5 midguts per genotype. Mann-Whitney test, p=0.008. Values are means ± S.D. h, Organ hyperplasia requires EGFR and the EGF ligands spitz (spi) and keren (krn). AG1478 treatment restores total cell numbers of mexts>p35, E-cadRNAi midguts to the range of control and mexts>p35 midguts (unpaired t-test: p<0.0001). RNAi of either spi or krn in enterocytes reduces total cell numbers, and double RNAi of spi and krn restores total cell numbers to the normal range (p=0.0026, 0.046, and 0.0002 respectively). N=4 midguts per genotype, analyzed 4 days post-induction. Values are means ± S.D. See also Extended Data Fig. 3a. i-l, EGFR activation involves a dispersed signal. Single enterocytes that co-express E-cadRNAi and GFP were generated using MARCM (see Methods). i, If EGFR activation involves direct E-cadEGFR binding, then dpERK+ cells (red) will typically contact an E-cadRNAi enterocyte (green). If activation involves a dispersed signal, then dpERK+ cells will be close to, but not necessarily contact, an E-cadRNAi enterocyte. j-k, dpERK+ cells are enriched in the vicinity of a GFP+, E-cadRNAi enterocyte, but often do not contact. dpERK+ cells are rare in the vicinity of GFP+ control enterocytes. l, Spatial zone of EGFR activation. Each point is the measured distance between one dpERK+ cell and edge of the nearest E-cadRNAi enterocyte. dpERK+ cells frequentlylocalize 0-25 μm (~1-2 enterocyte diameters) away and can localize up to 50 µm away. N=4 midguts, analyzed 5 days after clone induction. One of three representative experiments is shown in each graph. Representative images are shown in all panels. All scale bars are 25 μm.

a, Enterocyte E-cad specifically inhibits expression of the obligate EGF protease rhomboid (rho). Levels of the indicated mRNAs were measured by qPCR of mexts control (red line), mexts>E-cadRNAi (black bars), or mexts>E-cad midguts (gray bars) after 4 days of induction. Relative to control, rho mRNAs increase by 15.5-fold upon E-cad depletion and decrease by 0.4-fold upon E-cad overexpression. mRNAs are not significantly altered for other components of EGF signaling: egfr; the EGF ligands vein (vn), spitz (spi), and keren (krn); or the post-translational EGF regulators argos (aos) and star. Values are means ± S.D. from 3 independent experiments. b-c, E-cad-depleted enterocytes require rho to hyperactivate stem cell EGFR. dpERK+ cells are abundant in mexts>E-cadRNAi midguts but are substantially reduced in mexts>E-cadRNAi, rhoRNAi midguts. Representative images are shown from two independent experiments; N=4 midguts per genotype in each experiment, analyzed after 2 days of transgene expression. See also Extended Data Fig. 3b. d-f, Expression of rho is activated in enterocytes during physiological apoptosis. Under steady-state conditions, the rho-lacZ reporter (green) is typically expressed in apoptotic enterocytes (red, cleaved caspase-3 staining) and rarely in non-apoptotic enterocytes. Planar (d) and vertical (e) views of two different fields are shown. In e, dotted line marks the basal epithelium. f, Quantification. Nearly all enterocytes that express rholacZ (90%) are also apoptotic. Values are means ± S.D from 3 independent experiments. N=3-4 midguts per experiment, analyzed 6 days post-eclosion; n=188 enterocytes total. g-j, Apoptosis-blocked enterocytes inhibit stem cell ERK activation via E-cad and rho. Compared to their nor-Mmal frequency, dpERK+ cells are strongly reduced when enterocyte apoptosis is blocked (mexts>p35), are restored when E-cad is additionally depleted (mexts>p35, E-cadRNAi), and are strongly reduced again when both E-cad and rho are depleted (mexts>p35, E-cadRNAi, rhoRNAi). Representative images are shown from two independent experiments; N=4 midguts per genotype in each experiment, analyzed after 2 days of transgene expression. See also Extended Data Fig. 3b. k, Activation of rho by p120-catenin and Armadillo drives organ hyperplasia. In apoptosis-inhibited midguts, loss of E-cad (mexts>p35, E-cadRNAi) causes total cell number to increase by 128% compared to control, producing organ hyperplasia. Additional loss of rho (mexts>p35, E-cadRNAi, rhoRNAi) restores normal cell number and prevents hyperplasia. On the other hand, overexpression of rho alone (mexts>p35, rho) causes a 100% increase in total cells (p=0.0017), resulting in hyperplasia without loss of E-cad. Thus, rho is necessary and sufficient for hyper-plasia. Activation of rho is mediated by the E-cad-associated transcription factors p120-catenin (p120) and Armadillo (Arm) (Extended Data Fig. 7). Loss of either p120 or arm, or both p120 and arm (mexts>p35, E-cadRNAi, p120RNAi and/or armRNAi), restores normal cell number and prevents hyperplasia. Overexpression of p120, but not constitutively active arm (armS10), causes hyperplasia (69% increase in total cells; p=0.0011); overexpression of both p120 and armS10 (mexts>p35, p120, armS10) slightly exacerbates hyperplasia compared to p120 alone (96% in-crease in total cells; p=0.0021). Thus, p120 and arm are necessary and sufficient for hyperplasia. Values are means ± S.D from one of three representative experiments. p values (unpaired t-test) relative to control. N=4 midguts per genotype, analyzed after 4 days of transgene expression. See also Extended Data Fig. 3a. l, Model for homeostatic coupling of enterocyte apoptosis and stem cell division. In the absence of apoptosis (left), stem cells are quiescent because enterocyte E-cad represses p120- and Arm-dependent expression of rho to preclude activation of stem cell EGFR. Apoptotic enterocytes (right) disrupt this inhibitory feedback to trigger localized EGFR activation and replacement divisions of stem cells. Representative images shown in all panels. All scale bars are 25 μm.
How is enterocyte apoptosis coupled to stem cell divisions? The epithelial cell-cell adhesion protein E-cadherin (E-cad, also known as shotgun) drew our attention because it is a potential link between apoptosis, proliferation, and tissue homeostasis: First, E-cad undergoes targeted degradation by effector caspases in apoptotic epithelial cells 23-26. Second, loss of E-cad drives proliferation of epithelial tumors 27, and, in mouse intestine, targeted loss of enterocyte cadherin results in activated proliferation of progenitor cells 28. Third, the E-cad adhesion complex is an upstream regulator of density-dependent contact inhibition incultured epithelial cells 29-31.
To assess whether E-cad is involved in coupling divisions to apoptosis, we first examined whether E-cad is downregulated in dying enterocytes. An E-cad::mTomato fusion 32 strongly delineated cell-cell interfaces between healthy enterocytes (Fig. 2a). In contrast, E-cad::mTomato was largely absent from cell-cell interfaces between dying enterocytes, which were identified by Sytox 33. Altogether, these findings imply that dying enterocytes lose cell-surface E-cad, akin to apoptotic cells in other epithelia 23-26.
To investigate the functional role of E-cad downregulation, we depleted E-cad in apoptosis-blocked enterocytes and measured stem cell divisions (Fig. 2b-e). In contrast to apoptotic in-hibition alone (mexts>p35), stem cells did not slow their divisions when E-cad was additionally knocked down (mexts>p35, E-cadRNAi). At the same time, total cell number increased by 70%, resulting in enlarged, hyperplastic organs (Fig. 2h-j, Extended Data Fig 3a). These effects are E-cad-specific because depletion of another midgut cell-cell adhesion protein, echinoid, did not affect cell number (Fig. 2h). E-cad depletion alone (mexts>E-cadRNAi) induced excess divisions but not organ hyperplasia, likely because of other, tissue-level effects (Fig. 2b, g; Extended Data Fig 5). E-cad overexpression suppressed divisions (Fig. 2b, f). Importantly, E-cad depletion did not disrupt the overall architecture or polarity of the midgut epithelium (Extended Data Fig. 4a, c-d, f), consistent with E-cad loss-of-function in the embryonic midgut 34; nor did it compromise the intestinal barrier, likely because septate junctions are intact (Extended Data Fig 4g-j). Thus, enterocyte E-cad suppresses stem cell divisions during apoptotic inhibition for homeostatic control of cell number.
E-cad mediates cell-cell adhesion by forming intercellular homodimers. We thus considered whether enterocyte E-cad acts by dimerizing with stem cell E-cad 35,36. To separately test the requirement for E-cad on progenitors, we built a system similar to Fig. 1f that combines genetic manipulation of stem and enteroblast cells (esgGAL4;GAL80ts, or esgts) with split-lacZ lineage tracing of stem cells. Consistent with a prior report of 3-day E-cad null clones 36, we found that neither depletion nor overexpression of E-cad altered the rate of stem cell divisions in 4-day clones (Fig. 2k). These data suggest that enterocyte E-cad acts not in conjunction with stem cell E-cad, but rather via a distinct intermediary.
Prime candidates for this intermediary signal include Wingless/Wnt, Hippo, cytokine-JAK-STAT, and EGFR. These pathways act downstream of E-cadherin in other tissues 30,37-42 and are key mediators of injury-activated proliferation in the midgut 43-45. To assess whether these pathways are downstream of enterocyte E-cad, we examined whether E-cad depletion resulted in pathway activation. Known target mRNAs for Wingless and Hippo were not elevated in E-cad knockdown midguts compared to controls (Extended Data Fig. 6a). The cytokines unpaired1-3 (upd1-3), which—particularly upd3—acutely respond to midgut injury 46-49, were not elevated (Extended Data Fig. 6a-d). Activation of downstream STAT targets in progenitors was also unaffected (Extended Data Fig. 6a, e-g). By contrast, EGFR target mRNAs were significantly elevated (Extended Data Fig. 6a, h-j).
To visualize EGFR activation, we immunostained midguts for the activated, diphosphorylated form of the EGFR effector ERK (dpERK) (Fig. 3a-f, Extended Data Fig. 3b). ERK activation occurred predominantly in stem cells (Fig. 3f), consistent with prior reports from others44,46,50-54. We found that ERK-activated stem cells were infrequent during normal turnover, became abundant when E-cad was depleted from enterocytes, and virtually disappeared when E-cad was overexpressed (Fig. 3a-c, Extended Data Fig. 3b). Other studies have reported that ERK activation in the midgut is predominantly due to activation of EGFR 13,44,46,51-53. Indeed, pharmacological EGFR inhibition (AG1478) or a conditional lethal heteroallele (egfrtsla/egfrf24) eliminated the dpERK signal in E-cad knockdown midguts (Fig. 3d-e, Extended Data Fig. 3b). Critically, EGFR signaling was required for excess stem cell divisions and organ hyperplasia caused by loss of E-cad in apoptosis-blocked enterocytes (Fig. 3g-h; Extended Data Fig. 3a). Thus, enterocyte E-cad inhibits stem cell EGFR signaling, and this inhibition mediates homeostatic control of cell number and organ size.
How does E-cad on enterocytes control EGFR activation in stem cells? Physical binding of E-cad and EGFR is one possible mechanism 23-26,55,56; dispersal of secreted signals is another 57,58. To shed light on these possibilities, we used MARCM 59 to generate single, GFP-marked enterocytes that were depleted of E-cad. We measured the spatial range of EGFR activation surrounding the marked enterocyte (Fig 3i). ERK-activated cells frequently appeared in the vicinity of, but did not necessarily contact, single E-cad knockdown enterocytes, supporting the existence of a dispersed signal. Strong EGFR activation occurred within a radius of ~25 μm from the edge of E-cad knockdown enterocytes, while weaker activation occurred up to ~50 μm (Fig. 3j-l). These findings suggest that EGFR activation involves a dispersed signal that acts in a localized zone around the enterocyte.
Is this dispersed, E-cad-controlled signal an EGF ligand? Supporting this notion, we found that the two enterocyte-derived EGFs, spitz (spi) and keren (krn) 46,51,52, were necessary for organ hyperplasia caused by loss of E-cad in apoptosis-blocked enterocytes (Figure 3h, Extended Data Fig. 3a). However, depletion of enterocyte E-cad surprisingly did not alter mRNA levels of either spi or krn (Fig. 4a). Furthermore, mRNA levels were unchanged for the visceral muscle-derived EGF vein 46,51,52, the EGF chaperone star, the secreted EGF inhibitor argos, and egfr itself. Strikingly by contrast, levels of the obligate EGF protease rhomboid (rho) increased substantially with E-cad knockdown and decreased with E-cad overexpression (Fig. 4a).
During EGF biosynthesis, Rho cleaves inactive, membrane-tethered EGF peptides into active, soluble forms 60,61. This function raises the possibility that E-cad controls EGF signaling by controlling EGF processing through Rho. Consistent with this possibility, we found that expression of rho-lacZ in enterocytes, but not diploid progenitor cells, was activated by E-cad knockdown and inhibited by E-cad overexpression (Extended Data Fig. 7c-d, f). Thus, E-cad suppresses transcription of rho specifically in enterocytes.
We tested whether levels of enterocyte rho determine levels of stem cell EGFR activation. Overexpression of rho in enterocytes promoted activation of ERK and increased numbers of mitotic stem cells (Extended Data Fig. 3b, Extended Data Fig. 7m-n,s). Conversely, depletion of rho abrogated activation of ERK (Extended Data Fig. 3b, Extended Data Fig. 7o). Furthermore, combined depletion of rho and E-cad together precluded the hyperactivation of ERK caused by depletion of E-cad alone (Fig. 4b-c, Extended Data Fig. 3b). Altogether, these results show that enterocyte E-cad inhibits stem cell EGFR by repressing enterocyte rho.
Is this E-cad-Rho-EGFR relay responsible for coupling stem cell divisions to enterocyte apoptosis? If so, then: (1) apoptotic enterocytes, which lose E-cad (Fig. 2a), should concomitantly upregulate rho; (2) loss of E-cad in apoptotic enterocytes should underlie stem cell EGFR activation; and (3) exogenous manipulation of rho should disrupt cellular equilibrium and alter organ size. We investigated each of these predictions. First, we examined the expression pattern of rho during normal midgut turnover. Strikingly, the rho-lacZ reporter predominantly marked apoptotic enterocytes and rarely marked non-apoptotic enterocytes (Fig. 4d-f). Thus, enterocytes repress rho when healthy but activate rho upon physiological apoptosis.
Prior studies have shown that rho is upregulated upon tissue-wide injury or panenterocyte death 46,52. Given this precedent, we wondered whether other injury signals are activated upon physiological apoptosis. However, the cardinal injury signal upd3 was rarely observed in apoptotic enterocytes (Extended Data Fig. 6k). Furthermore, upd3 was dispensible for stem cell ERK hyperactivation in E-cad knockdown enterocytes (Extended Data Fig. 3b, Extended Data Fig. 7i). These contrasts between upd3 and rho indicate that dying cells signal differently in injury and steady-state contexts, possibly due to loss of the intestinal barrier or inefficient clearance of cell corpses following extensive damage.
To test the second prediction, we blocked enterocyte apoptosis (mexts>p35) and examined stem cell EGFR activation. ERK-activated stem cells were virtually absent following apoptotic inhibition but were restored by the additional depletion of enterocyte E-cad (mexts>p35, E-cadRNAi) in a rho-dependent manner (mexts>p35, E-cadRNAi, rhoRNAi) (Fig. 4g-j, Extended Data Fig. 3b). These results demonstrate that loss of E-cad in apoptotic enterocytes is responsible for EGFR activation in stem cells.
To examine the third prediction, we manipulated rho in enterocytes and measured total cell number and organ size. Overexpression of rho in apoptosis-inhibited enterocytes (mexts>p35, rho) resulted in organ hyperplasia, with cell number increased by 100% (Fig 4k, Extended Data Fig. 3a). Conversely, loss of rho in apoptosis-competent enterocytes (mexts>rhoRNAi) resulted in organ atrophy, with cell number reduced by ~60% (Extended Data Fig. 8). This requirement for Rho during steady-state turnover contrasts with prior findings that Rho is dispensible for injury repair 46, drawing further distinction between turnover and repair mechanisms. Moreover, combined loss of both rho and E-cad in apoptosis-inhibited enterocytes (mexts>p35,E-cadRNAi, rhoRNAi) thwarted the hyperplasia that would have resulted from loss of E-cad alone, and normal cell number was preserved (Fig. 4k, Extended Data Fig. 3a). Altogether, these results show that downstream of E-cad, rho is the pivot point that balances division and death to maintain constant organ size.
Finally, how does E-cad, a transmembrane adhesion receptor, control expression of rho in the nucleus? To address this question, we examined three factors whose ability to activate nuclear transcription is precluded by sequestration at E-cad-containing adherens junctions: β-catenin/Armadillo (Arm), p120-catenin (p120, also known as p120ctn), and YAP/Yorkie (Yki) 38,62-68. We found that arm and p120, but not yki, were required in E-cad knockdown enterocytes for both induction of rho and hyperactivation of stem cell EGFR (Extended Data Fig. 7a, g-l). Overexpression of p120, but not constitutively active armS10, was sufficient for induction of rho (Extended Data Fig. 7b-f) and hyperactivation of EGFR (Extended Data Fig. 3b, Extended Data Fig. 7p-r). Overexpression of the transcriptional co-repressor Groucho, which can dimerize with β-catenin/Arm to repress rho in some tissues69-71, did not inhibit induction of rho in enterocytes (Extended Data Fig. 7a). Overexpression of the JNK inhibitor puckered partially inhibited rho induction, although the statistical significance of this effect was unclear (Extended Data Fig. 7a).
We next asked whether Arm, p120, or both affect organ size. Enterocyte knockdown of either arm or p120 blocked the hyperplasia that otherwise would have occurred upon loss of E-cad and apoptotic inhibition; knockdown of both factors had a quantitatively similar effect (Fig 4k, Extended Data Fig. 3a). In addition, overexpression of p120, but not armS10, was sufficient to induce hyperplasia, and overexpression of both factors exacerbated the effect (Fig. 4k, Extended Data Fig 3a). Conversely, depletion of either arm or p120 produced mild atrophy (Extended Data Figure 8). These data show that the p120 and Arm transcription factors underlie Ecad-controlled expression of rho and suggest that E-cad represses rho by sequestering p120 and Arm to control organ size.
Altogether, our results demonstrate that steady-state organ turnover is not driven by the constitutive cycling of stem cells. Instead, healthy enterocytes keep stem cells in a default state of quiescence, while the sporadic appearance of apoptotic enterocytes triggers replacement divisions. Precise cellular balance hinges upon the E-cad-dependent repression of rho in healthy enterocytes, which is disrupted when E-cad is lost in apoptotic enterocytes (Fig 4l). Because divisions are coupled to apoptosis, turnover remains zero-sum over time.
The direct coupling of divisions to apoptosis suggests a simple explanation for how the midgut epithelium dynamically maintains a constant number of cells with such robust precision. Crucially, a single midgut enterocyte can efficiently activate EGFR in stem cells within a ~25 μm radius (Fig. 3j-l). We suggest that this zone of activation, which exists only for as long as the dying cell remains in the epithelium, may be critical for homeostatic size control. If, by chance, stem cells produce too many enterocytes, then the stem cells’ physical spacing would increase; subsequently, fewer stem cells would be within the activation zone of the next dying enterocyte, and fewer divisions would result. Similarly, too few enterocytes would place more stem cells in the activation zone, and more divisions would result. By setting the steady-state number of enterocytes, the integration of these activation zones over the entire epithelium would determine overall organ size. In this manner, localized cell-cell communication can give rise to tissue-level homeostatic equilibrium.
Our study brings to light a basic distinction in how EGFs are deployed during steadystate turnover versus injury repair. At steady-state, apoptotic induction of rho is strictly cell autonomous because E-cad-dependent activation of p120 and Arm is confined to the dying enterocyte. This cell autonomous pathway limits the release of EGFs to the precise time and place that a new cell is needed, as appropriate for zero-sum replacement. By contrast during injury, induction of rho and EGFs involves an additional, non-cell autonomous pathway in which damaged enterocytes upregulate upd3; Upd3 in turn activates enteroblasts and visceral muscle to upregulate rho and EGFs 46,48,49,52. This non-autonomous pathway permits EGFs to be released in a widespread, indiscriminate manner, as appropriate for an emergency response. Underscoring this distinction, enterocyte upd3 is required for repair 13,46,48,49 but not homeostasis (Extended Data Figs. 6a-d, k and 7i), whereas enterocyte rho is required for homeostasis (Fig 4) but not repair 46.
Stem cell EGFR signaling is known to affect homeostasis of other tissues 72-74, raising the possibility that spatially specific control of EGFR activation by E-cad and Rho is a general mechanism for cellular equilibrium. By extension, loss of spatial control should lead to pathological loss of homeostasis. Indeed, we note that multiple human carcinomas downregulate E-cad, upregulate Rhomboids, and activate EGFR 27,75-77, and that progression of colorectal carcinoma, which initiates through loss of the catenin-destabilizing factor APC (adenomatous polyposis coli), requires upregulation of the mammalian Rhomboid RHBDD1 78. Given these intriguing links, we propose that insights into the development of epithelial cancers may emerge from understanding E-cad-EGFR feedback control of steady-state epithelial turnover.
METHODS
Drosophila Husbandry
Crosses utilizing the GAL4/GAL80ts system were performed at 18°C. Upon eclosion, adult animals remained at 18°C for 4 days, unless otherwise indicated. On adult day 4, animals were temperature shifted to 29°C to inactivate GAL80ts and induce GAL4-mediated expression. Midguts were harvested for immunostaining after appropriate lengths of induction (see figure legends for individual experiments). All other crosses were performed at 25°C; refer to figure legends for individual timepoint information. Adult female flies were used in all experiments.
Fly Stocks
w; esgGAL4, tubGAL80ts, UAS-GFP; UAS-flp, act<CD2<GAL4 (esgF/O) (Bruce Edgar) 13
mexGAL4 (Carl Thummel)
esgGAL4 (Ben Ohlstein)
y, w; TI{TI}shg[mTomato] (Bloomington)
UAS-E-cadherinRNAi (TRiP.HMS00693) (Bloomington)
UAS-E-cadherinRNAi (TRiP. JF02769) (Bloomington)
UAS-E-cadherinRNAi (TRiP.GL00646) (Bloomington)
UAS-echinoidRNAi (TRiP.GL00648) (Bloomington)
UAS-rhomboidRNAi (TRiP.JF03106) (Bloomington)
UAS-spitzRNAi (TRiP.HMS01120) (Bloomington)
UAS-kerenRNAi (KK104299) (VDRC)
UAS-armadilloRNAi (TRiP.JF01251) (Bloomington)
UAS-armadilloRNAi (KK107344) (VDRC)
UAS-p120ctnRNAi (TRiP.HMC03276) (Bloomington)
UAS-yorkieRNAi (TRiP.JF03119) (Bloomington)
UAS-unpaired3RNAi (TRiP.HM05061) (Bloomington)
UAS-hisH2A:RFP (Bloomington)
UAS-p35 (Bloomington) UAS-diap1 (Bloomington)
UAS-E-cadherinDEFL (Margaret Fuller) 79
UAS-rhomboid (Bloomington) UAS-armadilloS10 (Bloomington)
UAS-p120ctn (Bloomington) UAS-groucho (Amir Orian)
UAS-puckered (puc2A) (Huaqi Jiang)
y w hsflp; X-15-29 w+ (‘split-lacZ’) 19
y w; y+ X-15-33 (‘split-lacZ’) 19
Egfrf24/T(2;3)TSTL (Bloomington) Egfrtsla/T(2;3)TSTL (Bloomington)
w UAS-CD8:GFP hsflp; tubGAL4; FRT82 tubGAL80 (David Bilder) 6
w; FRT82 (David Bilder) 6
rhoX81 (rho-lacZ) (Huaqi Jiang) 80
10xSTAT-GFP (Bloomington)
Upd3.1-lacZ (Huaqi Jiang)
cycE-lacZ (Bloomington)
Detailed information on Drosophila genes and stocks is available from FlyBase (http://flybase.org/).
Immunohistochemistry and Microscopy
Samples were fixed, immunostained, and mounted as previously described 6. Primary antibodies: mouse anti-β-galactosidase (1:400, Promega Z3781), mouse anti-Armadillo (1:100, DSHB N27A1), rabbit anti-cleaved caspase 3 (1:200, Cell Signaling, generous gift from D. Bilder 6) rabbit anti-diphospho-ERK (1:400, Cell Signaling 4370P), goat anti-HRP-Cy3 (Cappel, 1:100) which stains stem cells and enteroblasts 6, mouse anti-Coracle (1:50, DSHB C615.16), mouse anti-Discs large C615.16 (1:50, DSHB 4F3), and rabbit anti-phospho-histone H3, Ser 10 (1:1000, EMD Millipore). Secondary antibodies: Alexa Fluor 488-, 555- or 647-conjugated donkey anti-rabbit or anti-mouse IgGs (1:800, LifeTechnologies A31570, A11001, and A21244). Nuclei were stained with DAPI (LifeTechnologies, 1:1000). Actin was stained with SiR-Actin (Spirochrome, 1:500) or Alexa 647-conjugated phalloidin (1:100, LifeTechnologies). Samples were mounted in ProLong (LifeTechnologies). Imaging of samples was performed on a Leica SP8 confocal microscope, with serial optical sections taken at 3.5 μm intervals through the entirety of whole-mounted, immunostained midguts.
Regionalization of the Adult Midgut; Cell Counts and Size Measurements of the R4ab (P1-2) compartment
The Drosophila midgut is compartmentalized along its proximal-distal axis. Each compartment exhibits a characteristic digestive physiology, gene expression pattern, and stem cell division rate 14,15,81,82. In general, stem cell clones do not cross compartment boundaries 15. Our study focused specifically on two adjacent compartments, known alternatively as R4ab or P1-2, which comprise the major region of nutrient absorption 14,15. We observed that R4ab consistently exhibited complete cellular turnover between adult days 4-8, as indicated by esgF/O labeling (Fig. 1a-e, Extended Data Fig. 1f-g). Other midgut compartments exhibited variable, incomplete turnover during the same time period, consistent with prior reports 9,83-85; they were not analyzed in this study.
To perform total cell counts of R4ab, this region was first identified in confocal image stacks using morphological landmarks (Extended Data Fig 1b-e, g)14 and digitally isolated in Fiji. Bitplane Imaris software algorithms were applied to generate three-dimensional organ reconstructions and comprehensively count individual cell nuclei by mapping DAPI signals to Imaris surface objects. For analysis of esgF/O midguts, GFP+ cells were additionally counted by mapping DAPI/GFP colocalization signals to Imaris surface objects. R4ab lengths were measured by a spline through the center of individual midguts in Fiji.
Split-lacZ Clone Induction and Analysis
As depicted in Fig. 1f, animals were raised at 18°C and shifted to 29°C four days post-eclosion. Split-lacZ clone induction 19 was performed by subjecting animals to two 30-min, 38.5°C heat shocks separated by a 5-min chill on ice. Four days after clone induction, midguts were immunostained and clones in the R4ab region were identified and analyzed by visual examination of serial confocal sections. Clones in regions outside R4ab were excluded from analysis. Clone size was measured as the number of contiguous cells in one discrete clone, as previously described 6. Approximately 1-3 single labeled enterocytes per R4ab region were observed, consistent with published reports 9,86; these transient clones were not included in our quantification. Single labeled diploid cells were included because these likely represented individual stem cells that did not divide during the chase period. No labeled cells were observed in the absence of 38.5°C heat shock.
Safeguards to ensure exclusion of non-stem cell (transient) clones
To ensure that clone counts comprised exclusively stem cell clones and excluded any non-stem cell (transient) clones that were directly labeled by the heat shock, our split-lacZ clonal analyses incorporated two, redundant safeguards. First, a 4-day chase period was included between heat-shock induction and subsequent clonal analysis. Because they are post-mitotic and transient, enteroblasts/enterocytes that were directly labeled by the heat shock would have been lost during the succeeding chase period. Confirming that transient clones were nearly absent, only 1-3 single labeled enterocytes were observed per midgut R4ab region after the 4-day chase. As a second safeguard, all single, labeled enterocytes were excluded from our clone counts.
Sytox staining
Sytox Green (ThermoFisher, 5mM in DMSO) or Sytox Orange (ThermoFisher, 5mM in DMSO) were diluted 1:5,000 in 5% sucrose. Sytox solution was fed to animals in an empty vial for 5-6 hours, after which midguts were dissected and mounted in ProLong (LifeTechnologies). Because Sytox is incompatible with fixation, live organs were imaged immediately after mounting.
MARCM Clone Inductions
MARCM clone inductions 59 were performed by subjecting animals to two 30-min, 38.5°C heat shocks separated by a 5-min chill on ice. For single-enterocyte MARCM clones, animals were dissected five days post-induction and terminal clones consisting of one GFP+ enterocyte (identified by its polyploid nucleus) were selected for analysis. GFP+ enterocytes were excluded from analysis if another GFP+ clone was present within an 80 μm radius. Fiji was used to measure the distance between the plasma membrane of the nearest GFP+ enterocyte and the center of dpERK+ stem cells within a 60 μm radius. For mosaic analyses of multicell MARCM clones, animals were fed Sytox three days post-induction and dissected. The proportion of labeled clone cells (GFP+) that were also Sytox+ was quantified.
AG1478 Drug Treatment
Stocks of AG1478 (Sigma) were dissolved in EtOH and subsequently diluted in dH2O to reach a working concentration of 100 μM AG1478 (in 0.02% EtOH). This 100 μM stock solution was used to prepare yeast paste, which was fed to animals as a supplement to their standard cornmeal-molasses diet for the duration of induced gene expression.
Smurf Assay
Smurf assays 87 were conducted by feeding adult animals yeast paste containing 2.5% Brilliant Blue FCF (Sigma) and scoring animals for leakage of dye into the abdomen. Animals were scored as ‘non-Smurf’ if the blue dye was confined to the GI tract and ‘Smurf’ if blue dye leaked outside the GI tract. As a positive control, animals were fed dye in conjunction with 1% SDS.
qRT-PCR
mRNA was extracted from midguts (5 animals/experiment) followed by cDNA synthesis with Invitrogen SuperStrand III First Script Super Mix (Invitrogen). Real-time PCR was performed using the relative standard curve method with SYBR GreenER Supermix (Invitrogen) on a StepOnePlus ABI machine. Expression levels were normalized to mexGAL4ts>CD4-GFP midguts; mef2 transcripts were used as a reference 6.
Statistical Analysis
All statistical analysis was performed using Graphpad Prism 6. For comparisons of clone size distributions, unpaired two-tailed Mann-Whitney tests were used to assess statistical significance. (Clone size distributions are non-normal, independent, and derived from a simple random sample.) For comparisons of cell numbers and gut length, unpaired two-tailed t-tests were used to assess statistical significance. (Organ cell number and size distributions are normal, independent, and derived from a simple random sample.) For comparisons of rho gene expression, unpaired two-tailed t-tests were used to assess statistical significance. Legend: ns = not significant (p>0.05), *= p<0.05, **= p<0.01, ***= p<0.001, and **** = p<0.0001.
Study Design
Sample sizes were chosen based on our previous study 6, which also characterized changes in organ cell number and clone sizes. In split-lacZ experiments, single enterocyte clones were excluded from analysis. No other exclusion criteria were applied. No sample randomization or blinding was performed, although automated, Imaris-based computer algorithms were used to analyze and quantify most data in this study.
qPCR Primers
Primers for qPCR listed from 5’ to 3’:
vein-fwd GAACGCAGAGGTCACGAAGA
vein-rev GAGCGCACTATTAGCTCGGA
spitz-fwd CGCCCAAGAATGAAAGAGAG
spitz-rev AGGTATGCTGCTGGTGGAAC
keren-fwd CGTGTTTGGCAACAACAAGT
keren-rev TGTGGCAATGCAGTTTAAGG
egfr-fwd TGCATCGGCACTAAATCTCGG
egfr-rev GGAAGCTGAGGTCCAAATTCTC
argos-fwd TGCTGTTGGGTGAATTTCAGG
argos-rev CGACTGGTCCAGATGATCCA
star-fwd AGCCCAGTCCTTCAAACCC
star-rev CCACAGTCTTTGGTTGGTTGC
rhomboid-fwd GAGCACATCTACATGCAACGC
rhomboid-rev GGAGATCACTAGGATGAACCAGG
frizzled 3-fwd TCTTGTGCCCGCAAAACTTTA
frizzled 3-rev CCTAGAATGAGGGTCTCAGACG
senseless-fwd GATCGTGACTTTGCCTTGACG
senseless-rev CCTGATAGTCCTGCTTGCTGT
expanded-fwd GATGCTGGACACCGAACTCT
expanded-rev CTTGCTCTCGGGATCTGC
diap1-fwd GAAAAAGAGAAAAGCCGTCAAGT
diap1-rev TGTTTGCCTGACTCTTAATTTCTTC
pointed-fwd CTACGAGAAGCTGAGTCGCG
pointed-rev TATCGTTTGCCTGCCGTCTT
cycE-fwd ACAAATTTGGCCTGGGACTA
cycE-rev GGCCATAAGCACTTCGTCA
upd1-fwd CCTACTCGTCCTGCTCCTTG
upd1-rev TGCGATAGTCGATCCAGTTG
upd2-fwd GAGGGCAGCTACGACAGTG
upd2-rev GGAGAAGAGTCGCAGGTTGT
upd3-fwd AAATTCGACAAAGTCGCCTG
upd3-rev TTCCACTGGATTCCTGGTTC
wdp-fwd TGGCAACCACAATGAGGAACAG
wdp-rev GACCGAGAAGACCTTCCAGTCAAC
Socs36E-fwd CAGTCAGCAATATGTTGTCG
Socs36E-rev ACTTGCAGCATCGTCGCTTC
mef2-fwd ATCGGCAGGTGACCTTCAAC
mef2-rev GTTGTACTCGGTGTACTTGAGCAG
Primer sequences from Jiang et al. 2011 46, Shaw et al. 2010 88, and Fly Primer Bank (http://www.flyrnai.org/FlyPrimerBank).


Author contributions
J.L. and L.E.O. designed the experiments and wrote the manuscript. J.L., S.B., and S.N. performed confocal microscopy. J.L. and S.N. prepared microscopy specimens. J.L. performed all other experiments, genetic crosses, data analysis, and statistical analysis.
Author information
The authors declare no competing financial interests. Correspondence and requests for materials should be addressed to L.E.O. (lucye{at}stanford.edu)
Acknowledgments
J.L. was supported by NSF GRFP DGE-114747 and NIH T32GM007276. This work was supported by NIH R03DK104027 and R01GM116000-01A1 to L.E.O. Confocal microscopy was performed at the Stanford Beckman Cell Sciences Imaging Facility (NIH 1S10OD01058001A1). We thank D. Bilder for the gift of cCas-3 antibody; the Developmental Studies Hybridoma Bank for other antibodies; D. Bilder, B. Edgar, M. Fuller, H. Jiang, B. Ohlstein, C. Thummel, the Bloomington Drosophila Stock Center (NIH P40OD018537), the TRiP at Harvard Medical School (NIH/NIGMS R01-GM084947), and the Vienna Drosophila Resource Center for fly stocks; J. Axelrod, M. Goodman, M. Fuller, W.J. Nelson, R. Nusse, M. Krasnow,T. Nystul, and D. Fox for comments on the manuscript; and B. Benham-Pyle, M. Mirvis, N. Pierce, and D. Gordon for helpful discussions. The authors declare no competing interests.


