

Abstract
We introduce cytoNet, a method to characterize multicellular topology from microscopy images. Accessible over the web, cytoNet quantifies the spatial relationships in cell communities using principles of graph theory, and evaluates the effect of cell-cell interactions on individual cell phenotypes. We demonstrate cytoNet’s capabilities in two applications relevant to regenerative medicine: quantifying the morphological response of endothelial cells to neurotrophic factors present in the brain after injury, and characterizing cell cycle dynamics of differentiating neural progenitor cells. The framework introduced here can be used to study complex cell communities in a quantitative manner, leading to a deeper understanding of environmental effects on cellular behavior.
A cell’s place in its environment influences a large part of its behavior. Advances in the field of phenotypic screening have yielded automated image analysis software that provide detailed phenotypic information at the single-cell level (such as morphology, stain texture and stain intensity) from microscopy images in a high-throughput manner1,2. However, current image analysis pipelines often do not account for spatial and density-dependent effects on cell phenotype. Various types of cell-cell interactions including juxtacrine and paracrine signaling are an integral part of biological processes that affect the behavior of individual cells. The recent emergence of technologies for multiparametric mapping of protein and RNA expression in individual cells while preserving the spatial structure of the tissue3 has further highlighted the need to study single-cell behavior in the context of cell communities.
For these reasons, a robust method to quantify the spatial organization of cell communities and its influence on the behavior of individual cells adds an important, missing component to currently existing image analysis tools. Such a method can be used to enhance image-based biological discovery through phenotypic screens2 by supplying multicellular metrics, provide a non-invasive means to standardize cell manufacturing for therapeutic purposes4, and develop a quantitative framework for the analysis of spatially-detailed human cell atlas data5,6.
Prior reports have accounted for population context in image-based screens by using features such as local cell density or a cell’s position on an islet edge, that describe local cell crowding7,8. Mathematical graphs, structures that are used to model pairwise relationships between objects, are uniquely suited to cell community analysis. Among image-based methods that employ graph theory to analyze spatial relationships among cells, the cell-graph technique9 has been employed to great effect in analyzing structure-function relationships in tissue sections. However, coupling single cell data to network structure has been elusive: there remains a need for a broadly applicable, user-friendly tool that enables spatial analysis of various different cell types, integrated with metrics describing the phenotype of individual cells.
Here we introduce an image analysis method called cytoNet for quantification of multicellular spatial organization using a graph theoretic approach. cytoNet is available as a web-based interface, providing significant ease of use compared with other programs that require downloading software. Taking fluorescence microscope images as input, the cytoNet image analysis pipeline identifies cells, creates spatial network representations tailored to the type of image and cell type, and calculates a set of metrics derived from graph theory that describe the network structure of the local multicellular neighborhood of a cell of interest. We define this multicellular neighborhood as a cell’s community. Cell community metrics are then integrated with descriptors of cell phenotype, such as morphology and protein expression, to provide a comprehensive description of single- and multiple-cell phenotype states.
The cytoNet pipeline begins with microscope images (Fig. 1a). Appropriate segmentation algorithms are implemented to detect cells (Fig. 1b, Supplementary Fig. 1–2). Upon detection of cells, the next step is to evaluate spatial proximity of cells. We do this in one of two ways – by evaluating the overlap of adjacent cell boundaries (type I graphs), or by evaluating the proximity of cells in relation to a threshold distance (type II graphs) (Fig. 1c). The former approach is useful when detailed information of cell boundaries and morphology is available, such as in the case of membrane stains or cells stained for certain cytoskeletal proteins. The latter approach is useful when dealing with images of cell nuclei, where detection of exact cell boundaries is not possible. In both approaches, cells deemed adjacent to each other are connected through edges, resulting in a network representation (Fig. 1d). This connectivity is denoted mathematically using an adjacency matrix, A (Fig. 1d), where Ai,j = 1 if there exists an edge between cells i and j, and 0 otherwise. Finally, the extracted metrics are used to visualize and analyze local neighborhood effects on individual cell phenotypes (Fig. 1e).
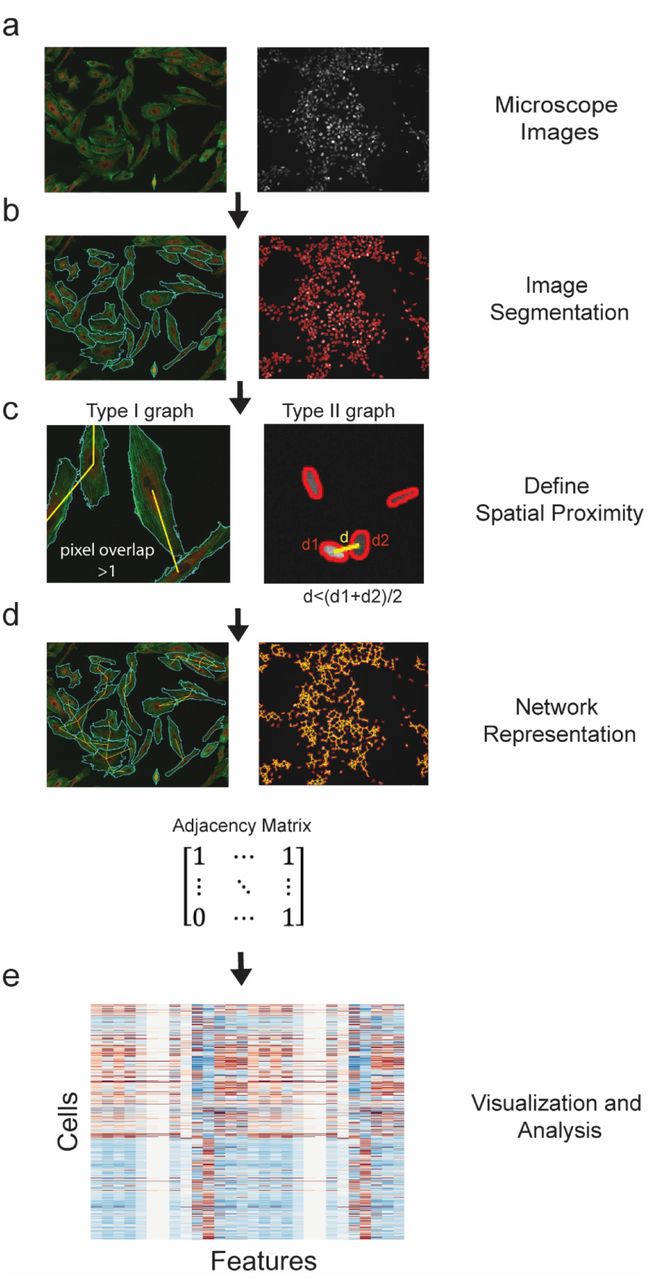
(a) The pipeline begins with microscope images. (b) Segmentation algorithms automatically detect cell boundaries (Supplementary Fig. 1, 2). (c) Spatial proximity is determined either by measuring shared pixels between cell pairs – type I graphs (left panel) or by comparing distance between cell centroids to a threshold distance – type II graphs (right panel). (d) We represent the resulting network as an adjacency matrix. (e) Metrics derived from the adjacency matrix are used to describe network information. These metrics are a list of features computed on a per-cell basis.
First, we demonstrate the utility of cytoNet in analyzing cell cycle dynamics in communities of differentiating neural progenitor cells. Neural progenitor cells are multipotent cells that can differentiate into neurons, astrocytes or oligodendrocytes. Cell cycle regulation in neural progenitor cells is of interest as it has implications for the genetic basis of brain size in different species10 and aberrant regulation can cause diseases like microcephaly11. Studies in the ventricular zone of the embryonic mouse neocortex have shown that clusters of clonally-related neural progenitor cells go through the cell cycle together12,13. However, it is unclear whether this community effect is a ubiquitous feature of neural progenitor cells. To this end, we employed the cytoNet workflow to determine whether cell cycle synchronization is a feature of differentiating neural progenitor cells cultured in vitro.
For this investigation, ReNcell VM human neural progenitor cells were stably transfected with the FUCCI cell cycle reporters14 to generate Geminin-Venus/Cdt1-mCherry/H2B-Cerulean (FUCCI-ReN) cells. We captured time-lapse movies of FUCCI-ReN cells after withdrawing growth factors to induce differentiation, and built network representations from nucleus images. Adjacency was determined by comparing centroid-centroid distance to a threshold (type II graphs, Fig. 1c).
In order to evaluate spatiotemporal synchronization in cell cycle, for each individual cell in a frame, we evaluated the average fraction of neighboring cells in a similar phase of the cell cycle (G1 phase – mCherry+ and S/G2/M phases – Venus+), normalized by total fraction of that cell type in the population. We called the average value of this fraction across all cells in an image the neighborhood similarity score, (Supplementary Table 1). Results for medium and low-density cultures are shown in Fig. 2a and Fig. 2b respectively. Frames from corresponding time-lapse movies are shown in Fig. 2c (see also Supplementary Videos 1-4). We observed that groups of cells in the low-density culture moved through the cell cycle in unison, which was reflected in periodically high values of the neighborhood similarity score (Fig. 2a, Supplementary Video 1-2). In contrast, the composition of cell clusters in the medium density culture was relatively heterogeneous, resulting in relatively low values of the neighborhood similarity score over time (Fig. 2b, Supplementary Video 3-4). Neighboring cells in very low-density cultures are likely to be derived from the same clonal lineage, which explains the high level of synchronization in these cultures12. This example highlights how cytoNet can be used to derive insight into the role of cell-cell interactions on dynamic cell behavior.

(a-c) Spatiotemporal synchronization of cell cycle in differentiating neural progenitor cells Neighborhood similarity score (Supplementary Table 1) for low-density culture across time. (b) Neighborhood similarity score across time for medium-density culture. (c) Frames from time-lapse movies corresponding to (a) and (b). Borders of mCherry+ nuclei (G1) are outlined in magenta, Venus+ nuclei (S/G2/M) are outlined in green, and mCherry-/Venus-nuclei (quiescent) are outlined in blue; scale bar = 50µm. (d-i) Influence of local neighborhood density on primary human endothelial cell (HUVEC) morphology. (d) Distribution of cell circularity values grouped under different levels of closeness centrality; Cohen’s d effect size: groups (1, 2) = 0.34, groups (1, 3) = 0.62; sample size, n=786 cells (group 1; cn < 0.025), 741 cells (group 2; 0.025 < cn < 0.05) and 782 cells (group 3; cn > 0.05) (e) Sample immunofluorescence image with graph representation overlaid; scale bar = 50 µm. (f) Heatmap depicting closeness centrality of each cell, with circularity values overlaid in text. (g) Bar plot of variance explained by growth factor treatment and local network metrics. (h) Box plot of cell size as a function of growth factor treatment. (i) Box plot of mean actin intensity as a function of growth factor treatment. Legends and axes in (h-i) contain information on treatment (BDNF, VEGF), concentration (50ng/ml, 100ng/ml) and time of treatment (6 hours and 12 hours). Cohen’s d effect size for (h-i) is shown in Supplementary Table 3.
Next, we used cytoNet to evaluate the relative influence of local neighborhood density and growth factor perturbations on endothelial cell morphology. From a regenerative medicine perspective, studying the morphological response of endothelial cells to neurotrophic stimuli can help assess the cells’ potential angiogenic response following brain injuries that induce growth factor secretion, like ischemic stroke or transient hypoxia15,16. Common high-throughput angiogenic assays focus on migration and proliferation as the main cell processes defining angiogenesis, or the growth of new capillaries from existing ones17. Distinct morphology and cytoskeletal organization of endothelial cells indicate the cell’s migratory or proliferative nature, and hence their angiogenic contribution within a sprouting capillary18. Reproducibly quantifying the morphological response of endothelial cells to neurotrophic factors would enable more targeted approaches to enhancing brain angiogenesis.
We took an image-based approach to this problem, building a library of immunofluorescence images of human umbilical vein endothelial cells (HUVECs) stained for cytoskeletal structural proteins (actin, α-tubulin) and nuclei, in response to various combinations of vascular endothelial growth factor (VEGF) and brain-derived neurotrophic factor (BDNF) treatment. Cell morphology was annotated using 21 metrics described in our previous study19 (Supplementary Table 2), which included cell shape metrics like circularity and elongation, and texture metrics for cytoskeletal stains such as Actin polarity, smoothness etc. Cluster analysis on this dataset revealed dominant morphological phenotypes as a function of treatment conditions (Supplementary Fig. 3).
We then used the cytoNet workflow to quantify density-dependent effects on endothelial cell morphology in control cultures (without any growth factor perturbation). Network representations were designated based on shared cell pixels (type I graphs, Fig. 1c) and local network properties were described using seven metrics, including degree (number of neighbors) and centrality measures (indicating relative location of cells within colonies) (Supplementary Table 1). Our analysis showed correlations between cell morphological features and local network properties (Supplementary Fig. 4). Some of these relationships were expected, for instance the positive correlation between shared cell border and cell size. Other relationships, such as the negative correlation between cell circularity and closeness centrality, capture intuitive notions of the influence of cell packing on morphology (Fig. 2d-f). The closeness centrality of a cell (Supplementary Table 1) describes its relative position in a colony – cells in the middle of a colony will have higher centrality values than cells at the edge of a colony or isolated cells. The negative relationship between circularity and closeness centrality implies that isolated cells and cells located at the edge of colonies are more likely to have a circular morphology, while more densely packed cells tend to be less circular (Fig. 2e-f). Thus, our analysis revealed that local network properties have a quantifiable effect on cell morphology.
Next, we developed a workflow to analyze the effect of growth factor treatments on cell morphology, while correcting for the effect of local network properties. We applied a quantile multidimensional binning approach20,21 to calculate the variance in morphology metrics that could be individually explained by all local network metrics and growth factor treatments (Fig. 2g). We then calculated the values for each morphology metric after correcting for the effect of local network metrics (see Methods). The raw and network-corrected values for two metrics, cell size and mean actin intensity, are shown as box plots in Fig. 2h-i. The influence of network properties can be clearly seen on cell size, where at 6 hours, large cell sizes are seen in the uncorrected but not corrected plots (Fig. 2h). The effect of growth factor treatment can be clearly seen in network-corrected mean actin intensity (Fig. 2i, Supplementary Table 3), where VEGF and BDNF treatment have dose-dependent effects on mean actin intensity. Thus, cytoNet detects the independent effects of local neighborhood properties and growth factor perturbations on endothelial cell morphology.
The examples described above illustrate how cytoNet can be used to enhance image informatics for phenotypic screens as well as basic discovery in biology. From the image informatics perspective, cytoNet adds crucial information on local cell density to the suite of metrics that are currently used to characterize individual cells. We illustrated how local network metrics can be used to infer independent effects of cell density and chemical perturbations. This workflow can be used to more comprehensively characterize the response of cells to chemical perturbations, which can aid in drug discovery.
The cytoNet workflow can also be used to quantitatively study biological pathways involved in cell-cell communication. The combination of visualizing dynamic cell behavior through time-lapse movies and quantifying local cell-cell interactions is particularly powerful. This paradigm can be of great benefit in stem cell biology to evaluate environmental effects on cell fate decisions. More broadly, the principle behind cytoNet – treating cell communities as complex ecosystems – will help transition from characterizing cells as independent ‘silos’ to a more holistic approach, where due importance is given to the environment surrounding cells.
AUTHOR CONTRIBUTIONS
ASM, DTR, JTR and AAQ designed the experiments. ASM, GLB and DTR performed the experiments. AAQ, BLL, CWH and ASM analyzed the data. BLL and AL designed and implemented the cytoNet website. All authors contributed to writing the manuscript. AAQ, AW and JTR supervised the work.
COMPETING FINANCIAL INTERESTS
The authors declare no competing financial interests.
METHODS
Software
CytoNet is available as a web interface at https://qutublab.org/cytoNet/
See Supplementary Methods 1 for instructions on using cytoNet.
Cell Culture
Human umbilical vein endothelial cells (HUVECs, Lonza) were cultured in EBM-2 medium (Lonza) supplemented with penicillin-streptomycin (Fisher Scientific) and EGM-2 SingleQuot bullet kit (Lonza). For imaging experiments, cells were cultured for different periods (6, 12 or 24 hours) in different combinations of vascular endothelial growth factor (VEGF, human recombinant; Millipore) and brain-derived neurotrophic factor (BDNF, human recombinant, Sigma-Aldrich). Concentrations used were in the range 50-100ng/mL. Controls were the same culture period without growth factor treatments.
Immortalized human neural progenitor cells derived from the ventral midbrain (ReNCell VM) were obtained from Millipore. Cells were expanded on laminin-coated tissue culture flasks, in media containing DMEM/F12 supplemented with B27 (both Life Technologies), 2µg/ml Heparin (STEMCELL Technologies), 20ng/ml bFGF (Millipore), 20ng/ml EGF (Sigma) and penicillin/streptomycin. For differentiation experiments, cells were cultured in medium lacking bFGF and EGF.
FUCCI Reporter Lines
Stable reporter cell lines (FUCCI-ReN) were generated by sequentially nucleofecting ReNcell VM neural progenitor cells with an ePiggyBac22 construct encoding mCherry-Cdt, Venus-Geminin, or Cerulean-H2B. Each construct introduced to the cells was driven by a CAG promoter containing a blasticidin (ePB-B-CAG-mCherry-Cdt1), puromycin (ePB-P-Venus-Geminin), or neomycin (ePB-N-Cerulean-H2B) resistance gene. Following each round of nucleofection, cells were cultured in the presence of appropriate antibiotics (2 µg/ml blasticidin, 0.1 µg/ml puromycin and 100 µg/ml neomycin).
HUVEC Immunocytochemistry
For imaging experiments, HUVECs were cultured on glass dishes coated with fibronectin (Sigma-Aldrich). After appropriate growth factor treatments, cultures were fixed with 4% paraformaldehyde, free aldehyde groups were quenched using 1mg/mL sodium borohydride, and membranes were permeabilized with 0.2% Triton-X-100 solution in PBS. Actin fibers were visualized using an Alexa Fluor 488-phalloidin antibody (1:40, Molecular Probes) and microtubules were visualized using a mouse monoclonal anti-a-Tubulin antibody (1:250, Sigma-Aldrich) followed by a goat anti-mouse Alexa Fluor 647 secondary antibody. Nuclei were stained using Hoescht (Molecular Probes). 16-bit composite immunofluorescence images were acquired through a 20X objective (N.A. = 0.75) on a Nikon Ti-E epifluorescence microscope. Physical pixel size was 0.32µm.
Time-lapse Microscopy
FUCCI-ReN cells were plated at different densities on chambered cover glasses (Fisher Scientific) coated with laminin. Cells were imaged after switching to differentiation medium containing phenol red-free DMEM/F12. Time-lapse imaging was performed using a Nikon Ti-E microscope equipped with a motorized stage, a cage incubator for environmental control (Okolab), a 20X objective lens (N.A. = 0.75), SOLA SE Light Engine for LED-based fluorescence excitation (Lumencor), appropriate filters for visualizing mCherry, Venus and Cerulean fluorescent proteins and a Zyla 5.5 sCMOS camera (ANDOR). 16-bit composite fluorescence images were acquired at 10 minute intervals for a total duration of 57.5 hours.
Image Processing of HUVEC Immunofluorescence Images
Fluorescence images were processed as described previously23 (Supplementary Fig. 1). Briefly, the following steps were used.
Contrast was enhanced using histogram equalization.
Images were smoothed using a 2D Gaussian lowpass filter.
Initial binarization was performed using Otsu’s method.
The binary image was dilated to fill in individual cell areas.
All objects <1% of the total image area were removed. This was called the final binary image.
A binary representation of the nuclear and microtubule image layers was generated using a high input threshold value. This was called the marker image.
Another binary image was created with values of 0 where either the final binary image (step 5) or the marker image (step 6) had a value of 1.
Watershed markers were generated by imposing the minimum of the complement of images obtained in steps 2 and 7. This image had black markers contained within cells to serve as basins for flooding, while cell areas themselves were represented by lighter pixels that served as the rising contours of the basins.
The watershed algorithm was implemented using Matlab’s built-in function to generate cell boundaries.
Masks generated in step 9 were refined by using composite images of microtubules and actin as the marker image (step 6).
In order to automate the threshold generation, the area of cell masks obtained from segmentation were compared to those obtained through thresholding with a high threshold. The entire process was then iterated until an acceptable area ratio was achieved.
Image Processing of FUCCI-ReN Time-Lapse Images
Grayscale images for each channel (H2B-Cerulean, Geminin-Venus and Cdt1-mCherry) were binarized using locally adaptive thresholding. Seeds for the watershed transform were generated using the regional minimas from the distance transform of the grayscale images. Next, the watershed algorithm was applied to detect boundaries between overlapping cell nuclei. Finally, information from different channels were used to correct undersegmented nuclei.
Generation of Network Representation
Type I graphs were generated as follows. Mask boundaries were expanded by 2 pixels and overlap of expanded masks was used to assign edges and build an adjacency matrix (Fig. 1c). Cells touching the image border were included in calculations of local network properties (Supplementary Table 1) for cells not touching the boundary, but were excluded for the construction of the adjacency matrix.
Type II graphs were generated as follows: For each pair of objects (nuclei), a threshold distance for proximity was defined as the average of the two object diameters, multiplied by a scaling factor (S). If the Euclidean distance between the object centroids was lower than the threshold distance computed, then the pair of objects was connected with an edge (Fig. 1c). We chose a default scaling factor S = 2 for all our analysis, through visual inspection of cell adjacency.
Network Metric Computation
All the network metrics described in Supplementary Table 1 were computed using custom-written code, building upon the routines provided in Bounova et al24.
Correction of morphology metrics for effects of local network properties and treatment conditions
We performed quantile multidimensional binning20 of cells for all 7 network metrics (5 bins per metric). The mean of each morphology metric was calculated for each multidimensional bin, and this mean was subtracted from the raw measurements to generate the network-corrected measurements for each cell. Treatment-corrected measurements were generated similarly by calculating the mean of each morphology metric under each treatment condition and then subtracting it from the raw measurements.
Variance explained by local network properties and treatment conditions
The variance explained by each factor was calculated using the following formula21
 Vcorr is the variance of the corrected measurements, and Vuncorr is the variance of the uncorrected measurements.
ACKNOWLEDGEMENTS
We thank Dr. David Noren, Dr. André Schultz and Tien Tang for helpful discussions and comments on the manuscript, and Amada Abrego, Becky Zaunbrecher and Grace Ching for technical assistance. This work was supported by NSF Career Grant 1150645 to AAQ, NSF Neural and Cognitive Systems grant 1533708 to AAQ and JTR, NSF award 1553228 to AW and CPRIT award RR140073 to AW. ASM was supported through NSF IGERT training grant 1250104.
Footnotes
↵* Contact: amina{at}rice.edu


