

ABSTRACT
The incomplete identification of structural variants from whole-genome sequencing data limits studies of human genetic diversity and disease association. Here, we apply a suite of long- and short-read, strand-specific sequencing technologies, optical mapping, and variant discovery algorithms to comprehensively analyze three human parent–child trios to define the full spectrum of human genetic variation in a haplotype-resolved manner. We identify 818,181 indel variants (<50 bp) and 31,599 structural variants (≥50 bp) per human genome, a sevenfold increase in structural variation compared to previous reports, including from the 1000 Genomes Project. We also discovered 156 inversions per genome—most of which previously escaped detection—as well as large unbalanced chromosomal rearrangements. We provide near-complete, haplotype-resolved structural variation for three genomes that can now be used as a gold standard for the scientific community and we make specific recommendations for maximizing structural variation sensitivity for future large-scale genome sequencing studies.
INTRODUCTION
Structural variants (SVs) contribute greater diversity at the nucleotide level between two human genomes than any other form of genetic variation (Conrad et al. 2010; Kidd et al. 2010; Korbel et al. 2007; Sudmant et al. 2015). To date, such variation has been difficult to identify and characterize from the large number of human genomes that have been sequenced using short-read, high-throughput sequencing technologies. The methods to detect SVs in these datasets are dependent, in part, on indirect inferences (e.g., read-depth and discordant read-pair mapping). The limited number of SVs observed directly using split-read approaches (Rausch et al. 2012; Kronenberg et al. 2015; Ye et al. 2009) is constrained by the short length of these sequencing reads. Moreover, while larger copy number variants (CNVs) could be identified using microarray and read-depth approaches, smaller events (<5 kbp) and balanced events, such as inversions, remain poorly ascertained (Sudmant et al. 2015; Chaisson et al. 2015).
One fundamental problem for SV detection from short-read sequencing is inherent to the predominant data type: paired-end sequences of relatively short fragments that are aligned to a consensus reference. The SV detection approach can thus be effective in unique sequences but breaks down within repetitive DNA, which is highly enriched for SVs across multiple size scales (Conrad et al. 2010; Sharp et al. 2005). Another fundamental problem is that most SV discovery methods do not indicate which haplotype background a given SV resides on. Nevertheless, SVs are threefold more likely to associate with a genome-wide association study signal than single-nucleotide variants (SNVs), and larger SVs (>20 kbp) are up to 50-fold more likely to affect the expression of a gene compared to an SNV (Sudmant et al. 2015; Chaisson et al. 2015). Hence, SVs that remain cryptic to current sequencing approaches may represent an important source of disease-causing variation in unsolved Mendelian disorders and a component of the missing heritability in complex disorders (Manolio et al. 2009).
In this study, we sought to comprehensively determine the complete spectrum of human genetic variation in three family trios. To overcome the barriers to SV detection from conventional approaches, we integrated a suite of cutting-edge genomic technologies that, when used collectively, allow SVs to be assessed in a near-complete, haplotype-aware manner in diploid genomes. In addition, we also identified the optimal combination of technologies and algorithms that would maximize sensitivity and specificity for SV detection for future genomic studies.
RESULTS
The goal of this study was to comprehensively discover, sequence-resolve, and phase all non-single-nucleotide variation in a selected number of human genomes. We chose three parent– child trios (mother, father and child) for comprehensive SV discovery: a Han Chinese (CHS) trio (HG00513, HG00512, HG00514), a Puerto Rican (PUR) trio (HG00732, HG00731, HG00733) and a Yoruban (YRI) Nigerian trio (NA19238, NA19239, NA19240). The Han Chinese and Yoruban Nigerian families were representative of low and high genetic diversity genomes, respectively, while the Puerto Rican family was chosen to represent an example of population admixture. The parents of each trio had been previously sequenced as part of the 1000 Genomes Project Phase 3 (1000 Genomes Project Consortium et al. 2012) and the children from each trio have been selected for the development of new human reference genomes (Chaisson et al., 2015). As a result, extensive genomic resources, such as SNV and SV callsets, single-nucleotide polymorphism microarray data, sequence data and fosmid/BAC libraries, have been developed to establish these trios as “gold standards” for SV assessment. We focused primarily on the three children for SV discovery using parental material to assess transmission and confirm phase.
We developed a multi-scale mapping and sequencing strategy using a variety of technologies to detect sequence variation of different types and sizes. To maximize sensitivity, we sequenced each child’s genome to a combined coverage of 223-fold (physical coverage of 582-fold) (Supplemental Table 1), using various short- and long-read technologies (Table 1). We discovered SVs using Illumina (IL) short-read whole-genome sequencing (WGS), 3.5 kbp and 7.5 kbp jumping libraries, long-read sequencing using PacBio® (PB) (Menlo Park, CA) and optical mapping with BioNano Genomics (BNG) (La Jolla, CA). We also applied a series of genomic technologies capable of obtaining long-range phasing and haplotype structure: 10X Chromium (CHRO) (Pleasanton, CA), Illumina synthetic long reads (IL-SLR a.k.a. Moleculo), Hi-C (Lieberman-Aiden et al. 2009), and single-cell/single-strand genome sequencing (Strand-seq) (Falconer et al. 2012) technologies (Table 1; Supplementary Table 1; Supplemental Methods).
Chromosomal level phasing and assembly of genomes
Assembly-based SV discoveries are usually represented as a single haplotype, rather than differentiating the two haplotypes of a diploid cell. This leads to reduced sensitivity for SV detection (Huddleston et al. 2016). We therefore aimed to resolve both haplotypes for the three children in this study by partitioning reads by haplotype and thereby detecting SVs in a haploid-specific manner. We applied WhatsHap (Martin et al. 2016) to IL paired-end, IL-SLR, and PB reads; StrandPhaseR (Porubsky et al. 2017) to Strand-seq data and LongRanger to CHRO data and compared them to more traditional trio-based (Martin et al. 2016) and population-based (Loh et al. 2016) phasing methods. As expected, the observed phased block lengths (Figure 1a) and marker densities (Figure 1b) differed substantially among the platforms but the amount of phasing inconsistencies, as measured by switch error rates (Figure 1c), was found to be very low (from 0.029% for 10X Genomics to 1.4% for Hi-C). Since no single technology alone achieved the density, accuracy, and chromosome-spanning haplotyping necessary to comprehensively identify and assemble SVs throughout the entire human genome (Edge et al. 2017; Ben-Elazar et al. 2016; Porubský et al. 2016), we systematically charted the performance of all possible combinations of technologies. When combining a dense, yet local, technology (such as PB or CHRO) with a chromosome-scale, yet sparse, technology (such as Hi-C or Strand-seq), we obtained dense and global haplotype blocks (Figure 1d,e; Supplementary Material). To verify the correctness of chromosome-spanning haplotypes, we computed the mismatch error rates between the largest block delivered by each combination of technologies and the trio-based phasing (Figure 1f). The combination of Strand-seq and CHRO data showed the lowest mismatch error rate (0.23%), while phasing 96.5% of all heterozygous SNVs as part of the largest, chromosome-spanning haplotype block (Supplementary Table 2). We note that the switch error and mismatch rates are not constant for a given technology, and can be influenced by factors such as sequencing coverage, data processing, and choice of restriction enzyme in the case of Hi-C.

(a) Distribution of phased block lengths for the YRI child, NA19240. Note that Strand-seq haplotypes span whole chromosomes and therefore one block per chromosome is shown. For Illumina paired-end data, phased blocks cover less than 50% of the genome and hence the N50 cannot be computed. (b) Fraction of phase connection, i.e., pairs of consecutive heterozygous variants provided by each technology (averaged over all proband samples). (c) Pairwise comparisons of different phasings; colors encode switch error rates (averaged over all proband samples). For each row, a green box indicates the phasing of an independent technology with best agreement, with corresponding switch error rates given in green. (d) Each phased block is shown in a different color. The largest block is shown in red, i.e., all red regions belong to one block, even though interspaced by white areas (genomic regions where no variants are phased) or disconnected small blocks (different colors). (e) Fraction of heterozygous SNVs in the largest block shown in panel d. (f) Mismatch error rate of largest block compared to trio-based phasing, averaged over all chromosomes of all proband genomes (i.e., the empirical probability that any two heterozygous variants on a chromosome are phased correctly with respect to each other, in contrast to the switch error rate, which relays the probability that any two adjacent heterozygous variants are phased correctly). (*) Not available because trio phasing is used as reference for comparisons. (**) Not shown as population-based phasing does not output block boundaries; refer to the Supplementary Material for an illustration of errors in population-based phasing.
Once chromosomal-level phasing was obtained for each child’s genome, we partitioned the PB reads according to haplotype. On average, 67% of reads could be haplotype-partitioned in each child (Supplementary Table 3). We then developed two complementary approaches to assemble the haplotype-partitioned reads: (1) an extension to the SMRT-SV method (Huddleston et al. 2016) (Phased-SV), which produced a separate assembly for each haplotype, and (2) an extension to the unguided approaches employed in the Pendleton et al. (2016) approach (MsPAC), which combined separate haplotype-specific assemblies with de novo assemblies in autozygous regions (Supplementary Material). The assemblies covered, on average, 92.3% of the euchromatic genome (Supplementary Table 4) and produced contig N50 lengths ranging between 1.29 and 6.94 Mbp (Supplementary Table 5). We then generated a high-quality consensus sequence for both assembled haplotypes (Chin et al. 2013) from which indels and SVs could be systematically discovered by mapping the contigs to the human reference.
In addition to providing a physical framework for phasing of all genetic variants, the parent–child trio data also allowed us to refine meiotic breakpoints. Using Strand-seq data, meiotic breakpoints could be determined to a median resolution of less than 25 kbp (Supplementary Material). The application of trio-aware phasing from PB reads (Garg et al., 2016) further narrowed the median resolution of the meiotic breakpoints to ∼1.5 kbp (Supplementary Table 6). As expected, we observed an excess of maternal meiotic recombination events (Supplementary Material) (Broman et al. 1998; Hou et al. 2013; Kirkness et al. 2013; Lu et al. 2012). Further analysis of fine-mapped meiotic breakpoints showed a significant (p=3.07E-7) enrichment for Alu retrotransposons and a slight increase in abundance for THE1-A,B (p=0.08) repeats, as previously reported (Myers et al. 2008). In addition, we identified an enrichment of a 15-mer motif at the breakpoints similar to the one presented by Myers et al. 2008 (Supplementary Material).
Indel discovery (1–49 bp)
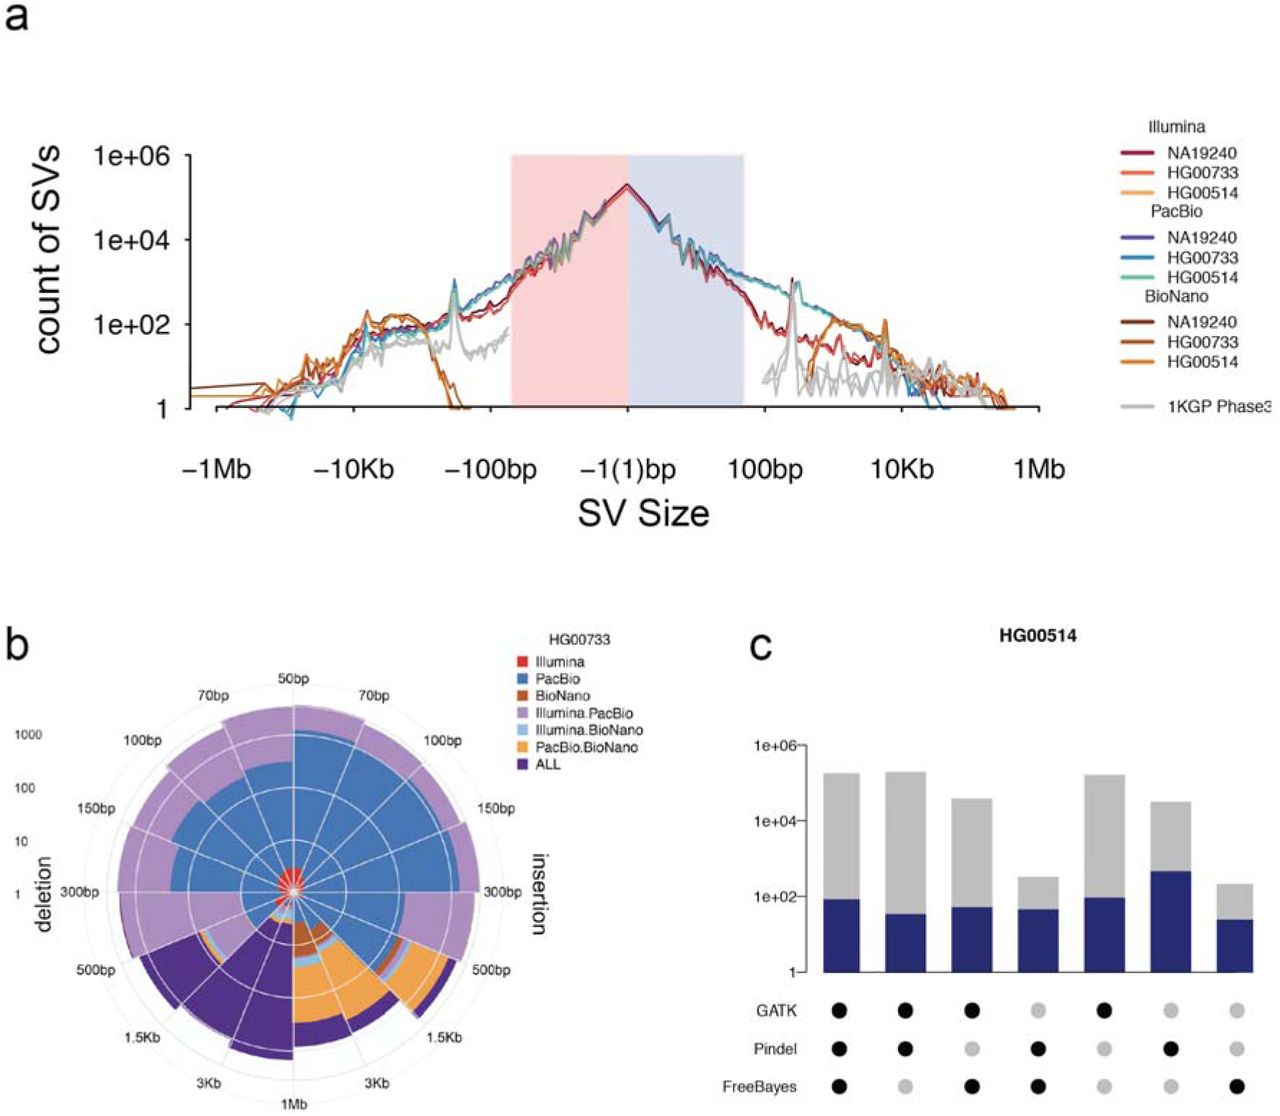
We generated a multi-platform indel callset by merging the IL- and PB-based callsets. Indels were detected in the IL WGS reads using GATK (DePristo et al. 2011), FreeBayes (Garrison and Marth 2012) and Pindel (Ye et al. 2009) algorithms and merged according to 50% reciprocal overlap, yielding on average 698,907 indel variants per child (Supplementary Methods 4.1). To detect indels from the PB data, assembly contigs were mapped to the reference and indels from separate haplotypes were merged with a threshold of 80% overlap. To minimize artifacts from contig consensus errors, results from a single assembly method (Phased-SV) were used, and shorter indels (<10 bp) were filtered if supported by less than four Illumina reads. The IL- and PB-based indel callsets showed similar size-spectrum distributions (Figure 2a) and were merged to yield, on average, 818,181 indels per individual. The unified indel callset showed the predictable 2 bp periodicity owing to the hypermutability of dinucleotide short tandem repeats or STRs (Mills et al. 2006). The PB reads alone lacked the ability to reliably detect 1 bp indels and were not considered in this analysis. However, a greater number of PB indels were discovered for variants greater than 15 bp (12% and 23% additional on average for insertions and deletions, respectively) (Supplementary Table 7). We were able to confirm 89% (529/594) of the homozygous sites (45% of all sites) that overlap with ∼7 Mbp of BACs from the children sequenced and assembled using high-coverage (>400X) PB reads.

(a) Length distribution of PB-SV deletions and insertions (blue), IL-SV (red) and BNG (brown), respectively, together with length distribution of deletions and insertions discovered in the mothers by the 1000 Genomes Project Phase 3 report (silver). (b) Number of SVs discovered by one or multiple sequencing platforms in the PUR child, HG0733. (c) Overlap of Illumina indel discovery algorithms, with total number of SVs found by each combination of Illumina algorithms (gray) and those that overlapped with a PB-Indel (blue) in the CHS child, HG00514.
SV discovery (≥50 bp)
We obtained a unified SV callset for each child from high-coverage IL WGS sequence data, PB reads, and BNG assembly maps. To detect SVs in the IL data, we independently applied 11 CNV and SV calling algorithms: WHAMG, LUMPY, DELLY, dCGH, Genome STRiP, VariationHunter, forestSV, Manta, SVelter, Pindel and novoBreak (Supplementary Table 8). The jumping library sequences were analyzed using a customized pipeline for large-insert WGS (liWGS), Delly, and mobile element insertions (MEI) were discovered using a set of specialized callers designed to detect retrotransposons (MELT, Tardis and retroCNV). Unlike the previous 1000 Genomes Project Phase 3 study, we sought to maximize discovery and did not strictly control for a given false discovery rate, opting to filter calls using orthogonal data in later steps. These callsets were integrated into a unified IL integrated SV (IL-SV) callset (Supplementary Material) resulting in an average of 10,636 IL-SVs per individual: 6,808 deletions, 3,035 insertions and 793 duplications (gain of sequence with source, for a total of 19,080 nonredundant IL-SVs across the three children, consisting of 11,995 deletions, 5,611 insertions, and 1,474 duplications. Approximately half of the SV calls were annotated as high-confidence calls from only a single algorithm (Figure 2).
We generated a second set of SVs for each trio using the haplotype-resolved Phased-SV and MsPAC assemblies generated from the PB long-read sequencing data. Each assembly was mapped to GRCh38, and SVs were detected as insertions, deletions, and inversions within the alignments. After applying a read-based consistency check (Supplementary Material) to remove assembly and alignment artifacts, the SVs from each assembly were merged into a per-individual unified callset (PB-SV). We validated PB-SV calls by searching for evidence of each SV in the long-read sequencing data from each of the parents (Supplementary Material). We determined that 93.9% of homozygous and 95.7% of the heterozygous calls showed transmission consistent with Mendelian inheritance. Excluding inversions, the integrated PB-SV callset consisted of an average of 31,599 PB-SVs per child (12,680 deletions and 18,919 insertions) for a total of 56,285 nonredundant PB-SVs across the three children, comprising 23,736 nonredundant deletions and 32,549 nonredundant insertions. Most of the increase in sensitivity (threefold) from the PB-SV callset relative to IL-SV appears to result from better access to intermediate-sized SVs (50 bp to 500 bp) and improved sequence resolution of insertions across the SV size spectrum. Because many of the SV calls are in tandem repeats where there are degenerate representative alignments, the total SV count is dependent on the particular algorithm and gap penalties used. For example, application of the double-affine gap penalty method NGM-LR (Sedlazeck, F. unpublished) results in a 14% reduction of calls from merged gaps and 5% reduction of bases from merged haplotypes; however, more complex evolutionary models are necessary to determine the most biologically appropriate parameters.
Because a substantial fraction of human genetic variation occurs in regions of segmental duplication (Bailey and Eichler 2006), which are often missing from de novo assemblies (Chaisson et al. 2015), we compared the variation detected in regions of segmental duplication through read-depth to the segmental duplications resolved in the Phased-SV and MsPAC de novo assemblies. The haplotype-specific de novo assemblies resolved only 24.9% (43.6 Mbp/175.4 Mbp) of human segmental duplications. The dCGH and Genome STRiP methods detected variation through changes in read-depth and are sensitive to copy number changes in highly duplicated regions. We determined that 93.8% and 73% of the copy number variable bases detected by dCGH and Genome STRiP, respectively, were not resolved by de novo assembly (Supplementary Material). We also estimated that, on average, ∼341 genes per child had at least one exon affected by a copy number change that was not detected in the de novo assemblies, highlighting the importance of continued read-depth-based CNV detection even when PB long-read-based de novo assemblies are generated.
Characterization of inversions
Polymorphic inversions are ill-defined by human genome sequencing (Redin et al. 2017; Talkowski et al. 2012), in part, because larger events tend to be flanked by virtually identical duplicated sequences that can exceed a million basepairs in length (Kidd et al. 2010). The breakpoints of these inversions, thus, cannot be bridged by mainstream DNA sequencing technology hampering their discovery. Moreover, the copy-neutral nature of basic inversions precludes detection by read-depth analysis. To generate a map of inversions across different length scales, we called inversions with five complementary techniques, including Illumina WGS, liWGS, PacBio, optical mapping and Strand-seq. For Strand-seq, we developed a novel computational approach integrating inversion discovery with phasing data to bolster accuracy (Methods) and retain all calls that displayed haplotype support. A careful comparison of inversion calls revealed that Strand-seq was the only platform that made highly reliable calls on its own, while for the other technologies, acceptable accuracy was achieved only for calls supported by at least two platforms (Figure 3a and Supplemental Tables S6.3.2 and S6.3.3). The unified, nonredundant inversion callset comprised 308 inversions across the nine individuals. Of these, 75% were either primarily identified by Strand-seq (n=173) or received additional Strand-seq genotype support (n=59) (Methods). By comparison, 132 inversions in the unified callset were detected by IL WGS, 130 in PB, 90 in liWGS, and 29 in the BNG data.

(a) Integration of inversions across platforms based on reciprocal overlap. Shown is an example of 5 orthogonal platforms intersecting at a homozygous inversion, with breakpoint ranges and supporting Strand-seq signature illustrated below. (b) Size distribution of inversions included in the unified inversion list, subdivided by technology, with the total inversions (N) contributed by each listed. (c) Classification of Strand-seq inversions based on orthogonal phase support. Illustrative examples of simple (homozygous and heterozygous) and complex (inverted duplication) events are shown. Strand-seq inversions were identified based on read directionality (read count panel; reference reads in grey, inverted reads in purple), the relative ratio of reference to inverted reads within the locus (read ratio panel), and the haplotype structure of the inversion, with phased read data considered in terms of directionality (Ph panel; H1 alleles in red, H2 alleles in blue; alleles from reference reads are displayed above the ideogram and alleles from inverted reads are displayed below). Imn: Illumina. Jmp; Jumping libraries. PB: Pacific Biosciences. Ss: Strand-seq. bN: BioNano SD: segmental duplications. Ph: phase data.
The inversion size spectrum differed markedly among platforms (Figure 3b). Illumina WGS, PacBio, and liWGS excelled in mapping relatively small inversions (<50 kbp), wherever breakpoint junctions could be traversed by DNA sequence reads. Indeed, the smallest inversions (<2 kbp) were only detected by Illumina WGS and PacBio. In contrast, larger inversions (>50 kb) were nearly exclusively detected by Strand-seq. The Strand-seq technique offers the advantage of inversion detection solely by identifying DNA sequence strand switches internal to the inverted sequence, readily identifying inversions flanked by large segmental duplications that can be neither assembled nor traversed using standard DNA sequencing technologies (Sanders et al. 2016). Inversions called by Strand-seq show a median size of 70 kbp (up to 3.9 Mbp in length), in sharp contrast to Illumina-detected events whose median size is 3 kbp (down to 263 bp in length) (Supplementary Table 9). Given that Strand-seq-identified repeat-flanked inversions are largely inaccessible by other technologies, the majority of variable nucleotides mediated by inversions were contributed by this technique alone (64% out of 36.4 Mbp total inverted bases).
Within the unified inversion callset, 73.7% (227/308) represent copy-neutral (i.e., simple) events, whereas 79 are more complex inversions containing embedded copy number variation (most in the form of inverted duplications). Consistent with previous observations that SV-including inversions map within segmental duplications, 50.7% of the inversions have both breakpoints mapping within segmental duplications (115/227), which is an eightfold increase over the non-duplicated regions of the genome. Furthermore, this is biased towards larger inversions with a median of 72.2 kbp compared to a median 3.4 kbp inversion length of inversions with breakpoints outside of segmental duplications. On average, each individual genome shows 121 simple inversions, 66.8% of which are heterozygous and 32.5% homozygous. Chromosomes 7 (3.2%), 8 (3.3%), 16 (5.1%) and X (3.3%) show the highest frequency of inversions, consistent with prior expectation (Sanders et al. 2016) (Sudmant et al. 2015a; M. J. P. Chaisson et al. 2015b). The inverted duplications typically exhibit highly variable copy number states, ranging between 0-10 (mean = 4) copies (Supplementary Table 10), indicating a large source of genetic variability between individuals. For instance, a 260 kbp complex inversion mapping to Chromosome 9 (at ∼40.8–41.1 Mbp) contains between 4-6 copies in each genome. Another notable example is an inverted duplication at the DUSP22 locus (Figure 3c), for which a copy was known to be missing from the human reference (Genovese et al. 2013), and we show it to be in the reverse orientation. Additionally, 40 inversions were found to be homozygous in all nine individuals and likely reflect a minor allele or remaining assembly errors in the human reference (Supplementary Table 11).
Mobile element insertions
Previous SV studies have been unable to resolve the sequences of large repetitive elements in the human genome limiting our ability to assess differences in mutagenic potential between individual genomes. However, since PB long reads were routinely larger than 10 kbp in length, we used the PB-SV callset to investigate not only the location but the sequence content of full-length L1 (FL-L1) elements. We detected an average of 190 FL-L1 elements with two intact open reading frames in the three children (Extended Data Figure 1) (Supplementary Material). Only 124 of these copies are shared across the three genomes (Supplementary Table 12, Supplementary Material). This diversity in source element profiles likely influences L1 mutagenic potential. For example, while all three of the genomes are homozygous for one of the most active retrotransposon source L1 elements associated with human cancers (chr22:28663283; Tubio et al. 2014) and another L1 that is highly active (i.e. “hot”) in the germline and cancers (chr1:118852351; Gardner et al. 2017), each genome also harbors between four and six unique hot L1 source elements. One of the unique hot L1 copies in the PUR individual is the LRE3 element, which is the most active L1 source element in humans (Brouha et al. 2003, 2002). Thirty FL-L1 copies with low-to-moderate levels of activity also are differentially present in the genomes of the three individuals (Supplementary Material). The cumulative differences in L1 mutagenesis that emerge from these diverse FL-L1 profiles suggest that, at a population level, such diversity may translate into differential risk levels for L1-mediated diseases such as cancers and other disorders (Tubio et al. 2014; Scott et al. 2016).
Genotyping novel SVs in population cohorts
One of the advantages of having a more comprehensive set of sequence-resolved SVs is the ability to accurately genotype them in different human populations. We first genotyped SV calls from the base-pair-resolved PB-SV callset in a limited set of 27 high-coverage genomes using a sensitive but computationally intensive method, SMRT-genotyper (Huddleston et al. 2016). An average of 91.7% (26,151) of SVs could be genotyped with this approach across both insertions and deletions (Supplementary Material), with average Mendelian error rates of 12.4% for insertions and 10.0% for deletions. Additionally, the genotypes reflect population structure using principal component analysis (PCA). Low frequency events (<10% allele frequency) increase from 5.6% and 6.0% in the HAN and PUR children, respectively, to 11.4% in the YRI genome, reflecting the increased diversity in the African genome. The number of samples genotyped with this method was insufficient to detect differentiated sites. To account for this, SVs were genotyped in 2,504 low sequencing coverage genomes (Mallick et al. 2016; 1000 Genomes Project Consortium et al. 2015) using Delly (Rausch et al. 2012), which can efficiently genotype both SVs with imprecise breakpoints (e.g., IL-SV) and precise breakpoints (e.g., PB-SV) in low-coverage genomes. With stringent filtering for low genotype quality (<5) and genotyping rate (<25%), the average number of SVs genotyped per child was 8,086 from the IL-SV callset and 7,211 from the PB-SV callset. Each genotyped dataset had an average Mendelian error rate of less than 0.75% when assessed against the parent genomes in the trios and displayed continental population structure through PCA (Supplementary Material). While no SVs showed extreme population stratification (FST > 0.85), there were 269 SVs with moderate differentiation (FST ≥ 0.20). When compared to the SVs detected in the 1000 Genomes Project Phase 3 release, 51% of the genotyped PB-SV calls <500 bp were novel (Mallick et al. 2016; 1000 Genomes Project Consortium et al. 2015a), including moderately differentiated intronic deletions within TRPV5, TMC5 and DISC1 (Supplementary Table 13). This indicates that a substantial fraction of the SVs in the size range where long-read derived de novo assemblies excel in sensitivity can be genotyped even in low-coverage Illumina data.
Functional impact
An important consideration of increased sensitivity afforded by this multi-platform approach is its functional impact with respect to gene structure. Although the number of individuals compared is few, we sought to determine the number of genes that would be modified or disrupted based on the unified callset. On average, each child has 450 indels and 141 SVs predicted to affect protein-coding sequence. The majority of the indel variants (326/450), and 51% (58/113) of the SV variants do not disrupt the open reading frame of the gene. For those gene-disruptive events, we considered the genes intolerance to mutation as measured by the RVIS percentile, which ranks genes from least tolerant of mutation (0%) to most (100%) (Petrovski et al. 2013). The median RVIS percentile of frameshift indels was 85.8%, and deletion SV and insertion SV affecting exons was 91% and 86.8%, respectively, indicating most of the variation is neutral or nearly so and likely of modest effect (Supplementary Tables 15,16). There were no indels uniquely discovered by the PB-indel callset in genes with low RVIS (<20 %). A conservative set of 19 indels in low RVIS genes was formed from single-basepair IL calls, and larger indels in agreement with both IL and PB methods. Nearly three fourths of such variants were observed once, however five genes, AGAP1, CNOT1, PRDM15, SETBP1, WNK1, and ZNF480, had indel variants shared by at least two individuals suggesting they are more common. We also identified 49 genes that were highly intolerant to mutation (RVIS < 5%) but had in-frame indel variation, such as HTT (Supplementary Table 14), and represent potentially unstable triplet repeats. Of these, the PB-indel callset detected variation with eight genes (18%) not detected in the IL callsets, including EPHB6, KLHL17, LRP5, NCOR2, NDST2, RAI1, TNRC6C, and TUBGCP3, representing possible disease variation (Hayes et al. 2000; Bates 2005; Sun et al. 2015) that is difficult to detect in standard IL based studies. As expected, there were few SVs affecting low RVIS genes; two deletions covering exons PRPF6, and HP, and one frameshift tandem duplication in PRKG2 (Supplemental Material).
Variation in UTR sequences can affect gene expression and phenotype, prompting us to overlay our SV dataset with UTRs. Each child had an average of 128 genes with deletions exclusively in either the 5' or 3' UTR and 94 genes with insertions in the 5' or 3' UTR. The variation in UTR sequences was typically in genes more intolerant to variation compared to exonic deletions, with a median RVIS percentile of 54%. For example, there were 14 genes with UTR deletions and RVIS percentile ≤20: DGKD, SON, ATP11A, PHRF1, SNED1, ZNF862, VPS53, DDX46, SLC25A23, FLI1, GLB1L2, LMX1B, IQSEC3, and SEC14L1. The mean length of these UTR deletion variants was 176 bp and is similarly reflected in the technology bias for sensitivity; only one event was detected by BNG, five by IL-SV, and 12 by PB-SV.
504 known canonical genes were overlapped by inversions (Supplementary Table 17), of which 88% have isoforms entirely contained within the inversion (441), and 6% (32) are intronic. The remaining events are potentially gene disrupting, where three events overlap at least one exon (AQPEP, PTPRF, and TSPAN8). Up to 55 genes have at least one isoform that spans one of the breakpoints of the inversion; however, the majority (95%) of these genes reside in segmental duplications where the exact breakpoints of the inversions are difficult to resolve.
We also considered the overlap of SVs with functional noncoding DNA (fnDNA): specifically with 1.07M transcription factor binding sites (TFBS) to test for SVs that may modify expression and 2.86M conserved elements (CE) because functional annotation may be biased away from repeat-rich regions. Deletion variants overlapped an average of 6,010 CEs and 2,276 TFBS in each child. However, small SVs rarely affected fnDNA: the median and average size of SVs that overlapped CEs were 1,861 bp and 23,187 bp, respectively, and the median and average size of SVs that overlapped TFBS were 3,774 bp and 51,390 bp, respectively. While the majority of such large deletions (89.7% of the CE and 95.3% of the TFBS) can be detected by IL-SV, we estimate that 206 CE and 35 TFBS deletions would be missed per child by strict application of short-read sequencing technology. The opposite pattern exists for insertion SVs in fnDNA. While a smaller number of insertion SVs map inside TFBS (an average of 7 per child, with average length 572 bp) and 171 insertion SVs inside CE (average length 356 bp), they were predominantly detected in the PB-SV callset; 95% of TFBS and 72% of CEs affecting SVs were detected only in the PB-SV callset compared to 5% and 9%, respectively, for IL-SV. Variants with imprecise insertion breakpoints, such as the BNG calls, were not considered. Because the fnDNA-affecting insertion SVs must have a breakpoint directly within the fnDNA element, the greater sensitivity is gained by detecting more variants (e.g., the PB-SV callset) as opposed to the larger elements detected by IL-SV.
Platform comparisons and optimal indel and SV detection
The use of orthogonal technologies and various discovery algorithms on the same DNA samples provide an opportunity for a systematic assessment of the performance of individual as well as combinations of approaches for indel and SV detection. While long-read technology generally outperforms IL-based approaches for indel detection by ∼50% for indels ≥15 bp, it is not reliable for single-base deletions even at 40-fold sequence coverage, particularly in homopolymer regions. Benchmarking against the unified-indel dataset, we find that maximum sensitivity for IL indels requires application of three callers, including GATK, FreeBayes and Pindel (which has a higher false positive rate).
The cost and throughput of long-read sequencing makes it currently challenging to apply to large-scale clinical studies. Such studies currently rely on Illumina sequencing, and computational resources limit the number of algorithms used to a smaller set than what was considered here. We, therefore, used a pan-SV callset (union of IL-SV, PB-SV, and BNG) to gauge the sensitivity and specificity of individual and combinations of IL-only algorithms and to provide guidance to studies that rely solely on similar short-insert IL sequencing data. To construct the pan-SV callset, IL-SV insertion/deletion and BNG deletion calls were filtered according to orthogonal support datasets formed from raw PB reads, unfiltered PB-SV calls, and read-depth, defining a call as concordant if it existed in another callset or the support datasets. The concordant IL-SV and BNG calls were merged with the entire PB-SV callset to form the pan-SV callset. Across the entire IL-SV dataset, the deletion concordance was 61.6%, though unaffected by size, while the insertion concordance to the pan-SV callset was 54.3%, decreasing in sensitivity with increased insertion SV length (Supplementary Table 18). The BNG mean concordance rate for deletions was 95.3%, indicating a high specificity but low sensitivity. When considering individual methods, the average concordance for deletion calls ranged from 24.8% to 91.7% with a median of 79.2% (Figure 4a), and for insertion calls ranged from 4.2% to 83.8% (Supplementary Table 18). When compared to the pan-SV callset, the concordant calls from individual algorithms detected 2%-19% of deletion and <1%-9% of insertion SVs.

Results by algorithm shown for (a) the deletion concordance for individual methods, (b) the union of all pairs of methods, and (c) the requirement that more than one caller agree on any call. Individual callers are shown as red points for comparison. Pairs and triples of combinations are in black points. The solid and dashed lines represent the 5% and 10% non-concordance rates (NCR), respectively. The top five combinations of methods in each plot below the 10% NCR, along with the individual plots, are each labeled. (d) Overlap of Illumina SV discovery algorithms, with total number of SVs found by each combination of Illumina algorithms (gray) and those that overlapped with the PB-SV calls (blue) in the YRI child, NA19240. (e) PCA of the genotypes of concordant calls of each method: PC 1 versus 2 (left), PC 2 versus 3 (right).
It has been shown previously that sensitivity for true SV calls (generated from Illumina datasets) can be improved by combining calls from more than one algorithm (Manolio et al. 2009; Mohiyuddin et al. 2015; Mills et al. 2011; Hehir-Kwa et al. 2016). Because it would be computationally burdensome for large-scale WGS studies to run all available algorithms on the same sequencing dataset, we considered all possible combinations (up to three algorithms) and tested two separate conditions: (1) accept all SV calls from the union of two algorithm callsets and (2) accept all SV calls detected in at least two of three algorithms. The first condition is targeting maximal sensitivity, while the latter, specificity. Other combinations of methods (e.g., union of all three) were deemed too low of sensitivity or specificity to consider. We used the non-concordance rate (NCR) (1 - concordance) as a proxy for false discovery rate (FDR). Considering the YRI child, NA19240, there were seven combinations of two methods with an NCR less than 10% (Supplementary Material). The combination of Lumpy, Manta, and SVelter (Supplementary Note) (Figures 4b,c) was overall able to detect 23% of deletions from the pan-SV callset, including 65% of MEI and 7% of simple tandem repeat and variable-number tandem repeat deletions. To detect insertion SVs, no union of methods was below a 10% NCR, and the optimal combination of methods with no more than 20% NCR was VariationHunter and WHAMG. This combination detects 18.5% of all insertion SVs, including 55.0% of MEI and 5.73% of tandem repeats. Twenty-three percent of insertion SVs intersecting exons and UTRs were detected with this combination. Multiple other combinations of algorithms give similar results, and extensive measurements of the sensitivity and specificity of the various combinations are given in Supplemental Table 17. We observed that while no single SV was called by every algorithm tested, there are often sets of algorithms that call similar variants (Figure 4d). This is confirmed by a PCA applied to the genotypes of the integrated callset (Figure 4e).
SUMMARY AND DISCUSSION
This study represents the most comprehensive assessment of structural variation in human genomes to date. We employ multiple state-of-the-art sequencing technologies and methods to capture the full spectrum of genetic variation down to the single-nucleotide level, in a haplotype-aware manner. Our results indicate that for maximum sensitivity related to SV discovery, it is essential to employ more than one complementary technology and SV calling algorithm. The PB long-read, Strand-seq, and CHRO data were combined to generate haplotype-resolved de novo assemblies constructed from phased PB reads. When paired with high-coverage Illumina sequencing and BioNano Genomics SVs, we discovered approximately sevenfold more variation than current high-coverage IL-only WGS datasets (Sudmant et al. 2015); on average, 818,181 indels (1-49 bp) and ∼31,713 SVs, including 114 inversions per person. Consistent with increased genetic diversity among African populations (1000 Genomes Project Consortium et al. 2015b), we observed 17.5% more deletion and 12.8% more insertion variants in the Yoruban child than the Han Chinese child.
The long-read sequence data provided us with an unprecedented view of genetic variation in the human genome. Using ∼15 kbp reads at an average of 40-fold sequence coverage per child, we have been able to span areas of the genome that were previously opaque and discover three to fourfold more structural variation when compared to short-read sequencing platforms. Our analysis suggests that the majority (∼77%) of insertions are being missed by routine short-read calling algorithms. Specifically, the largest gain stems from tandem repeat and retro-transposon insertions in the 50 bp to 2 kbp size range. Inversions represent another problematic class of human genetic variation. In the 1000 Genomes Project, a total of 786 inversions (from 2,504 genomes) were identified with an estimated FDR of 17%. In the current study, we identified a total of 308 inversions from just three family trios, totaling 34.2 Mbp of sequence. This increase in sensitivity depended on the complementary nature of the five different technologies (Figure 3b). In the shorter size range, most of the inversion discovery depends on a combination of IL and PB datasets, whereas for the larger events, Strand-seq was required. As a result, we identified 109 new inversions that were missed as part of the 1000 Genomes Project Phase 3. Surprisingly, most of these are large (>50 kbp) constituting an average of 156 inversions representing up to 22.9 Mbp of inverted DNA per diploid genome, and thus, a 480-fold increase in inverted bases relative to the previous study. Our results indicate that for maximum sensitivity and specificity related to SV discovery it is essential to employ more than one detection algorithm and more than one orthogonal technology.
It is not practical for large-scale studies to detect variation by employing the menagerie of sequencing methods and algorithms used in this study. Instead, these data serve as a guide for the trade-off between the cost of sequencing and desired sensitivity for SV detection. For example, we demonstrated entire chromosomal phasing using the Strand-seq and CHRO libraries; however, the Strand-seq method is not yet as widely implemented in sequencing facilities as Hi-C, which when combined with CHRO libraries provides chromosome-arm phasing and is likely sufficient for many applications. Similarly, with the high-coverage Illumina sequencing and the many algorithms used here, it was possible to detect up to ∼45% of the total number of deletion SVs and ∼22% of insertion SVs. If large-scale studies such as TOPMed (https://www.nhlbi.nih.gov) or CCDG (https://www.genome.gov) were to rely on individual single-paired-end and read-depth algorithms (e.g., Lumpy and Genome STRiP), we estimate the sensitivity to detect deletion SVs outside duplicated portions of the genome would be at most ∼27% with an FDR of ∼30%. Insertion sensitivity would fare far worse with an estimate of ∼3% and an FDR >50%. While the majority of the variants associated with coding regions missed by such an Illumina-based study appear to be neutral in effect, there is a fivefold increase of SVs detected in coding sequences for genes (albeit low RVIS percentile) when including the PB-SV callset. Importantly the addition of PB-SV callset increases sensitivity for genetic variation that could have a more subtle effect on gene expression changes, including a twofold increase in variation in UTR sequences and a 5%-11% increase of SVs detected in CEs and TFBS.
The diagnostic yield in many disease studies is far from complete (Chong et al. 2015). Due to the current cost of long-read sequencing, we propose that future disease studies have a triaged application of multiple technologies to comprehensively identify SVs. Families that have been sequenced using IL-based WGS should be analyzed using intersections of multiple SV calling algorithms (e.g., Lumpy, Manta, and SVelter for deletion detection, and Wham and VariationHunter for insertion detection) to gain a ∼15% increase in sensitivity over individual methods at a decreased FDR. Because a disproportionate amount of variation occurs in segmental duplications, it is additionally necessary to apply read-depth-based methods (e.g., dCGH or Genome STRiP) to detect changes in copy number in highly duplicated regions of the genome. The sequence structure of such variation is still not resolved and novel methods will need to be developed to sequence-resolve such CNVs (Chaisson et al., 2017). Importantly, there is a pressing need to reduce the FDR of SV calling to below the current standard of 5% because forward validation of all potentially pathogenic events will be impractical. We predict that a move forward to full-spectrum SV detection using an integrated approach demonstrated in this study will increase the diagnostic yield in patients with genetic disease, SV-mediated mutation, and repeat expansions. Moreover, the proper application of SV detection for patient care requires a deeper understanding of germline SVs from more individuals across diverse global populations.
DATA RELEASE
Underling sequencing read data from the various platforms can be accessed via the International Genome Sample Resource (IGSR) (Clarke et al. 2017) at http://www.internationalgenome.org/data-portal/data-collection/structural-variation. Indel variant calls will be made available with dbsnp build B151. SV calls are made available under dbvar accession nstd152.
METHODS
In Supplementary Material.
AUTHOR CONTRIBUTIONS
SV Discovery: M.J.P.C., A.D.S., X.Z., A.M., D.P., E.J.G., O.R., L.G., Z.N.K., R.L.C., X.F., R.E.H., F.H., D.A., C.C., S.K.P., A.P., A.B., K.Y.; PacBio assembly and analysis: M.J.P.C., O.R. A.M.W., C.S.C., A.B.; Strand-seq data generation and analysis: A.D.S., D.P., T.M., C.J.S., P.M.L., J.O.K.; Phasing: D.P., Y.Q., V.G., A.N., M.G., S.K., T.M.; Hi-C data generation and analysis: D.G., Y.Q., A.N.; Merging and analysis: M.J.P.C., A.D.S., X.Z., E.J.G., O.R., A.M., T.R., Z.N.K., R.L.C., X.F., P.A., S.C., A.M.W., A.H., X.C., D.A., M.G., B.J.N., S.M., C.S.C., P.M., X.Z.B., E.L., M.X., A.B., K.Y.; Genotyping: M.J.P.C., T.R., Z.N.K., P.A.; Functional analysis: M.J.P.C., D.P., E.J.G., J.W., X.K., C.N., T.G., N.T.C., V.G., X.S.; Validation: A.D.S., R.E.H., F.H., S.C., D.L., A.F., J.Y.K., A.E.W., A.W.; Data production: A.D.S., S.C., A.M.S., K.M.M., C.L.K., Y.Q., E.C., W-P.L., M.R., C.Z., D.C.J.S., W.H.H., J.Y.K., J.E.L., J.F., J.L., S.P.L., K.V.M., G.R.; Data archiving: L.C., S.F., K.M.M.; Group organization: D.M.C., J.K., H.C., X.C., W.X., B.R., L.D., C.L.K., M.B.G., P.F., P.Y.K., P.M.L., G.M., W.X., K.C., J.S., X.S., A.B., K.Y., S.E.D., M.T., T.M., J.O.K., E.E.E., C.L.; Organization of supplementary material: M.J.P.C., X.Z., R.E.M.; Co-chairs: J.O.K., E.E.E., C.L.; Manuscript writing: M.J.P.C., A.D.S., E.J.G., A.M., J.S., S.E.D., M.T., T.M., R.E.M., J.O.K., E.E.E., C.L.; Display items: M.J.P.C., A.D.S., X.Z., E.E.G.,T.M.
Illumina SV co-leads: A.M., R.E.M., PacBio SV co-leads: M.J.P.C., A.B.; Indel lead: K.Y.; Hi-C lead: B.R.

Intact FL-L1 source element profiles for the three children. Chromosome 1 through 22, X, and Y are displayed from left to right. FL-L1s with two intact ORFs are represented by a circle in the color corresponding to the individual. The circle can either be filled or half-filled depending on the genotype in the respective individual. L1 sites with activity documented in the literature are depicted by light purple (highly active or “hot”) or dark purple (low to moderate activity) horizontal lines at the site.
ACKNOWLEDGEMENTS
We thank Nancy Halsema and Karina Wakker-Hoekstra for help with preparing Strand-seq libraries. We also thank the people who generously contributed samples to the 1000 Genomes Project. Funding for this research project by the Human Genome Structural Variation Consortium came from the following grants: National Institutes of Health (NIH) U41HG007497 (to C.L., E.E.E., J.O.K., M.A.B., M.G., S.A.M., R.E.M. and J.S.), NIH R01CA166661 (to S.E.D.), NIH R01HG002898 (to S.E.D.), NIH F31HG009223 (to E.J.G), NIH RO1HG008628 (to G.T.M.), NIH UO1HG006513 (to G.T.M.), NIH 1R21AI117407-01A1 (A.B.), NIH 1R01HG007068-01A1 (to R.E.M.), NIH RO1HG002385 (to E.E.E.), the US National Science Foundation (DGE-1523154 and IIS-1502172 to X.S.), the US Defense Advanced Research Projects Agency (N66001-15-C-4039 to X.S.), the Wellcome Trust grants WT085532 and WT104947/Z/14/Z and the European Molecular Biology Laboratory (to SF, LC, EL, HZ-B), grant UM.0000125/KWJ.HI from the University of Malaya (to CLK), by a National Health and Medical Research Council (NHMRC) CJ Martin Biomedical Fellowship (#1073726) to SC, and an Advanced ERC grant (to P.M.L.). E.E.E. is on the scientific advisory board (SAB) of DNAnexus, Inc. and is a consultant for Kunming University of Science and Technology (KUST) as part of the 1000 China Talent Program. E.E.E. is an investigator of the Howard Hughes Medical Institute. J.O.K. is a European Research Council (ERC) investigator. C.L. was on the scientific advisory board of BioNanoGenomics and is a distinguished Ewha Womans University Professor, supported in part by the Ewha Womans University Research grant of 2016.
Footnotes
REFERENCES


