

Abstract
Phylogenies may be modelled using “birth-death” models for speciation and extinction, but even when a homogeneous rate of diversification is used, survivorship biases can generate remarkable rate heterogeneities through time. One such bias has been termed the “push of the past”, by which the length of time a clade has survived is conditioned on the rate of diversification that happened to pertain at its origin. This creates the illusion of a secular rate slow-down through time that is, rather, a reversion to the mean. Here we model the controls on the push of the past, and the effect it has on clade origination times, and show that it largely depends on underlying extinction rates. Crown group origins tend to become later and more dispersed as the size of the push of the past increases. An extra effect increasing early rates in lineages is also seen in large clades. The push of the past is an important but relatively neglected bias that affects many aspects of diversification patterns, such as diversification spikes after mass extinctions and at the origins of clades; it also influence rates of fossilisation, changes in rates of phenotypic evolution and even molecular clocks.
1 Introduction
The patterns of diversity through time have been of continuous interest ever since they were broadly recognized in the 19th century (e.g. [1]). In particular, both major radiations (such as the origin of animals [2]) or angiosperms [3]) and the great mass extinctions (e.g. the end-Permian [4] or end-Cretaceous [5] [6]) have attracted much attention, with an emphasis on trying to understand the causal mechanisms behind these very striking patterns. However, in the midst of this search, the effect of survival biases on creating the patterns under consideration has not been considered as fully as it could have been. The last decades have also seen a great deal of interest and work on mathematical approaches to diversification and extinction (e.g. [7] [8] [9] [10] [11]), including some that touch on the topics considered by this paper (for example, see especially [12] [13] [14] and [15]), but there is relatively little literature on the dynamics of clade origins from the perspective of survival biases and their effect on the fossil record. In this paper, then, we wish to explore the basis for such bias and then consider how it is exported to various important aspects of the observed large scale patterns of evolution, with particular focus on the sort of data that can be extracted from the fossil record. In the following analyses, we calculate over an interval of 0.1myrs and plot graphs with an interval of 2myrs.
2 The "push of the past"
Nee and colleagues [16] [17]) summarised the general mathematics of birth-death models as applied to phylogenetic diversification (see also especially [14]). In such models, each lineage has a certain chance of either disappearing ("death") or splitting into two ("birth") per unit time. Most models that consider diversity in this way have used a constant birth and death rate which have revealed much of interest about phylogenetic processes [ [18] [19]]. More sophisticated models have incorporated varying rates of birth and death or allowed speciation to be spread over time [20] or used a diversity-dependent extinction rate in an attempt to produce more realistic models that can be tested against the fossil record and reconstructed molecular phylogenies [21] [11].
The existence of rapid diversification events in the fossil record has been documented or inferred on many occasions and in many clades (e.g. [22] [5] [23] [24] [25] [26] [27]). These patterns have been cited as evidence for qualitatively differing regimes of diversification during special intervals of earth history (e.g. the Cambrian explosion [28] or radiations after mass extinctions [29]). This in turn has lead to proposals of various models to explain these patterns (either intrinsic to the evolutionary process (e.g. [30]) or extrinsic, such as changes in the environment (e.g. [31]). Moreover, associated macroevolutionary phenomena such as the early appearance of the body plans of the extant phyla or other groups and their subsequent relative stasis afterwards have also attracted much interest and attempts at explanation (e.g. [32] [33] [34]). However, even though constant-rate birth-death models look fairly simple on the surface, they can generate surprising statistical patterns caused by often overlooked biases.
[16] identified one of these biases that they nicknamed "the push of the past", a nod towards another bias called the "pull of the recent" which is based on the very high "preservation rate" of the Recent compared to the fossil record [35]. Clades with a recent origin have had less time to go extinct and are thus more diverse than one would expect. Controversy over the size and detection of the pull of the present in molecular phylogenies has led to various modifications of the simple birth-death model (see e.g. discussion in [11]; but see also [36] [37] [38] [39]). To avoid confusion between the two, [20] renamed the phylogenetic effect "the pull of the present". Here we use the acronyms PoTPa and PoTPr to refer to these two effects.). In this paper we are primarily concerned with what happens before the present is reached, but would note that the problems of comparing modern day lineages with fossil species may be part of these problems (c.f. [40] [14]).
The POTPa emerges as a feature of diversification by the fact that all modern clades (tautologically) survived until the present day. This singles them out from the total population of clades that could be generated from any particular pair of birth and death rates: clades that happened by chance to start off with higher net rates of diversification have better-than-average chances of surviving until the present day. As Nee et al. ([41]) put it, such clades "get off to a flying start". Once clades become established, they are less vulnerable to random changes in the actual diversification rate, and this value therefore tends to revert to the mean through time. Long-lived clades thus tend to show high effective rates of diversification at their origin, which then decrease to their long-term average as the Recent is approached (c.f. [42]). A similar effect should apply to now extinct clades that nevertheless survived a substantial length of time. This effect is analogous to the "weak anthropic principle", which contends that only a certain subset of possible universes, i.e. those with particular initial conditions, could generate universes in which humans could evolve in order to experience them. Similarly, to ask the question why living clades appear to originate with bursts of diversification that then moderate through time is to miss the point that this pattern is a necessary condition for (most) clades to survive until the present day.
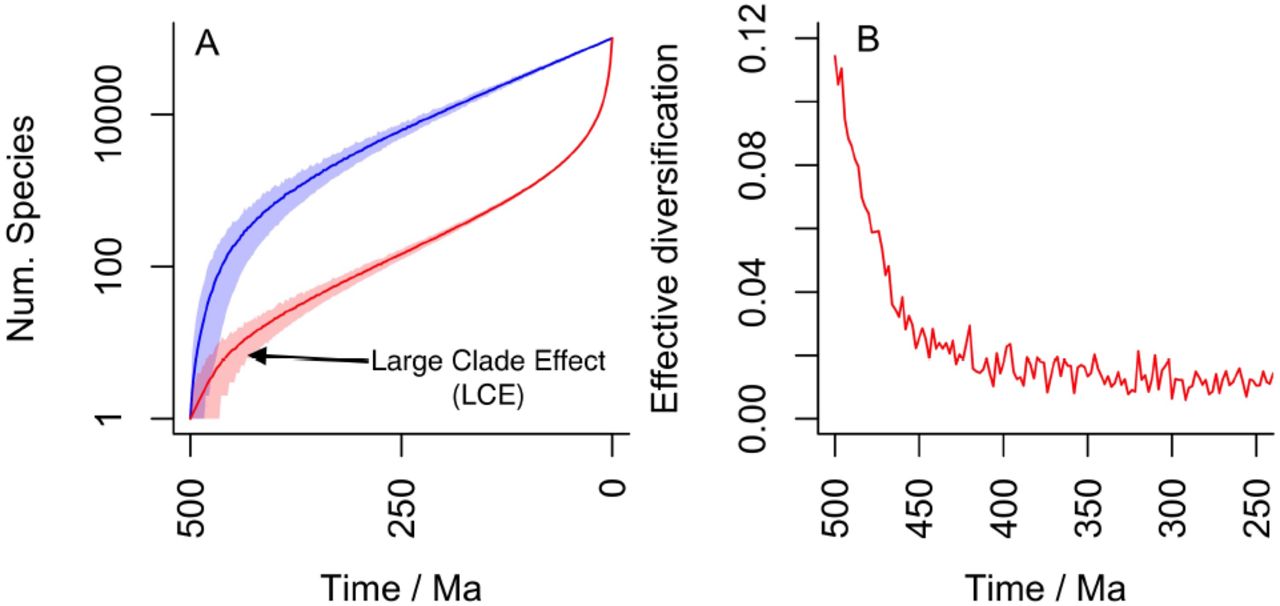
Conversely, the "pull of the present" is an effect seen in the number of lineages through time that will eventually give rise to living species, which is effectively what is being reconstructed with molecular phylogenies. As the present is approached, the number of lineages leading to recent diversity must increase faster than the overall rate of diversification because less time is available for any particular lineage to go extinct. Thus, the POTPa affects reconstructions of diversity through time; and the POTPr affects the number of ancestral lineages through time (Fig. 1A).
Although the POTPa is known about (e.g. [43] [14]), emerges naturally from conditioning clade survival to the present in diversification simulations and has even been examined in some detail in a few cases [44] [42], it has had surprisingly little penetration into especially the palaeontological literature. In this paper we therefore wish to show how important an effect it is, and discuss its implications for general discussions about the reasons behind typical patterns of diversification seen in the fossil record.
A typical sort of question one might address to the fossil record, for example, is when modern (i.e. crown) groups are likely to emerge [45]. Raup [46] showed many years ago that under a birth-death model, the last common ancestor of any two living organisms is likely to lie deep in the past. In the context of modern systematics, we would like to ask the related question; given the emergence of a total group, what conditions govern the emergence of the extant crown-group from it? A previous attempt at tackling this problem by simulations showed that as the rate of diversification increases, crown-groups tend to emerge earlier and earlier, so that stem-groups become shorter and shorter [45]. Given the definitional requirement for crown groups to survive until the present day, this pattern becomes entangled with the POTPa. Here we build on this previous effort [45], and capture these patterns analytically, as follows.
3 Mathematical analysis
In this section we extend on the approach of Nee et al. by explicitly conditioning the birth-death model on the number of extant species in the crown group. We also extend the work of Raup, by developing a fully probabilistic calculation of the distribution of crown group origins, that allows for both stochastic variation in the number of speciations and extinctions in any unit of time, and incorporating the selection-bias of the ‘pull of the present’ as a result of examining surviving clades. Raup as it stands is a fully deterministic model that does not allow any effective rate changes through time and thus cannot allow for survivorship biases.
3.1 Estimating the number of extant and surviving clades through time
As noted by previous studies [16] [47], in the classic birth-death model with speciation rate per species and extinction rate per species µ, the number of extant species, nt in a surviving clade at a given time t from the origin at time zero, obeys the following zero-truncated geometric probability distribution
 with
with

It is also useful to introduce the survival probability, s Δt: the probability that a lineage with one originating species will survive for a duration of time Δt,

For the limiting case where λ- µ → 0, see [47]. Nee et. al proceeded by conditioning the distribution of nt on the tree surviving until some future time, T. Here instead we move towards the theory of Raup by conditioning on there being nT extant species at time T. By Bayes’ rule:

Two terms in this equation are given immediately from equation 1. We can evaluate the remaining term, P (nT | nt), by recognising nT as a sum of mt i.i.d. geometric random variables obeying equation 1 over a time period T-t, where mt is the (unknown) number of species at time t that will give rise to surviving lineages. This implies that P (nT | mt) follows a truncated negative binomial distribution (with nT taking a minimum value of mt):

The number of lineages that survive depends on the probability, sT-t for a lineage to survive from time t to time T, and follows a binomial distribution:

Combining the previous equations, and summing over the unknown value of mt, we are left with the following expression for the number of living species at time t, conditioned on the number of species in the present:

where the relevant probability mass functions are as defined above. We can further evaluate the conditional probability of mt – the number of species at time t which will have at least one descendant at time T. Here we integrate over possible values of nt:

By looking at a small interval of time Δt from the origin and considering both the probability that the clade has diversified to two species in this interval and the probability that it will survive to the present, we can estimate the initial effective rate of diversification for surviving clades:

where we have assumed that sT-Δt ≃sT for small Δ t. It follows that the initial rate of diversification, R0, in the POTPa can be estimated by:

If we look back to the origins of major clades, we expect sT to be small for geologically significant periods of time, and thus for these examples the rate can be further approximated as,

(we note that similar results concerning the interior branch lengths of reconstructed trees have been derived by [13]). Since every new surviving lineage begins a new tree with one original species, this logic implies that along any surviving lineage, the rate of speciation is always similarly determined by the probability of survival to the present and is always greater than λ A notable feature is that in the Recent, as the survival probability sT tends to one, the rate of speciation declines back towards λ As the survival rate remains low for long periods of a radiation, it follows that the constant renewal of the surviving stem lineages follows a quasi-fractal pattern of repetition.
At what rate do these speciations give rise to additional surviving lineages? Consider the probability that, after a speciation from an initial state of nt = 1 to nt+ Δt = 2, both lines go on to survive, conditioned on knowing that at least one does. Since survival of both implies survival of at least one, we have:

This implies that along each stem group, i.e., between the creation of each new lineage, there will on average be [(2 - sT-t)/sT-t] - 1 plesions (i.e. extinct lineages: See Fig. 3 below). Since new speciations happen at a rate (2 - sT-t), the total time taken along the stem will be, on average, 1/(λsT-t). Equivalently the rate at which new lineages are created is λsT-t, which for large values of T - t is approximately - µ, i.e. the baseline rate of diversification. In the Recent, as the survival probability tends to one, the rate of new lineage creation will increase to λ the baseline speciation rate, since all new species will be expected to survive to the present.
An example plot displaying the various parameters that govern this analysis is given in Fig. 1A. (c.f. [16]). This plot is for a clade that has 10,000 living species/lineages; which emerged about 500 million years ago, and which has an average lineage duration of 2 million years (i.e. µ = 0.5). The blue line gives the number of species at any particular time; and the slope of the blue line is effective diversification rate governed by the time elapsed and total number of taxa at the Recent, nT. Conversely, the red line gives the number of lineages that gave rise to living species/lineages. We take as the rate of speciation the maximum likelihood estimate of, given µ, T and nT, which in this case is 0.5107. Thus the rate of diversification (λ- µ) is c. 0.0107 per species per million years. As can be seen, the slopes of the two lines diverge at the beginning, representing the push of the past, and at the end, representing the pull of the present, both of which are large in this case. If there had been a deterministic radiation of species from the Cambrian onwards with the net diversification rate of 0.0107 species per species per million years, then instead of 10,000 there would have been only about 210 species of this taxon today. Fig 1B shows the implied large spike in the initial effective diversification rate, owing to the POTPa, with the initial effective diversification rate (~ 1) being 100 times the underlying average. Note also that this effect generates a (non-causal) correlation between diversity and diversification rate (Fig. 1C): as diversity increases, (average) rate of diversification decreases.

An example diversification with 10,000 living species, an extinction rate of 0.5 per species per million years and a diversification time of 500 Myrs. The implied speciation rate is 0.5107 per species per million years and thus the underlying diversification rate is 0.0107 per species per million years. A Diversity plot through time. As in all other figures, the blue line is the number of species at time t and the red line the number of species that will give rise to living species. Shading gives 95% confidence areas. Note large POTPa and POTPr. B Effective diversification rate at beginning of diversification (note scale of 100 Myrs). C Implied diversification rate correlation with diversity generated by this distribution.
3.2 Crown group origins
If the number of species at time T is known (nT), and if the number of clades that will survive at time t is also known (mt), we can calculate the probability, W (t), that two randomly chosen species in the Recent will have a common ancestor at time t. This is the definition of a “randomly selected" crown group used by Raup [46]. We first need to pick the first species at random (with probability one), then we need to pick a second species that has the same ancestor at time t - this must first be one of the nT - mt remaining species that do not inevitably have to join up with the other mt - 1 ancestor species, and then a randomly selected species from this remaining set will have a 1/mt probability of sharing an ancestor with the first selected, thus:

Accounting for the uncertainty in our knowledge of mt, our estimate of W (t) requires a posterior-weighted summation over the possible values of mt:

where the posterior distribution on mt is calculated as above. W (t) represents a cumulative distribution function for the timing of crown group origins for randomly selected pairs of species, looking backwards in time. The corresponding probability density function, w(t), is given by differentiation of W (t):

The depth of origin of random pairs of taxa is what Raup was attempting to model, but our model smears out the timing of origin of crown groups as defined in this way because of the effect of the POTPr of allowing a longer period of lower early lineage diversification rates, which Raup neglected (i.e. Raup’s model is more akin to the Yule process). Nevertheless, it remains true that under "normal" conditions, randomly-selected pairs of taxa will also tend to have early origins (Fig. 4F,I). As can be seen (Fig. 4C), the Yule process forces crown-groups defined in this way to emerge very early. Budd & Jackson [45] simulated the origin of the first crown groups in clades conditioned on survival (c.f. [42]). It is also possible to capture this result analytically. In simulations that start with one lineage and go on to diversify to the Recent, the time the simulation begins can be taken as the origin of the total group, and the emergence of the crown group (for the entire clade) when mt (the number of lineages at any time t that will give rise to living descendants) is equal to two (i.e. the basal split of the crown group is formed). Since this state can only be reached from a previous state of mt = 1, the probability density u(t) that the first crown emerges at time t can therefore by calculated by considering the rate of change in the probability that mt = 1:

As summarised in [16] and Fig. 1A, we can see that mt in the early stages of diversification essentially depends on λ- µ: mt ≃ exp([ λ- µ]t). Thus a simple approximation for the expected length of time it takes for the first crown-group to emerge is given by:

Thus tcg, the time in millions of years ago that the first crown group is expected to have emerged is simply

where T is the time elapsed since the origin of the total group. As an interesting aside, the underlying diversification rate α- µ is thus approximated by:

This relation broadly holds for positive diversification rates until approaching the neutral model (λ = µ), where it breaks down, as when observing extant clades, the crown groups must have emerged before the present time. Budd and Jackson [45] found by simulation that neutral models tended to have crown-group emergence at about 0.5 of total group time, indicating that the broadening of time of emergence of crown groups seen in Fig. 3 eventually leads to a very uniform distribution.
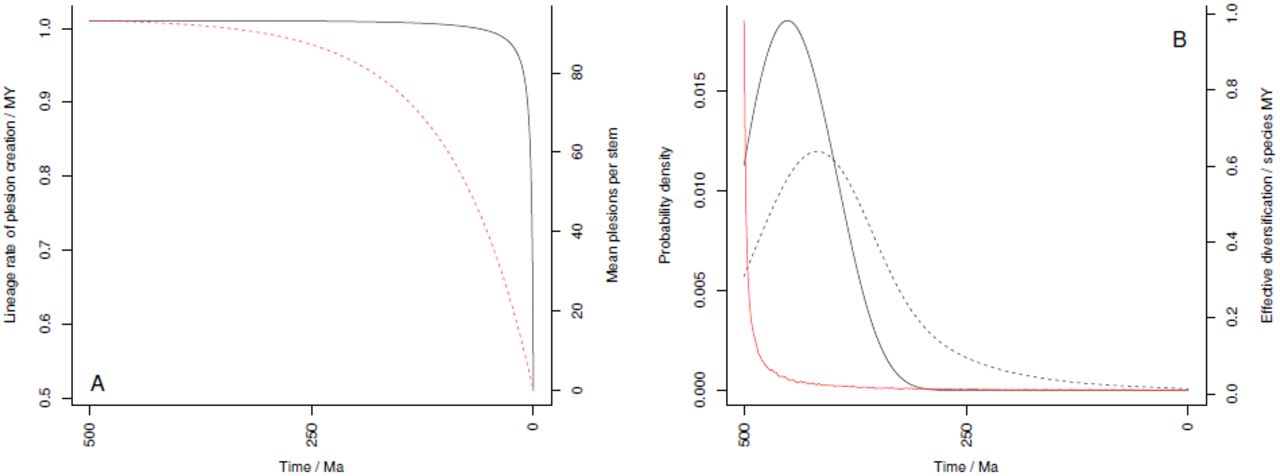
The combination of the POTPa and the dependence of tcg on λ- µ means that stem and crown groups exhibit different characteristics of diversification and diversity, as the first crown group tends to emerge as the effect of the POTPa fades away. An example of this is given in Fig. 2B.

A Illustration of the rate of plesion creation along the surviving lineages (black solid line) and the mean number of plesions created along each stem group (red dashed line) through time. As rate of plesion creation is almost flat for most of the time, it follows that the decline in number of plesions per stem group depends on the stem groups decreasing in size temporally. B Effective diversification rate (red) and probability density functions of the first crown group (black, solid) and origin times for pairs of random living species (black, dashed) against time. All plots for a diversification over 500myrs in total, nT = 10, 000, λ= 0.51 and µ = 0.5 (i.e. the same example as Fig. 1). Note the likely emergence of the first crown group as the POTPa decays.
4 The push of the past and the fossil record
4.1 Overview
Within a particular total group, then, stem groups are characterised by high effective diversification rates and low diversity; and crown groups by low diversification rates and increasing diversity (c.f. Fig. 1C). The interaction between the crown group and the POTPa allows us to understand why it is that the crown group emerges just as the POTPa dies away. Clades in this view are analogous to K and r strategists. A large clade with many lineages has a inherent high rate of survival (i.e. like a K-strategist) as extinction requires loss of all of them. Conversely, small clades (like r-strategists) have inherently low rates of survival as they are vulnerable to small fluctuations. Hence, the survival of at least one of them is (in retrospect) guaranteed by having very many of them. The emergence of the crown group thus corresponds to a switch from the r to the K modes of survival.
It is important to note that the high rates of diversification in stem groups are not general features, as we are applying a homogeneous model of diversification. Rather, unusually high diversification rates are concentrated in the stem lineage that leads to the crown group(s) (c.f. [13]. Stem groups should thus generate a high number of plesions(i.e. extinct sister groups to the crown group [48] [49]) which themselves will diversify and go extinct at the background rate governed by λ- µ. From equation 10 we can see that the rate of speciation along most of the stem lineages, and thus the rate of production of plesions, remains close to 2 λ although the rate slowly declines until close to the Recent,when it precipitously drops to. Similarly, lengths of stem-groups also decrease, over a longer timescale, as the present is reached (see Fig. 2A for graphical treatment).
This analysis gives us a remarkable perspective on the fossil record (Fig. 3), which is after all made up entirely of plesions (Budd 2003). Average rates of speciation (and, as we shall argue below, rates of phenotypic evolution) typify the clouds of plesions that are constantly being generated (and dissipating) at a high rate; but underlying them, and hidden from view (as taxa in cladograms are only ever terminals) are stem lineages that speciate at twice the normal rate. It is only briefly, at the beginnings of radiations and after the great mass extinctions (see below) that these obscuring clouds are stripped away, and we get to peer at the underlying hyperactive stem lineages. Once again though it must be stressed that this pattern only emerges as a result of our perspective in the Recent, which allows us to distinguish stem lineages from plesions.

A small section of a tree at a time distant from the present. Red branches represent lineages that survived until the Present, and where they diverge represents the birth of a new crown group. Green branches represent plesions that do not survive until the present. As per the results presented herein and in [13], the stem lineages species generate plesions at a rate close to 2 and the plesions themselves speciate at rate λ: the crown groups form at rate λ- µ.
4.2 Diversification scenarios
Armed with the mathematical analysis and example above, we are now in a position to analyse various scenarios that might play out in patterns of diversity and the fossil record. In each, we wish to examine: i) the size of the POTPa effect; ii) the distribution of the timing of crown group origins and iii) the relative proportions that the stem and crown groups take up of the total group.
4.3 The Yule process
The Yule process [50] governs diversification processes with the assumption that no extinction takes place, i.e. that µ = 0. Of course this is not realistic, especially over geologically-significant time periods, but nevertheless is important to show the contrast between this and more realistic models. Furthermore, it can be used to model surviving lineages through time, that have no extinction.
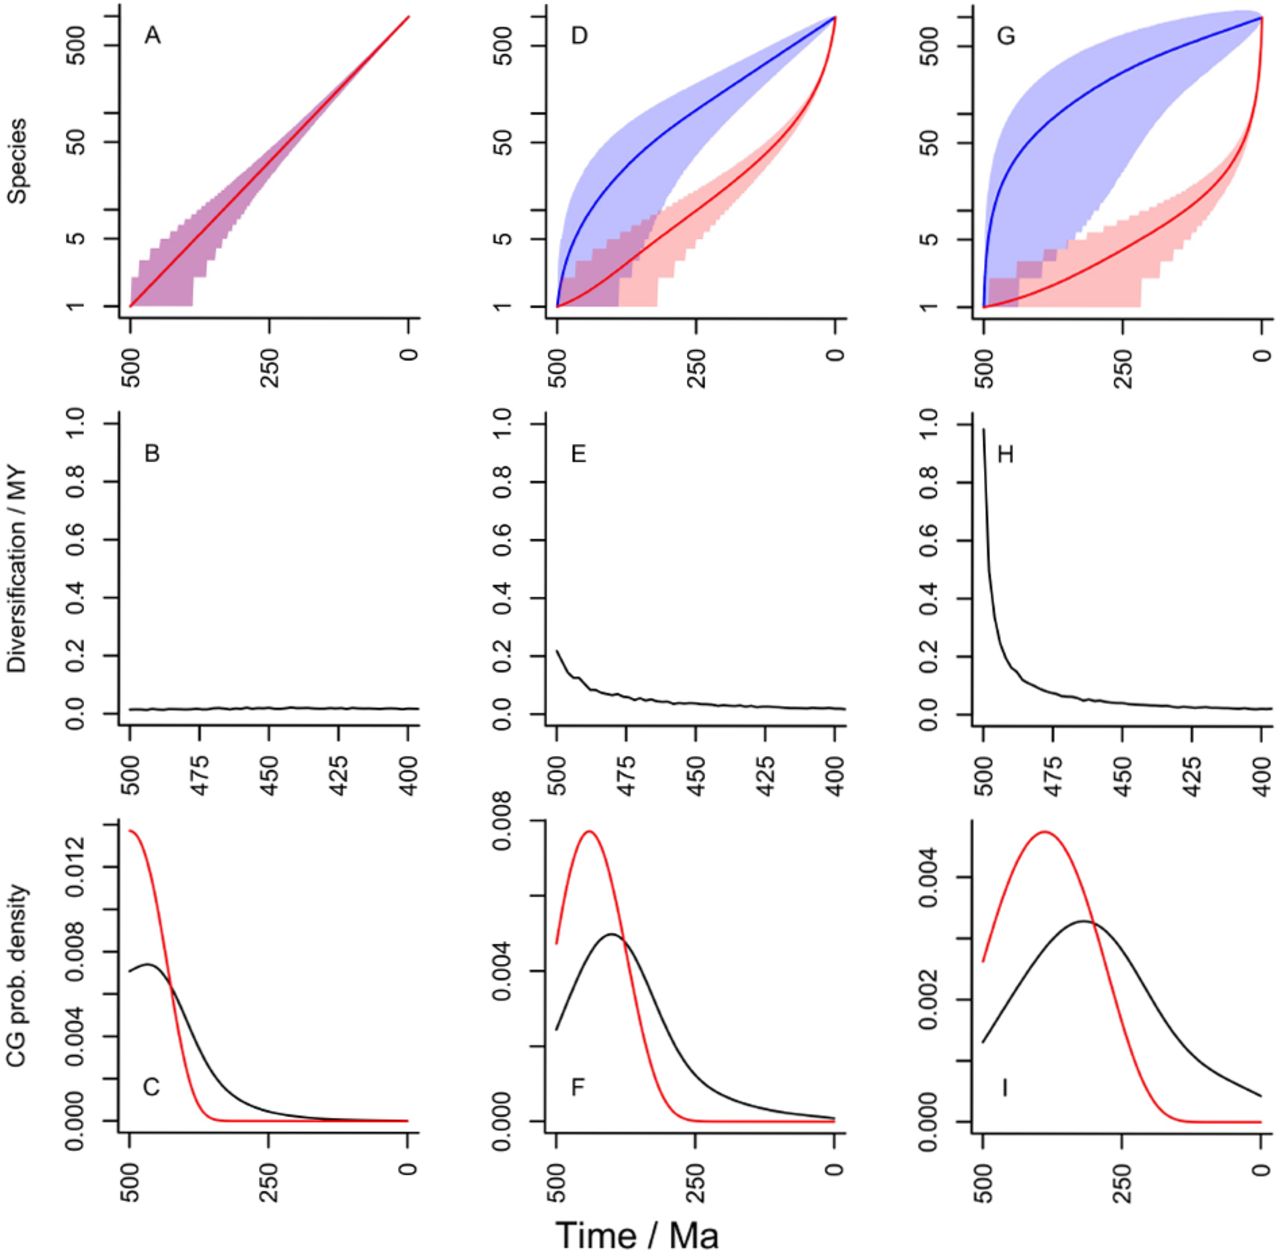
Under the no-extinction model, as all species give rise to living lineages, it is clear that the blue and red lines of Fig. 1 are coincident (Fig. 4A) irrespective of the error on each. There is neither a pull of the recent nor a push of the past (Fig. 4B), and the slope of the line simply gives the diversification rate through the time required to lead to the observed nT. In the example, the rate of diversification is completely constant along the mean, since the diversification rate has been selected to generate nT (ie 1000 species in this case). Nonetheless, as the confidence region shows, especially early fluctuations in this process are possible, which we consider further later. A deterministic Yule model is effectively the model used by Raup [46]. Another obvious feature of the no-extinction model is that total and crown groups are effectively coincident for any particular clade, as stem-groups grow by extinction [51]. A short lag at the beginning is possible though, before the first speciation event takes place.

Patterns of diversification and stem- and crown-group formation for different (constant) diversification parameters. For each column T= 500Myrs and nT = 1000. All rates given per species per million years. Shading gives 95% confidence areas. Row one gives plots of diversity and diversity that gives rise to extant species through time; row two gives effective average diversification rates through time over the first 100Myrs (ie. the POTPa effect); row three gives probability density function plots for the appearance of the first crown group (red) and for crown groups defined by random pairs of living species. A-C: Yule process with µ = 0 and λ= 0.014. D-F: low µ net diversification with µ = 0.1 and λ= 0.109. G-I: high µ net diversification with µ = 0.5 and λ= 0.505. Note different time scale on second row.
4.4 Models with net diversification and extinction
Fig. 4D-F and G-I model two net diversification models; one with µ = 0.1 and the other with µ = 0.5, both with the best-fit implied λ (the maximum-likelihood value given T, nT and the selected value of µ). As can be seen, increasing µ increases the POTPa.
If µ is set very low (e.g. µ = 0.01 for T = 500 Myrs and nT = 1000), then the POTPa can be much reduced. However, such models imply very implausible species longevities (a typical species would be expected to survive 100 Myrs in this model, numbers that are not realistic for the Phanerozoic (they may, however, be more appropriate to the Proterozoic ([52]).
Fig. 4G-I is very close to the pattern that would be seen with the neutral model, which was of great historical importance in modelling patterns of diversity in the fossil record: it was the basis of the famous MBL model [53] [54]. In the neutral model, and µ have the same value, but can vary together if the model is conditioned on nT and T. In other words, it is possible to have neutral models with high turnover (λ and µ are both high) or low turnover (λ and µ are both low).
In non-Yule processes such as these, because there is now extinction to be considered, and thus a POTPa, it follows that there must be "unlucky" clades that had a neutral or even negative effective diversification rate close to their origin, and these clades will not on balance have survived. For example, if one looks over a 250 million year interval with an average species survivorship of 2 million years (ie µ = 0.5), then only about 1 percent of all clades actually survive; when µ is 0.1, about 4 percent do (see equation 3). Thus, the neutral model tends to be highly selective towards clades that happened to have high diversification rates early in their history [14]. Indeed, the POTPa generally has the paradoxical effect of making high extinction rates increase effective rates of diversification and numbers of living species - in clades that managed to survive.
4.5 The "Copernican" nature of Birth-Death models
The various cases we have considered above show that the POTPa is in general a very important factor that cannot be neglected in trying to understand diversity patterns of the past. The most important control on the size of the POTPa is the extinction rate (compare Figs 4E and 4H) although time to the Recent also has some effect. Thus, when significant time periods have passed, the POTPa is always large unless the background extinction rate is extremely low (cf. [14])- much lower than seems to be typical for at least Phanerozoic taxa, which typically have a life time of a few million years ([55]).
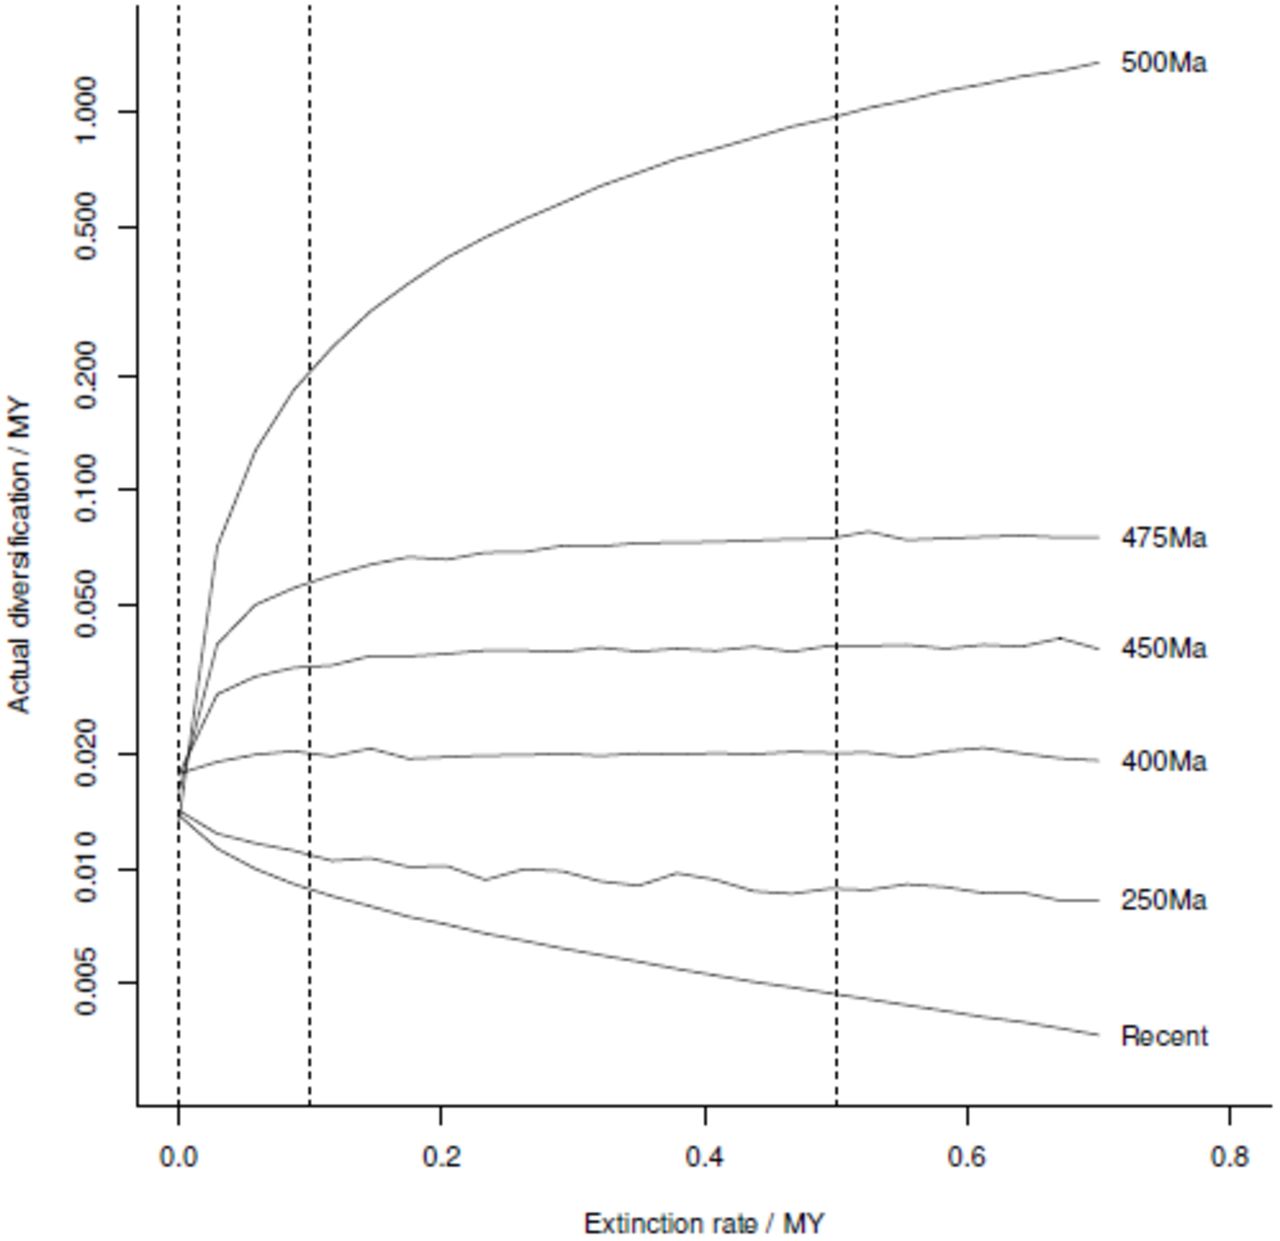
We have summarised the various effects of the POTPa in Fig. 5, by showing the effective rate of diversification plotted against extinction rate for different times in a diversification taking 500Myrs. Note that almost all of the POTPa is confined to about the first 25Myrs - after this early interval, all the curves flatten out as diversification rates revert to their long-term average (note the log scale on the y-axis).

Effective diversification rate versus background extinction rate (µ) at different times during 500Myrs radiations to the present. Different radiations can be summarised by taking vertical sections at different background µ. The three vertical lines shown indicate the three radiations shown in Fig. 4.
Our modelling of different scenarios shows that different initial conditions generate effects that pull in two different directions. Clades or scenarios that have low extinction rates very successfully generate survivors, but not very many of them. Conversely, high-extinction rate clades generate large numbers of survivors, but they do not survive very often. This differential survivorship can be seen in a plot of expected initial diversification rate as a function of survival time for different rates of extinction. A high POTPa is required in order for clades with high rates of extinction to survive the first few million years (Fig. 6). Conversely, once a clade has escaped this danger zone and diversified sufficiently, it becomes very difficult to eliminate it (c.f. [56]), which is why the expected survival times flatten in this figure.

Expected effective initial diversification rate as a function of clade survival time for different values of underlying extinction rate, µ in a neutral model. As µ increases, a bigger and bigger POTPa is required to ensure the clade survives the first few million years.
Because of the nature of the homogeneous model we are using, we wish to stress its ‘Copernican’ aspect, i.e. that diversification is on average the same at all times. Each stem lineage will be characterised by a high POTPa, but as diversification continues, its distorting effect on average diversification rates in surviving lineages will be diminished by two factors. The first (which is small until the POTPr is reached) is that as time advances, each lineage has less time to survive until the present. The second is that as diversification proceeds, more average or even below average diversification-rate lineages will be present, and thus the overall average rate of diversification will be swamped by their diversification rates. In the first stem group, so few lineages are present that the implied POTPa on the stem lineage will have a disproportionate effect on average diversification rates. Such controls produce the characteristic decline in average actual diversification rates through time, even though an observer at any particular time would not notice any difference whatsoever.
5 Mass extinctions
We have chosen for simplicity a diversification model that is diversity-independent and has homogeneous rates of extinction both through time and for taxon-age (c.f. [57]). Nevertheless, the handful of mass extinctions through time have had a large impact on diversification patterns. The most important are perhaps the end-Permian (with c. 96% of all species going extinct [4] and the end-Cretaceous (c. 75% loss [58]). Such events could be considered, as simply "resetting the clock" - i.e., if evidence exists that extinction was extremely severe in a particular clade, then T should be considered to restart at that point. Some overall patterns of diversification suggest that the only truly important mass extinction in this regard is the end-Permian one [55] - see below, which divides Phanerozoic time more or less into two, with large POTPa, but largely uncommented, effects at the beginning of each. One interesting effect is that the bigger a mass extinction, the bigger the subsequent POTPa would be, assuming something survives to the present. Even so, these big pushes can never make up for the lost diversity, even if they compensate for it to some extent. For example, for a diversification that started 500Ma, and that would have generated 1000 living species without any disturbance, and with a background extinction rate of 0.5 (and implied maximum-likelihood speciation rate of 0.504), a mass extinction 250Ma down to only one species and the subsequent POTPa and re-radiation would only generate 240 living species - it is a rerun of the original radiation but in half the time. On the other hand, without any POTPa, this re-radiation would be expected to generate only 3 living species.
It is possible to model the POTPa with a standing diversity, and show how the size of the POTPa declines as surviving diversity increases. We modelled this by plotting number of survivors against immediate effective diversification rate post-extinction (Fig. 6) for different rates of background extinction for a radiation that took 250Myrs to generate 1000 species. As can be seen, extinctions can indeed generate large POTPa, but the number of remaining species for the clade needs to be reduced to a few percent of their original numbers. Thus, large POTPa effects after a mass extinctions are likely to be contingent on large extinctions preceding them in the clade in question.

The impact of number of remaining species on a post-extinction POTPa on a clade that had diversified for 250Myrs to generate 1000 species, assuming clade survival to the present, with baseline diversification λ- µ = 0.01. The curves from bottom to top represent background extinction rates of µ = 0 (Yule process), 0.1, 0.2, 0.3, 0.4 and 0.5 per species per million years.
6 Timing of major clade origins
It should be stressed as a result of the above that although it is possible in principle to model any sort of crown- or stem-group length, in practice the most extreme examples are rare. For the three cases presented in Fig. 4, the probability of survival to the Recent is 1 (Yule process); 0.082 (low µ net diversification) and 0.010 (high µ net diversification). Similarly, in contrast to the idea that major radiations can have long and low-diversity cryptic "fuses" (e.g. [59]), our modelling of crown-group origins suggest they emerge when they do because this is typically soon after the total group did. To take the Cambrian explosion as an example, the apparent high rates of diversification of at least arthropods in the initial phases [60] imply that the total group of animals only emerged a short time before, and similar arguments can be applied to the animals as a whole. One way of escaping this view would be to claim that the bilaterian animals, allegedly like the Ediacarans that preceded them, underwent a mass extinction at the end of the Ediacaran period before rebounding. The strength of the apparent POTPa in the Cambrian [61] [60] however suggests this would have to be of enormous effect, potentially indistinguishable from a true origin close to this time. At the very least, the idea of the bilaterians waiting in the shadows of the Ediacarans before emerging after the latter went extinct seems unlikely.
7 Diversification spikes in the fossil record: macroevolutionary consequences
An initial burst of diversification at the base of major (ie long lived) clades appears to be an inevitable effect of the selection bias that is required in order to allow clades to survive until the present day (or any other significant period of time). A corollary of this little-appreciated fact is that such diversity spikes do not require a special macroevolutionary explanation, for example, that the bases of clades per se have special ecological or developmental features (for example) that drive them. This observation is however, not to make the claim that diversification takes place without a cause. If one could investigate the origins of a clade, one might be able to understand the reasons why those particular members of a clade happened to diversify.
However, the converse pattern of the POTPa is that there should be members of clades that did not experience unusually high initial levels of diversification, and it was precisely these members that did not go on to found living clades. Given that (from our calculations) the POTPa is not instantaneous but is rather spread over some millions of years, it may be possible to examine differential diversification rates amongst those members that ultimately survived and those that did not [12]. Thus, the view of Gould that there is no difference between such taxa in, say, the Cambrian [62] is open to empirical examination. If apparent diversification bursts are simply down to the POTPa, then one would expect that if one could observe all diversification and extinction going on during that time, one would not see anything particularly "special" about the rates overall. Conversely, whilst we would predict that the ultimate non-survivors would indeed show lower diversification rates, it might also be the case that they too show increased diversification rates compared to the implied long-term average, implying a true macroevolutionary effect. Thus, a clear view of the effects of the POTPa is necessary to distinguish true macroevolutionary effects (such as diversity dependent diversification [42]) from survivorship bias.
8 Mass extinctions revisited: the POTPa and preservation potential
As noted above, another clear effect of the POTPa is to generate diversification spikes after mass extinctions (see e.g. [61] [63], [55]). Like original radiations, these two are not (necessarily) generated by special conditions that generally pertain after mass extinctions (such as them emptying of niches), but a necessary condition for initially low-diversity surviving clades to survive until the present. Nevertheless, the POPTa definitionally only applies to clades that survive, to the present or at least some time. Conversely, diversification spikes after mass extinctions can be recognised on the basis of raw counts in the fossil record [64] [61]. Some of this pattern may be based on interest bias towards extant clades (i.e. particular interest in the evolutionary history of living groups such as the bivalves might conceivably bias collection effort towards such clades).
However, another POTPa-like bias may also be having an effect, which is the effect of the POTPa on fossilization rates themselves. One of the controls on the preservation probability of a taxon is its true (as opposed to fossil record) temporal duration, and thus its effective extinction rate ([65]; [66]). When diversity drops to a low level, survivorship over the next short interval of time is compromised, with the implication that only taxa that experience unusually high rates of diversification are likely to survive - and thus enter the fossil record. Fig. 4 shows there is a strong relationship between survivorship on a million or sub-million year scale and diversification rates. In brief: taxa straight after a mass extinction or at the beginning of a radiation have an unusually poor chance of entering the fossil record, as their diversity is so low and their chance of almost instant extinction is so high. However, the taxa that by chance experience high rates of early diversification are much more likely to survive long enough to generate a discoverable fossil record. Such an effect may at least partly lie behind the observation that fossilization rates seem to be depressed after mass extinctions (notably the end-Permian [67]). Thus, one interesting aspect to this pattern in the record, that such "recoveries" seem to be delayed, with clades sometimes taking millions of years to show increased rates of diversification (see e.g discussion in [55]), may be partly explicable by this effect too: early survivors are simply such low diversity that they tend to go extinct faster than they can enter the fossil record.
Despite our calculations showing that living clades should have started off with a POTPa, not all clades appear to exhibit such a pattern when examined in the fossil record. For example, Hopkins and Smith ([68]) studied patterns of diversification in post-Palaeozoic echinoids and concluded that they showed a series of diversification peaks throughout their history, which were not concentrated at the origin of the clade; the patterns observed, moreover, differed considerably at different scales. Nevertheless, such a pattern, which shows at least large peaks at the opening of the Jurassic and Caenozoic, may be conditioned on the large mass extinctions just before each. It is worth noting, further, that the POTPa model has as a background hypothesis that extinction and origination rates are not actually significantly different at these times. Given that the POTPa affects clades with reasonable survival, it may thus be that the entire fossil record of a well-preservable clade like the echinoids might be capturing some of this true rate of diversification.
9 Lineage effects: an analogy to the POTPa in large clades
Our exploration of the POTPa shows that, when conditioned on survival, it remains nearly constant at along the surviving lineages at close to 2λ until close to the Recent. Hence, it largely cannot account for long-term declines in phenotypic, lineage diversification or molecular rates (see below). However, the model can also be conditioned on the number of survivors, nT, and thus it is possible to examine the outliers in homogeneous birth-death models too [14], which tend to have long tails (being exponential). For example, we recalculated Fig. 1, and conditioned it to generate 100,000 instead of 10,000 species (Fig. 8). Under such rare conditions, more species need to be generated than normal, and the most likely moment to do this (as can be seen in the confidence regions of Fig. 1A) is at the beginning, when overall numbers of lineages are small.
A Diversification when an exceptionally large clade is generated with the parameters of Fig. 1 (here, 10x larger than expected). An early lineage effect is introduced as this is where fluctuation in actual rates is most likely. B Calculated decline of lineage rate (thus in red) through time. Note that it lasts considerably longer than the POTPa although is of smaller effect (here initially c. 10x the background rate of λ- µ). The variations are owing to Monte Carlo numerical integration of equation 8, because of low overlap between the prior distribution and likelihood function for mt.
Under such circumstances, a lineage effect is produced, which could be called the large clade effect (LCE). Although it is smaller than the classical POTPa, it has the effect of speeding up the appearance of new living lineages near the beginning, and thus makes crown groups emerge (even) earlier. Like the POTPa, it has a quasi-fractal organisation. The lineage curve takes on a characteristic inverted "S" shape that is often seen in plots of molecular evolution (e.g. [11] [69]). As we discuss below, this effect thus influences rates of evolution in large clades, and will be particularly prominent if such clades have happened to attract more than average attention, as has indeed been suggested [14].
Although the effect is small unless the clade is large, it should be noted that a randomly chosen species is likely to be in a larger-than-average clade, and thus there is a consistent, if small, bias towards this effect appearing. In our example, an effect of about 3(λ- µ) is present with a clade size of 30,000.
9.1 Rates of phenotypic change
The rate of phenotypic change through time is another pattern that has seen a great deal of interest (e.g. [70]; [33]; [60] [71] [72] [73]; but see also [74]). A classical pattern of rates of phenotypic change is that rates are elevated at the origin of a clade and then show an exponential decline (e.g. [32]). Such a pattern looks, of course, like a POTPa effect, but this effect would seem to rely on a correlation between rates of phenotypic change and diversification. Whilst this seems both intuitively reasonable and has much theoretical backing, this pattern has been difficult to demonstrate and indeed some studies have failed to reveal it (e.g. [68]; [75]; but see also [76] who review the topic in general).
In our model, the fossil record consists of plesions that are generated by a rapid rate of speciation in an underlying but unseen stem lineage. In principal at least, each of these speciation events (at least as recognised in the fossil record) should be accompanied by a set of diagnostic synapomorphies that accumulate within the stem lineage twice as fast as they do in the plesions that arise from it. Averaging over all lineages (i.e. the rapid stems and the average plesions) should give a characteristic decline through time similar to that of diversification rates (see e.g. fig 3D of [60]). The notable study of lungfish evolution through time by Lloyd et al. [77] reconstructed rates of phenotypic evolution through time and indeed noted such a decline (see their Fig. 4; note that it also shows a characteristic post-extinction spike). However, as the authors note, the (reconstructed) stem lineage leading up to the extant lungfish retains high rates of phenotypic change much later than the initial rapid decline in overall rates, whilst the plesions appear to show no such pattern (the authors do not differentiate between the two in their analysis of the decline in rates). This pattern is exactly what the model we develop here would predict, as it confines the POTPa to the stem lineages, and suggests that their documented decline of phenotypic rates of evolution is a striking consequence of of the POTPa (compare their Fig. 1 with our Fig. 3). Clearly, it would be possible to test this pattern in other groups too.
As well as the POTPa, the LCE also generates an effect on rates of phenotypic evolution, because it imposes an extra high rate on the lineages at the beginning which would then decline. This may be noticeable in the important recent study on rates of evolution in the arthropods [60] that shows a lineage-rate decline. Thus in large clades, one would expect to see both effects, which would have both more change across the entire clade and faster rates at the beginning.
9.2 The POTPa and molecular clocks
Finally, and perhaps most controversially, these influences may also affect molecular clock estimates of clade divergence times. Various studies have shown that rates of molecular change are at least loosely correlated with diversification rates (e.g. [78]; [79]; [80]; [81];[82]). Whilst apparently not universal (e.g. [83]), such a linkage, for whatever reason,would also create a POTPa effect in molecular clocks: early branches would tend to accumulate change faster than the long-term average because they would also tend to have net higher speciation rates. Such a pattern has indeed been noted ([84]; [60], once again with an overall pattern strikingly similar to a POTPa effect ([60], their fig 3A but see also [85], who failed to find such an effect in a study of explosive radiations on islands). Whilst such correlations are typically weak, the large size of the POTPa may indeed generate enough of an effect to be noticeable.
Rates of molecular evolution are strictly a lineage effect, and in our model, as these all keep broadly similar (but high) rates until near the present, there should be no POTPa slow-down visible (averaging over existing lineages will not create any change through time, unlike the case with rates of phenotypic change which can have extinct branches). However, the LCE preferentially influences the early parts of diversification, and this would create a slow-down through time, with the effect of making molecular clocks overestimate origination times. Such an effect could in principle account for the continuing discrepancy between molecular clock estimates for the origin of the animals and the fossil record, for example [60] (but only in large clades, such as the arthropods [60] - and, of course, the animals themselves).
10 The end of the POTPa
As the Recent is closely approached, plesions that would normally have little chance of surviving until today start rather suddenly to do so. As a result, the average rate of speciation in living lineages drops quickly towards the background level λ of until as the present is reached, all species become living lineages. One way of thinking about this is to consider that the ordering effect of the POTPa relies on having information what the future holds. As the present approaches however, our knowledge about the future becomes shrouded in uncertainty, and our more complete knowledge about the past is of no help in predicti ng what will happen in the future: as a result, the POTPa effects dissipate.
11 Summary
In this paper we have explored the patterns of diversification that can be generated by a retrospective view of a purely homogeneous process of diversification. These patterns can be substantial and highly non-homogeneous, and it is essential to understand these "null" hypotheses before considering causal explanations for any residuals (c.f. [13]. Patterns of diversification throughout time have been much discussed in the literature (e.g. [68]), with a common pattern being seen that diversification rates are high at the beginning of major evolutionary radiations. Various mechanisms for such an effect have been proposed (such as filling empty ecological niches or unusual or flexible developmental evolution). The question that the analysis above poses is, however: are such patterns purely down to the "push of the past"? We have shown that the POTPa is strongest when background extinction rates are high, and that in likely scenarios for the evolution of large clades, it eventually accounts for nearly all of modern diversity. Furthermore, the POTPa impacts other many aspects of diversification dynamics, including recovery from mass extinctions. Indeed, the universality of such processes extends beyond evolutionary biology, with similar patterns being observed, for instance, in the size- or age-dependent growth of companies (see e.g. [86] and references therein). Even under homogeneous models, large clades can be generated at the edge of likely distributions that possess another characteristic, the "large clade effect", which generates distinctive patterns in phenotypic and molecular evolution.
Harvey et al. (1994) [17], when briefly describing the POTPa, commented that "If these statistical effects are not fully appreciated, it could be tempting to misinterpret such a higher early slope as evidence for lineage birth rates being higher, and/or lineage death rates being lower, at earlier times” (p. 526). Here we have attempted to quantify both the size of, and controls on this effect, and to show just how important it in patterns of changes of rates of evolution through time including: dependency of rates of diversification on diversity; initial bursts of diversification at the origin of clades and the effects of mass extinctions. Although it seems natural to take the history and diversification of large and ultimately successful clades such as the arthropods as proxies for evolutionary radiations as a whole (e.g. [87] [60]), our analysis shows this to be particularly fraught with difficulties: the history of life was written by the victors.
References


