

Abstract
Wetland ecosystems are important reservoirs of biodiversity and significantly contribute to emissions of the greenhouse gases CO2, N2O and CH4. High anthropogenic nitrogen (N) inputs from agriculture and fossil fuel combustion have been recognized as a severe threat to biodiversity and ecosystem functioning such as control of greenhouse gas emissions. Therefore it is important to understand how increased N input into pristine wetlands affects the composition and activity of micro-organisms, especially in interaction with dominant wetland plants. In a series of incubations analyzed over 90 days, we disentangle the effects of N fertilization on the microbial community in bulk soil and the rhizosphere of Juncus acutiflorus, a common and abundant graminoid wetland plant. We observed an increase in greenhouse gas emissions when N is increased in incubations with J. acutiflorus, changing the system from a greenhouse gas sink to a source. Using 16S rRNA amplicon sequencing and metagenomics, we determined that the bacterial orders Opitutales, Subgroup-6 Acidobacteria and Sphingobacteriales significantly responded to high N availability and we hypothesize that these groups are contributing to the increased greenhouse gas emissions. These results indicated that increased N input leads to shifts in microbial activity within the rhizosphere, severely altering N cycling dynamics. Our study provides a framework for connecting environmental conditions of wetland bulk and rhizosphere soil to the structure and metabolic output of microbial communities.
Introduction
Wetlands are globally impacted by agricultural industry through the leaching of various nitrogen (N) forms such as nitrate (NO3−), and by increased N deposition as a result of high N emissions from fossil fuel burning and agriculture [Galloway et al., 2008]. Furthermore, due to reduced oxidation under stagnant, waterlogged conditions, these systems show increased availability of ammonium (NH4+) (Britto and Kronzucker, 2002). The strongly increased anthropogenic N input influences ecosystem degradation by contributing to biodiversity loss and altering (mostly increasing) greenhouse gas fluxes such as nitrous oxide (N2O), methane (CH4) and carbon dioxide (CO2) (Bobbink et al., 1998; Liu and Greaver, 2009]; Van den Heuvel et al., 2011; Soons et al., 2016).
The abundance, composition and activity of micro-organisms strongly influence the biogeochemical cycling of wetland nutrients, particularly those resulting in emissions of greenhouse gases (Lamers et al., 2012; Philippot et al., 2009). Specifically, N2O emission may increase due to lowering of pH affecting the activity of incomplete denitrifiers (Brenzinger et al., 2015; Van den Heuvel et al., 2011; Liu and Greaver, 2009). CH4 emissions can increase due to competitive inhibition of the key enzyme of aerobic methanotrophs, methane monooxygenase (MMO), by elevated NH4+, osmotic stress of methanotrophs, or through the stimulation of methanogenic archaea (King and Schnell, 1998; Bodelier and Laanbroek, 2004; Dunfield and Knowles, 1995). Finally, the rate of soil C loss can increase as a result of N addition through the stimulation of heterotrophic respiration (Bragazza et al., 2006). Although it is well established that microbial processes are important drivers of ecosystem functions, such as controls on greenhouse gas emissions and nutrient cycling, there is a lack of understanding of how these functions are linked, both to the environmental conditions and to the composition of the microbial community (Philippot et al., 2009).
Wetland plant roots influence the soil region surrounding the root, known as the rhizosphere, by altering the availability of oxygen, organic matter, and organic plant exudates (Smith and Delaune, 1984; Abou Seada and Ottow, 1985; Bardgett and van der Putten, 2014). The total area of soil influenced by roots can be considerable, meaning that this definition of the rhizosphere may extend to the vast majority of the upper soil layer (Robinson et al., 2003). The rhizosphere is an active, complex ecosystem where viruses, bacteria, archaea, fungi and protozoa interact with plant roots (Fierer et al., 2007b). These microorganisms significantly contribute to nutrient cycling and ecosystem structure by channeling energy into higher trophic levels (reviewed in Curl & Harper 1990; Hinsinger et al. 2009).
While the rhizosphere has been studied for decades, the effects of eutrophication on the plant-microbe interactions are of more recent interest. Specifically, it is of interest how N availability influence plant physiology and ultimately C and N cycling in the rhizosphere. On the global scale, soil microbial communities differ depending on the regional and local N regime; although, the diversity of these communities does not seem to vary much (Fierer et al., 2012). Interestingly, variation in microbial community composition seems to be predictable based on local nutrient regimes (Leff et al., 2015; Ramirez et al., 2012). Even though these studies demonstrate the link between nutrient loading and community structure, they do not demonstrate how changes in the microbial community are functionally relevant to the ecosystem.
To build dynamic models of plant-microbe interactions, it is necessary to gain a robust understanding of the connection between environmental conditions (i.e., N availability) and microbial community structure and function (i.e., the bulk biological processes resulting in greenhouse gas emissions). In this study, we aimed at assessing the impact of increased N input into wetland systems on therhizosphere microbial community and its functions related to greenhouse gas production. To achieve this, we used Juncus acutiflorus (Sharp-flowered Rush), a very common graminoid plant in European wetlands that forms a dense vegetation and is known for radial oxygen loss from roots (ROL; Lamers et al. 2012). Furthermore, it has a high tolerance for increased N inputs (van Diggelen et al., 2016).In a longitudinal study we determined greenhouse gas emissions increase as a result of N addition in incubations with J. acutiflorus, but not in incubations with only bulk wetland soil, under controlled stable experimental conditions. Additionally, functional responses were linked to shifts in the dominant members of the microbial community. We hypothesize that certain key microbial groups contribute to greenhouse gas emissions, either directly or indirectly through the food web. Our study takes the first steps toward a predictive understanding of microbial dynamics within the rhizosphere, linking nutrient load, microbial community structure and function.
Materials and Methods
Sample Collection and experimental set up
Plants and sandy soil were sampled from the Ravenvennen (51.4399 N, 6.1961 E) in Limburg, The Netherlands (August, 2015) and returned to the Radboud University greenhouse facilities for conditioning. The Ravenvennen is a protected marshy area consisting of sandy soil, rich in vegetation with a high prevalence of Juncus spp. Plants were removed from soil, rhizomes were cut into eight 2 cm fragments and reconditioned on hydroculture in a nutrient rich medium (as described in Hoagland & Arnon 1950). After sufficient root development (to approximately 25 cm after 2 weeks), eight plants and eight bulk soil incubations were randomly assigned to high or low nitrogen experimental groups (Supplementary table 1; Supplementary figure 1). Soil collected from the field, was homogenized and sieved to remove any contaminating roots and potted. The reconditioned plants were transferred to pots with a diameter of 19 cm at the base, 26 cm at the top and a height of 19 cm containing the prepared soil, moved to an indoor water bath set to 15 ° C (cryostat, NESLAB, Thermoflex 1400, Breda, The Netherlands) and cultivated with a day/night cycle of 16 hours light and 8 hours dark (Master Son-T PiaPlus, Philips, Eindhoven, The Netherlands). Pots were kept waterlogged with a 2 cm water layer on top. A drip-percolation based system ensured a constant supply of nutrients. The low N input nutrient solution contained 12.5 μM NH4NO3, corresponding to an N loading rate of 40 kg N ha−1 yr−1. The high N input solution contained 250 μM NH4NO3, corresponding to 800 kg N ha−1 yr−1. These rates fall within N loading of wetlands in agricultural catchments, thus represent contrasting extremes (Verhoeven et al., 2006).
Incubation measurements
Five representative J. acutiflorus specimens were harvested for initial measurements of plant dry weight, C:N ratios. At the final time point (Tf = 90 days), all plants were harvested to measure dry weight and C:N ratios of roots, shoots and rhizomes. Pore water was extracted using 0.15 μm porous soil moisture samplers (SMS rhizons, Rhizosphere Research Products, Wageningen, The Netherlands) and measured over the course of the experiment to determine inorganic nutrients as well as metals using an Autoanalyzer (Autoanalyzer 3, Bran+Luebbe, Germany) and ICP-OES (iCAP6000, Thermo Scientific,Waltham, MA). To reduce the impact of soil heterogeneity, samples were extracted in duplicate and mean values were calculated.
Greenhouse gas measurements
To determine greenhouse gas fluxes, a cylindrical transparent collection chamber (7.5 x 30cm) was used to measure accumulation or depletion of CO2, CH4 and N2O in the headspace. CO2 and CH4 fluxes were measured at Tm (45 days) and Tf and N2O fluxes were measured at Tf. Fluxes were measured using a Picarro G2308 NIRS-CRD greenhouse gas analyzer (Picarro Inc., Santa Clara, CA, USA). Fluxes were determined by fitting a smoothed spline to the time series using the R function sm.spline from the pspline package and the average rate of change was calculated (Ramsay et al., 1997).
Denitrification potential
To measure denitrification potential, two soil slurries were made from each experimental pot by mixing 50g soil with 100mL milliQ water, divided into control and experimental bottles and made anoxic by flushing with argon gas. Bottles were pre-incubated overnight at 15°C to allow for residual unlabeled NO3− to be consumed. A 15N-labeled NaNO3 solution was added to the experimental bottles to a final concentration of 500 μM and a KCl solution was added to the control bottles to a final concentration of 500 μM. Production of N2O and N2 were measured by taking samples 2, 7 and 22 h after adding substrate on a GC-MS (5975C, Agilent Technologies, Santa Clara, USA).
DNA extraction, 16S rRNA Amplicon and Metagenomic sequencing
Soil was collected from three time points, one initial soil sample from the site, and Tm and Tf samples from each of the 16 incubations. A single core per pot was taken using a 1x7cm corer. DNA was extracted using the PowerSoil DNA Isolation Kit (MoBio, Carlsbad, CA, U.S.A.). 16S rRNA genes were amplified in triplicate reactions using IonTorrent sequencing adapter-barcoded primers 341F (CCATCTCATCCCTGCGTGTCTCCGACTCAGxxxxxxxxxxGATCCTACGGGNGGCWGCAG) and 785R (CCACTACGCCTCCGCTTTCCTCTCTATGGGCAGTCGGTGATGACTACHVGGGTATCTAA TCC) and pooled. The pooled amplicons were cleaned with Ampure beads (Beckman Coulter Inc., Fullerton, USA) and subsequently prepared for sequencing on the IonTorrent PGM using the manufacturer’s instructions (Life Technologies, Inc., Carlsbad, CA, USA).
From the same DNA samples, total DNA was sheared into approximately 400 bp fragments via sonication. Resulting fragments were prepared for sequencing following the manufacturer’s instructions with the Ion Plus Fragment Library Kit (Life technologies, Carlsbad, CA). Raw reads were submitted to NCBI and archived under the SRA accession number SRP099838.
Data analysis
16S rRNA gene amplicons were quality filtered using QIIME v1.9 (Caporaso et al., 2010). Quality controlled reads were then clustered into OTUs at a 97% identify and phylogenetically classified by utilizing the NINJA-OPS v1.3 pipeline (Al-Ghalith et al., 2016). The reference database used for taxonomic assignment was the SILVA database version 123 (Quast et al., 2013). The resulting OTU table was used for downstream analysis in R (R Core Team, 2016). Count data was normalized to relative abundances to account for differing sequence depth between samples and a square root transformation was applied. The vegan R package was used to calculate Shannon diversity with the diversity function, Bray-Curtis dissimilarity matrices with the vegdist function, and to estimate compositional variance with the betadisper function (Oksanen et al., 2015). Principal component analysis (PCA) was performed using the princomp function in R. The RandomForest R package was used for classification and regression (Liaw and Wiener, 2002). Linear models were fit with the glm function in the stats package. Metagenomic reads were quality filtered (Q > 25) and small fragments (< 100bp) were removed using PrinSeq (Schmieder and Edwards, 2011).
The metagenomic reads were compared to custom nitrogen and methane cycling protein databases and the NCBI nr databases with Diamond (Buchfink et al., 2014; Lüke et al., 2016). A bit score ratio (BSR) between the hit to the custom databases and to the NCBI nr database was used to identify false positives hits. A strict BSR of 0.85 was used as a cutoff. Gene abundances were normalized and expressed relative to the single copy RNA polymerase rpoB gene abundance. These relative values were then scaled for comparison within genes. Reads from all metagenomes were assembled using metaSPAdes (version 3.7; Bankevich et al. 2012) and resulting contigs were compared against all publicly available Bacteroidetes, Acidobacteria and Verrucomicrobia genomes in the NCBI database using Blastn. Furthermore, contigs were assessed for the presence of N or CH4 cycling genes by comparing them with Diamond to the previously mentioned N and CH4 cycling custom databases.
Results
Plant physiology
J. acutiflorus and bulk soil were incubated over a course of 90 days. The soil collected from the sampling site and used in the incubations was a sandy soil with low organic matter content. Soil samples were taken at an initial time point (T0), a mid-point (Tm; t= 45 days) and final time point (Tf; t= 90 days) (Supplementary Table 1). By Tm, J. acutiflorus incubations had significant root development throughout the incubated soil, and as a result the rhizosphere was sufficiently sampled such that the soil sampled was clearly dominated by root biomass. To determine the N utilization of the plants and to identify growth responses to N inputs, the total dry weight biomass of roots, rhizomes and shoots and total N and C content of J. acutiflorus tissue were measured from plants at Tf. Although there was no significant difference in total biomass and root:shoot ratio of J. acutiflorus between incubations, the average total N content of plant tissue was approximately twice as high (65 mg g−1) in incubations with a high N input (t = 2.66; p = 0.037; Supplementary Table 2). Correspondingly, total C:N (averaged across the whole plant) was significantly higher in J. acutiflorus incubations with a low N input (t = −2.964; p = 0.009; Supplementary Table 2). Interestingly, this elevated C:N ratio was observed only for rhizome and shoot tissue, while the root C:N did not significantly differ between incubations (Supplementary Table 2).
Greenhouse gas fluxes
To link greenhouse gas fluxes with microbial community structure, gas flux measurements were performed at the same time points as soil sampling. Greenhouse gases were measured in both light and dark conditions, at Tm and Tf for CO2 and CH4, and at Tf for N2O (Figure 1). Bulk soils generally did not have significant greenhouse gas fluxes (fluxes were not significantly different from 0) and will not further be discussed here. In the J. acutiflorus incubations, CO2 fluxes followed a day-night rhythm. Daytime CO2 fluxes were generally negative, indicating net CO2 fixation, with the largest rates significantly higher in high N J. acutiflorus incubations at Tf (t = −5.28, p = 0.005; Figure 1A). Under dark conditions, CO2 fluxes were positive only under the high N treatment while other treatments were not significantly different from 0(t = 3.52, p = 0.01; Figure 1B). CH4 and N2O emissions did not vary between dark and light conditions and therefore these conditions will not be compared. CH4 fluxes increased from Tm to Tf and emissions tended to be highest in the J. acutiflorus incubations with a high N input, however there was large variability in this group (t = 2.165; p = 0.064; Figure 1C). N2O emissions were highest in the high N treatment (t = 2.56, p = 0.04; Figure 1D), while a negative N2O flux was observed in J. acutiflorus incubations receiving a low N input (Figure 1D).

CO2, CH4 and N2O fluxes. Greenhouse gas fluxes were measured at a midpoint (Tm) and final time point (Tf) during the day incubation experiment. (A) CO2 light conditions, (B) CO2 dark conditions, (C) CH4 and (D) N2O. Asterisks denote significant differences (p < 0.05).
Denitrification potential
To understand how increased N input influenced N cycling within bulk and J. acutiflorus rhizosphere soils, soil slurries were taken at Tf and their denitrification potential was measured. There was significantly higher N2O production from slurries originating from high N treatment soils (t = 2.41; p = 0.045; Supplementary Figure 2). There was no significant difference in the N2 production between high or low N treatments (t = 0.32; p = 0.75; Supplementary Figure 2). Additionally, the average N2:N2O ratio was approximately 10 times higher in low N input slurries (5.36 +/− 7.39; N2:N2O production) as compared to high N slurries (0.58 +/− 0.61), though not significantly different at p < 0.05 (t = −1.84; p = 0.11; Supplementary Figure 2).
Microbial community structure
The v3-v4 fragment of the 16S rRNA gene was amplified and sequenced resulting in, on average, over 1100 post-quality control (QC) sequences per sample. Each sample contained on average 264 +/− 136 Operational Taxonomic Units (OTUs +/− s.d.). Rarefaction curves suggest that communities were sampled to capture the majority of the diversity (Supplementary Figure 3). Over the course of the incubation, the dominant microbial group changed (Figure 2A). Solibacteriales were most abundant at T0 and at Tm, but by Tf Rhizobiales became the prominent group (Figure 2B). On average, microbial diversity increased between Tm and Tf, (t = 2.516; p = 0.0176; Supplementary Figure 4A). Within each time point, diversity did not differ significantly between J. acutiflorus and bulk soil incubations, nor did N input have an impact (Supplementary Figure 4B+C). To assess how community composition varied across the different incubations, the Bray-Curtis dissimilarity index was used to calculate compositional differences between microbial communities. The compositional variation did not significantly vary between Tm and Tf, indicating that community variability did not change within the different experimental groups across time (Supplementary Figure 5A-C). The most variable communities were observed for low N J. acutiflorus incubations at Tm, which furthermore were significantly different from the low N input bulk soil incubations (Tukey’s HSD; p = 0.0184; Supplementary Figure 5B). At Tf there were no significant differences in community variation among bulk soil or J. acutiflorus incubations, or between low and high N loading. There were significant differences in overall community composition between high and low N treatment (PerMANOVA; p = 0.003), rhizosphere and bulk soil (p = 0.02), and midpoint and final time points (p < 0.001).

Microbial community structure and diversity. (A) Overview of microbial community structure of the initial soil sample (I), J. acutiflorus rhizosphere and bulk soil incubations receiving high or low N input at midpoint (Tm) and final time point (Tf). (B). Principal component analysis of the microbial community members distinguishing high and low N treatments and midpoint and final sampling time points. Points indicate individual samples taken. Red dashed arrows indicate environmental and gas fluxes that corresponded variation in microbial community member’s abundance along the respective axis.
Linking microbial community members to function
In order to understand how the microbial community members were linked to environmental conditions and greenhouse gas emissions, a random forest classifier was used to identify microbial taxa whose abundance was affected by N input, time of sampling or presence of J. acutiflorus. Additionally, random forest was also used for regression to determine connections between abundance of these groups and environmental conditions or greenhouse gas fluxes, and these associations were further analyzed by fitting linear models.
The top three microbial groups that significantly responded to N input were the Opitutales (Verrucomicrobia) and Sphingobacteriales (Bacteroidetes), which were more abundant in the high N treatment group, and G6 Acidobacteria, which were more abundant in in the low N treatment (Figure 2B; Table 1). More specifically, the relative abundances of these three orders could be linked to N2O emissions (Table 1). Opitutales and Sphingobacteriales were positively associated with N2O fluxes, while a negative association was observed for the G6-Acidobacteria. In addition, Sphingobacteriales were correlated to CO2 fixation (Table 1).
Correlations of microbial community members to environmental conditions and greenhouse gas fluxes. The mean relative abundance of top bacterial families distinguishing high v low N, rhizosphere v bulk soil or Tm v Tf sampling time points are indicated as is the t-test result and statistics. Additionally, the top environmental or functional traits correlated with these groups were reported along with linear model statistic
The top bacterial order distinguishing microbial communities from rhizosphere and bulk soil were the Alphaproteobacterial Caulobacterales, which were more abundant in the rhizosphere than in bulk soil and had a negative association with elevated NO3− concentrations (Table 1). The Rhizobiales and Solibacterales orders of the Alphaproteobacteria class and Acidobacteria phylum, respectively, were most distinctive for the microbial communities sampled at Tm versus Tf (Figure 2; Table 1). Rhizobiales abundance was negatively associated with CO2 fluxes in dark conditions while the Solibacterales were correlated to pore water alkalinity, which is a proxy for anaerobic decomposition (Figure 2; Table 1).
Soil metagenomics
In addition to the 16S rRNA gene, which cannot be linked to functional genes on their own, total DNA was sequenced from 5 soils with representatives from T0, and rhizosphere and bulk soil samples at Tm and Tf from the high N treatment. The goal of the metagenomic sampling was to survey the genetic potential of organisms that were most strongly influenced by N loading. In particular, we wanted to find support for the roles the taxa mentioned above have in the rhizosphere of J. acutiflorus. These libraries resulted in on average 1 million post-QC reads per library (Supplementary Table 3). Over 4.8 million soil metagenome reads were then assembled into 129,476 contigs with a maximum length of 23kbp and a mean length of 597bp (+/− 368bp). Assembled contigs were compared to publicly available bacterial genomes from the Bacteroidetes, Verrucomicrobia and Acidobacterial phyla to identify genome fragments derived from the species identified in our previous analysis. Across all metagenomes, 5454 reads mapped to 145 contigs which had high identity to a Subgroup 6 Acidobacterial genome (CP015136.1; 84.5 +/− 7.1% identity), 6831 and 22 reads mapped to 352 and 5 contigs which aligned to an Opitutales (CP016094.1; 85.5 +/− 7.9% identity) and Sphingobacteriales (CP003349.1; 86.3 +/− 7.7% identity) genomes respectively (Supplementary Table 4).
In order to survey genetic potential for N and C cycling in N amended samples, custom databases of genes involved in N and C cycling processes (Lüke et al., 2016) were used to identify metagenomic reads of major N (amoA and hao, involved in NH4+ oxidation; narG, nirK, nirS, norBand nosZ, involved in denitrification; nrfA, involved in dissimilatory nitrite reduction to ammonia; and nifH, involved in N fixation) and CH4 cycling genes (pmoA and mmoX, inovled in CH4 oxidation; phnGHI and mcrA, involved in methanogenesis), and their abundance in the high N incubations (abbreviations found in Supplementary Table 5). There were no nirS detected in the dataset and only two reads annotated as mcrA were detected in the metagenomes from J. acutiflorus. All other N and CH4 cycling genes were present.
Discussion
Greenhouse gas emissions remain a global challenge. A mechanistic understanding of the factors that alter microbial community structure and function, such as increased N input, is important in developing management strategies for greenhouse gas emissions. This is particularly important in ecosystems as extensive as wetlands. With an estimated area of up to 12.8 million km2 worldwide, wetlands considerably contribute to the total terrestrial carbon storage (Zedler and Kercher, 2005; Nahlik and Fennessy, 2016). Here we studied the impact of increased N input on the microbial community and greenhouse gas fluxes from the rhizosphere of Juncus acutiflorus, a very common plant in European wetland ecosystems, and a model for other Juncus species globally. We found characteristic shifts in the microbial community structure and a stimulation of greenhouse gas fluxes in J. acutiflorus incubations in response to N input.
Plant physiological shifts as a response to high N inputs
The plant plays a prominent role in the maintenance of the rhizosphere microbial community (Reinhold-Hurek et al., 2015). Roots release oxygen through radial oxygen loss providing an oxic niche in otherwise anoxic wetland soils (Armstrong, 1971). Plants also release labile organic matter in the form of organic acids, neutral sugars and amino acids (Kamilova et al., 2006; Jones, 1998).The composition of this organic matter structures the microbial community within the rhizosphere by providing different substrates for heterotrophic micro-organisms (Haichar et al, 2008). The exuded organic acids also acidify the surrounding soil, preventing many microbial species from thriving within the rhizosphere, but also modifying nutrient availability (Marschner et al., 1987; Petersen and Böttger, 1991). The quantity of organic matter released is closely associated with photosynthesis rates. As plants are often N limited in natural systems, relieving this limitation promotes plant growth (Reich et al, 2006). In this study we observed that when incubated under high N input J. acutiflorus showed increased C fixation rates (Figure 1A) and plant tissue becomes saturated with N (Supplementary Table 2). This also suggests that J. acutiflorus without N limitation excretes larger amounts of labile carbon into the surrounding soil, which is also evident from the observed decreases in pore water pH in the high N incubations(Supplementary Figure 6). Additionally, due to root derived oxygen, increased nitrification rates could contribute to this observed drop in pH Lamers et al. 2012). Together, higher N input could result in higher photosynthetic rates in J. acutiflorus specimens, likely depositing larger amounts of organic matter into surrounding soil, stimulating the heterotrophic microbial community in return (Figure 2; Figure 3).
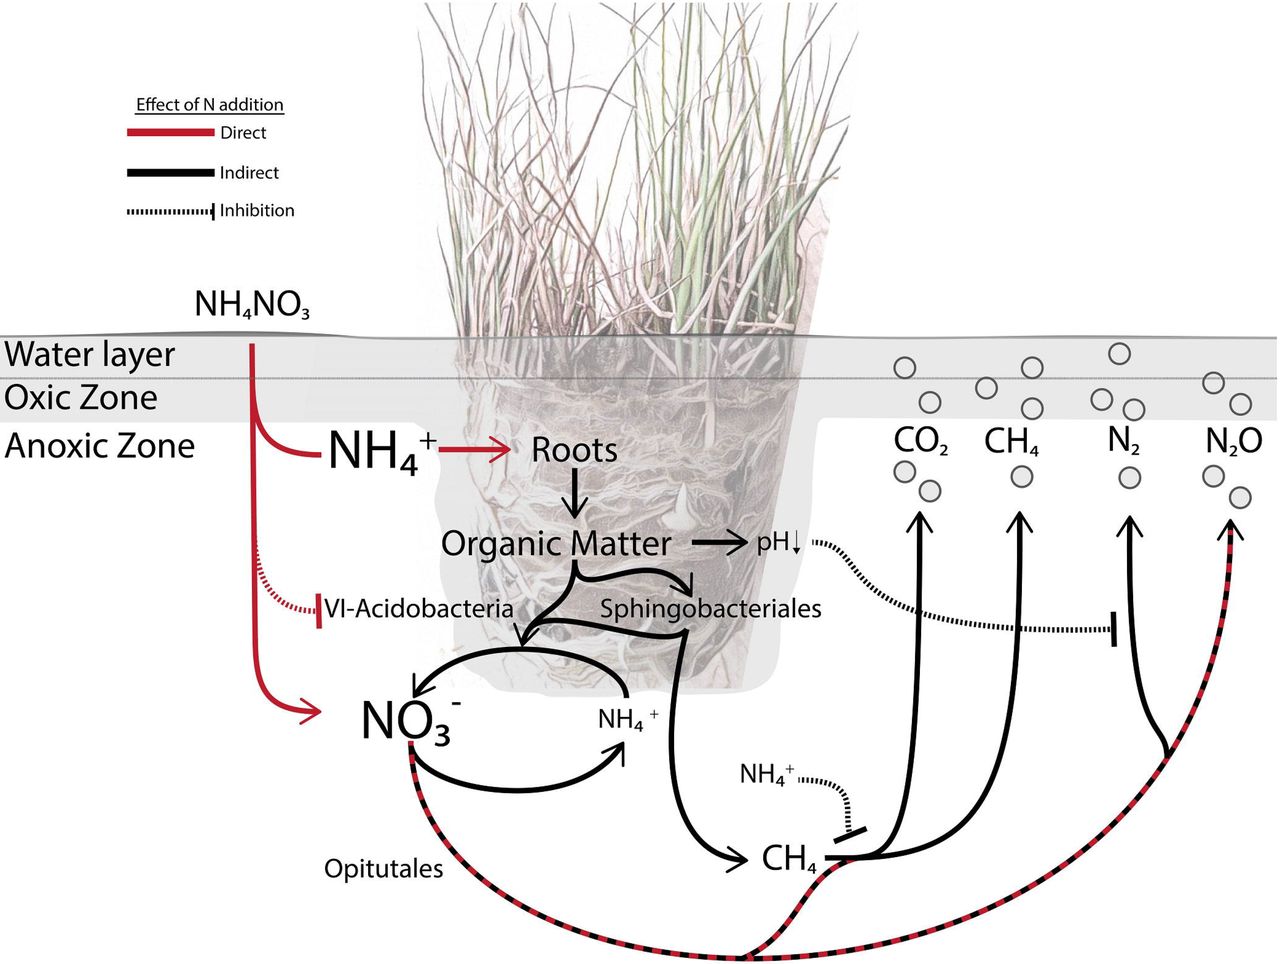
A Juncus acutiflorus rhizosphere microbial food web model. In the model of the J. acutiflorus rhizosphere, microbial processes are directly (red lines) or indirectly (black lines) influences by N deposition. J. acutiflorus preferentially takes up NH4+ which stimulates plant productivity and rhizodeposition of organic matter and oxygen (Van Diggelen et al., 2015). Released oxygen and labile organic matter contribute to soil acidification in addition to stimulating complex polymer degradation (Sphingobacteriales) and heterotrophic denitrifiers (Opitutales). The production of N can be affected by a drop in pH which influences the activity of complete denitrifiers. The Group-6 Acidobacteria are outcompeted at higher N availability. Recalcitrant organic matter degraded by Sphingobacteriales can enter the microbial food web and be fermented by fermenters that in turn provide substrates for methanogens (mcr). The activity of phosphonate lyases (phn) might also stimulate the production of methane while anaerobic methane oxidation also contributes to methane consumption. Additionally, methane consumption by aerobic methanotrophsthrough methane monoxgenases (pmo) could be inhibited by excess NH4+ (Dunfield and Knowles 1995).
Greenhouse gas fluxes as a result of high N input
N availability has been shown to alter greenhouse gas emission dynamics in previous studies (Philippot et al., 2009). Here we observed that greenhouse gas fluxes in J. acutiflorus incubations were stimulated as a response to increased N input (Figure 1). CO2 fixation rates were highest in J. acutiflorous incubations with high N input in the light conditions, likely due to increased photosynthetic activity of the plant and photosynthetic microorganisms. In the dark, the same J. acutiflorus incubations showed elevated CO2 emissions, likely due to increased plant and microbial respiration (Figure 1).
In this study, the highest CH4 emissions were observed in J. acutiflorus incubations with high N input, although with high variability (Figure 1C). Still, the elevated emission rates suggest that the J. acutiflorus rhizosphere could become a net source of CH4 under high N input. The total amount of CH4 released reflects the sum of CH4 production (methanogenesis) and consumption (methanotrophy). Methanogenesis has been linked to plant productivity, thought to be due to increased availability of labile organic carbon from photosynthate exudates (Whiting and Chanton, 1993;Aulakh et al, 2001). Furthermore, methanogens can be stimulated through an indirect priming mechanism. Labile organic matter from plant photosynthate can stimulate microbial activity responsible for degrading recalcitrant organic matter, which in turn makes this carbon source available to methanogens (Jenkinson et al., 1985; Kotsyurbenko, 2005; Kotsyurbenko et al, 1993; Tveit et al, 2015). Alternatively, net CH4 emissions can be increased by inhibiting CH4 consumption, for instance through the competitive inhibition of the key enzyme methane monooxygenase by NH4+ (Bosse et al., 1993; Conrad and Rothfuss, 1991).
The reduction of NOx to N2 is often incomplete, resulting in the production of the greenhouse gas N2O. Incomplete denitrification occurs when microbial species do not utilize N2O as an electron acceptor either due to physiological constraints or induced by certain environmental conditions (Philippot, 2002; Wallenstein et al., 2006). It has been observed that N fertilization has the largest impact on N2O emissions when considering all terrestrial ecosystems, with NO3− availability being the main driver (Liu and Greaver, 2009). As denitrification is largely a microbial process, the composition of the microbial community plays an important role in the total amount of N emitted from soils. Representatives from a diverse set of phyla are known to denitrify (Philippot, 2002; Philippot et al, 2009) and denitrification rates are therefore considered to be robust to changes in the microbial community composition (Enwall et al., 2005). Here we observed elevated N2O emissions in J. acutiflorus incubations under high N input, whereas there were negative N2O fluxes in the low N incubations. Interestingly, N2O emissions by bulk soil were not significantly influenced by the tested N regimes, indicating that J. acutiflorus plays a substantial role in stimulating N reducing microbial species, probably by supplying labile carbon. In addition there was an almost 10-fold shift in the release of N2O relative to N2 as a response to N input suggesting a high N input can shift the community towards partial denitrifiers in the rhizosphere, which is important given the strong greenhouse potential of N2O.
Shifts in microbial community structure as a response to high N input
Associating microbial metabolisms (i.e., those resulting in greenhouse gas emission) to the structure of microbial communities and abiotic factors defined by the environment is essential to predict how the structure and function of these microbial ecosystems may adapt to future conditions. Bulk and rhizosphere soils contain diverse microbial communities with equally diverse metabolisms (Philippot et al., 2013; Torsvik and Øvreås, 2002). It remains a challenge to understand the role that key groups play in these systems, and how they affect their environment.
We link the abundance of three bacterial orders to N input and greenhouse gas emissions (Figure 2; Table 1). The Verrucomicrobial Optitutales were associated with high N input and elevated N2O emissions. Members of this order are diversely associated with different rhizospheres, ranging from sugar cane to wetland plants (Dedysh et al., 2006; van Passel et al., 2011). They have been physiologically described as anaerobic polysaccharide utilizing bacteria that are capable of reducing NO3− to NO2− (Chin et al., 2001). Apart from the O2 derived from the plant roots, which is quickly consumed by aerobic heterotrophs, wetland soils are waterlogged systems resulting in an anoxic environment. Assembled sequences from the metagenomes obtained in this study aligned to an Optitutales genome (CP016094.1), which encodes NO3− and NO2− reductases. Additionally, two of our assembled contigs contained open reading frames for the copper-containing nitrite reductase (NirK). It is likely that members of this order are utilizing plant derived organic matter as their electron donor and NO3− as their electron acceptor (Figure 3).
The Sphingobacteriales from the phylum Bacteroidetes were also overrepresented in the high N input incubations (Figure 2; Table 1). Sphingobacteriales are understood as copiotrophic bacteria, referring to their ability to metabolize a wide array of carbon sources and being present at high abundances in soils with high carbon availability (Fierer et al., 2007b; Padmanabhan et al., 2003). In the current study, the majority of organic matter would originate from the plant as the sandy soil used had low organic matter content. Rhizodeposition in this case would be very important to groups such as Sphingobacteriales, not only as a carbon source but as an O2 source as Sphingobacteriales seem to be particularly sensitive to O2 availability. When tested for cellulolytic activity in oxic or anoxic environments they were exclusively active in the oxic treatment, suggesting that this group may require oxygenated environments for carbon degradation (Schellenberger et al., 2009). Here, Sphingobacteriales were more abundant in high N input incubations and were associated with N2O fluxes and higher CO2 fixation rates, suggesting that they may benefit from oxygen and carbon derived from roots. In addition, multiple contigs from the soil metagenomes aligned to a Sphingobacteriales genome (CP003349.1), which encodes nitrate, nitrite, nitric oxide and nitrous oxide reductases. Three of these contigs encoded NirKs homologous to one found in a Sphingobacteriales genome (LGEL01000245.1). Considering findings from this study and the literature, we hypothesize that Sphingobacteriales within the J. acutiflorus rhizosphere could be facultative anaerobes benefiting from the elevated carbon input from the roots and utilizing available NOx as electron acceptors (Figure 3).
G6 Acidobacteria were overrepresented in the low N input incubations and there was no significant difference in their abundance between bulk and rhizosphere soils. Unlike Opitutales and Sphingobacteriales, they were negatively correlated with N2O emissions (Figure 2; Table 1). While the G6 Acidobacteria group is not well studied, one genome (CP015136.1) was recently published (Huang et al., 2016) and was shown to contain nitric and nitrous oxide reductases. 145 contigs of our metagenome aligned to this genome; however none of the assembled contigs encoded proteins involved in denitrification. Genomic and physiological studies of a closely related group (group 1 Acidobacteria) showed that they were anaerobic organoheterotrophs capable of utilizing NO3− for respiration and NH4+ as an N source (Dedysh et al., 2012), and other Acidobacteria have also been described as important soil carbon and N cyclers. However, many N-cycling reactions are restricted to particular clades indicating that these functions are heterogeneously represented across the Acidobacteria phylum (Kielak et al., 2016; Koch et al., 2008). Alternatively, Acidobacteria can utilze C derived from autotrophic microorganisms in anoxic environments (Meisinger et al., 2007). They have been reported to utilize various plant and microbe-derived polysaccharides, like xylan, cellobiose and gellan (Janssen et al., 2002; Koch et al., 2008) and thrive in various soils and rhizospheres, including anoxic soils with low pH (Fierer et al., 2007a; Pankratov and Dedysh, 2010). The cultured representatives of Acidobacteria have low growth rates and appear to be adapted to oligotrophic environments (Fierer et al. 2007; Jones et al. 2009). Thus, G6 Acidobacteria may not be competitive under high N availability by fast-growing (partial) denitrifiers. Together, the G6- Acidobacteria may be involved in anaerobic degradation of organic carbon from autotrophic bacteria or plant biomass, and increased N availability might reduce this group’s abundance (Figure 3).
A model microbial food web within bulk soil and the J. acutiflorus rhizosphere
Increased N input poses a distinct threat to wetland ecosystems, contributing to the degradation of biodiversity and altering greenhouse gas emissions (Bobbink et al., 1998; Philippot et al., 2009). Plants, such as J. acutiflorus, influence the abundance and composition of micro-organisms living in the rhizosphere by exuding organic matter and releasing oxygen from their roots (Reinhold-Hurek et al., 2015). In the current study, N addition resulted in increased productivity of J. acutiflorus, stimulating the effect of the plant on the microbial community but also directly affecting microbial metabolism. Based on our observations and published knowledge, we built a model of the J. acutiflorus microbial food web indicating how N input impacts the soil microbial community (Figure 3).
N fertilization can directly influence the soil microbial community by providing excess NH4+ and NO3−. Previous studies have shown that J. acutiflorus prefers NH4+ over NO3− as N source, leading to a surplus of NO3− in the rhizosphere (Supplementary Figure 6; van Diggelen et al. 2016). This alters N cycling dynamics, favoring microbial species capable of rapidly reducing NO3− to N2O rather than to N2. While complete denitrification supports higher growth yields, it also is energetically more costly and thus unfavorable under lower nutrient availability (i.e., K strategy life style). The combined effect of enhanced plant derived carbon input and higher N availability stimulates heterotrophic activity, resulting in increased N2O and CO2 emissions (Figure 3). While excess NO3− spurs anaerobic respiration, increased NH4+ concentrations can lead to an inhibition of methane oxidation, possibly contributing to the heterogeneity observed in CH4 emissions (Figure 1C). High N availability can also have an indirect effect by influencing plant physiology. The observed increased rates of carbon fixation by J. acutiflorus under high N input may result in augmented release of organic matter (including organic acids) and oxygen from the roots. This acidifies the rhizosphere soil, which can alter the activity of nosZ containing microbes (Liu et al, 2014). Additionally, elevated oxygen availability stimulates heterotrophic activity in an otherwise anoxic environment, leading to higher CO2 emissions. Thus, altered N input in the J. acutiflorus rhizosphere leads to increased greenhouse gas fluxes directly by altering the abundance of N-cycling species and indirectly through the stimulation of plant primary productivity (Figure 3).
CONCLUSIONS
With continued anthropogenic inputs of nitrogen into wetlands, it is critical to mechanistically understand how this activity may affect globally relevant carbon and nitrogen cycling within wetlands. The results here support that under high N input, greenhouse gas emissions from the J. acutiflorus rhizosphere increase, shifting the system from a greenhouse gas sink to a source. Three bacterial orders, the Opitutales G6-Acidobacteria and Sphingobacteriales, respond to increased N availability and genomic evidence supports their involvement in processes leading to changes in greenhouse gas fluxes. Our view is that understanding interactions within the rhizosphere, that result in increased greenhouse gas emissions, is essential for creating management solutions aimed to address greenhouse gas emission goals, efficient agricultural practices, and conservation efforts. To move forward in our understanding of the complex dynamics within ecosystems such as the rhizosphere, future effort needs to be made in building extensive datasets that can be used to build predictive models of how these microbial ecosystems might respond under altered environmental conditions. We propose that mechanistic models, such as our J. acutiflorus rhizosphere plant-microbial food web model, should be used to set the framework for building such datasets.
Author Contributions
EH, SFH, JvD, LL, MJ, CL, SL, CW designed research; EH, SFH, JvD performed research; EH, SFH, JvD analyzed data; EH, SL, CW wrote the paper; All authors reviewed and agreed with the final version of the manuscript.
Conflict of Interest
The authors declare no conflicts of interest.
Funding
This work was supported by the European Research Council (ERC AG ECOMOM) to M.S.M.J., and the Netherlands Organisation for Scientific Research (N.W.O) through GravitationGrants SIAM(024.002.002) and NESSC(024.002.001) to M.S.M.J. and VENI grant 863.14.019 to S.L.
Supplemental Material
Supplemental Table 1.
Sample overview containing the time of sampling, N load treatment and whether or the sample was bulk or rhizosphere soil. Additionally, the number of post quality filtered reads that were produced and the number of OTUs found in each sample. Finally, greenhouse gas fluxes are reported in (μmol m−2 d−1).
Supplemental Table 2.
Plant average dry weight and C:N were determined in different sections of the plant including the roots, shoots and rhizomes. Biomass weight was determined as dry weight. The mean values from plants receiving high N and low N are reported (Mean_High and Mean_Low). The p-value is reported as a result of a t-test comparing mean values from high and low N treatments.
Supplemental Table 3.
Metagenome library overview including the time of sampling (Time), number of post-QC reads (Reads), average length (Avg_len) and the standard deviation in read length (Sd_len).
Supplemental Table 4.
Number of reads and contigs assigned to one of three publicly available soil bacterial genomes. Number of reads each metagenome contained are reported as well as the number of contigs that were assembled that aligned to these genomes.
Supplemental Table 5.
Gene abbreviations.
Supplemental Figures
Supplemental Figure 1.
Experimental design schema depicting sample replicates per treatment in either rhizosphere/bulk soil. Additionally, the sampling points are denoted by colored boxes.
Supplemental Figure 2.
The Shannon diversity index (H’) was calculated for all microbial communities. The Shannon diversity of all samples was compared from Tm and Tf (A). Diversity of experimental groups (High/Low N + Rhizosphere/Bulk) of all Tm (B) and Tf (C) samples were compared using multiple comparisons
Supplemental Figure 3.
Rarefaction curves with number of species observed as a function of sequencing effort (sample depth).
Supplemental Figure 4.
Microbial community variation was estimated by calculating the Bray-Curtis dissimilarity for each sample in a pairwise fashion resulting in a square distance matrix. These pairwise distances were then reduced to two dimensions using multidimensional scaling. A centroid was calculated for each group being compared and each sample’s Euclidean distance to its respective group centroid was calculated. Tm and Tf were compared in panel A, Tm (B) and Tf (C) samples were compared within respective groups (High/Low N + Rhizosphere/Bulk)
Supplemental Figure 5.
Denitrification potential from soil slurries. N and N2O production rates were estimated to determine potential denitrification of the soil and rhizosphere microbial communities.
Supplemental Figure 6.
Pore water inorganic nutrients, pH and alkalinity. Concentration of inorganic nutrients, pH and alkalinity in pore water sampled throughout the incubation.
Acknowledgements
We would like to thank Theo van Allen for sequencing support and Sebastian Krosse, Paul van der Ven, and General Instrumentation at Radboud University for support with elemental analysis.
Funding was provided by the European Research Council (ERC AG 339880 ECOMOM) to M.S.M.J., and the Netherlands Organisation for Scientific Research (NOW) through Gravitation Grants SIAM (024.002.002), and NESSC (024.002.001) to M.S.M.J. and VENI grant 863.14.019 to S.L.
References


