

Abstract
Temporal expectations (e.g., predicting “when”) facilitate sensory processing, and are suggested to rely on entrainment of low frequency neural oscillations to regular rhythmic input. However, temporal expectations can be formed not only in response to a regular beat, such as in music (“beat-based” expectations), but also based on a predictable pattern of temporal intervals of different durations (“memory-based” expectations). Here, we examined the neural mechanisms underlying beat-based and memory-based expectations, by assessing EEG activity and behavioral responses during silent periods following rhythmic auditory sequences that allowed for beat-based or memory-based expectations, or had random timing. In Experiment 1 (N = 32), participants rated how well probe tones at various time points fitted the previous rhythm. Beat-based expectations affected fitness ratings for at least two beat-cycles, while the effects of memory-based expectations subsided after the first expected time point in the silence window. In Experiment 2 (N = 27), using EEG, we found a CNV following the final tones of memory-based and random, but not beat-based sequences, suggesting that climbing neuronal activity may specifically reflect memory-based expectations. Moreover, we found enhanced power in the EEG signal at the beat frequency for beat-based sequences both during listening and the silence. For memory-based sequences, we found enhanced power at a frequency inherent to the memory-based pattern only during listening, but not during the silence, suggesting that ongoing entrainment of low frequency oscillations may be specific to beat-based expectations. Finally, using multivariate pattern decoding on the raw EEG data, we could classify above chance from the silence which type of sequence participants had heard before. Together, our results suggest that beat-based and memory-based expectations rely on entrainment and climbing neuronal activity, respectively.
Introduction
Predicting the timing of incoming events optimizes processing in our dynamic environment (Nobre & van Ede, 2018), as it allows the brain to increase sensitivity to events at predicted times through a temporally specific increase in perceptual gain (Auksztulewicz, Myers, Schnupp, & Nobre, 2019), without the need for constant vigilance (Breska & Deouell, 2017; Rimmele, Morillon, Poeppel, & Arnal, 2018; Schroeder & Lakatos, 2009b, 2009a). Entrainment models (Large & Jones, 1999) provide a mechanistic explanation for temporal expectations, by assuming that the phase and period of low-frequency neural oscillations synchronizes to external rhythmic stimulation, causing optimal neural excitability at expected times (Henry & Herrmann, 2014; Schroeder & Lakatos, 2009a). Entrainment theories are corroborated by behavioral evidence showing improved performance for events in phase with an external rhythm (Bouwer & Honing, 2015; Jones, Moynihan, MacKenzie, & Puente, 2002; Large & Jones, 1999), evidence showing the dependency of behavioral performance on the phase of delta oscillations (Arnal, Doelling, & Poeppel, 2014; Cravo, Rohenkohl, Wyart, & Nobre, 2013; Henry, Herrmann, & Obleser, 2014; Henry & Obleser, 2012), and evidence showing phase locking of low frequency oscillations to rhythmic input (Doelling, Assaneo, Bevilacqua, Pesaran, & Poeppel, 2019; Nozaradan, Peretz, Missal, & Mouraux, 2011; Stefanics et al., 2010).
Temporal expectations have often been studied in the context of periodic, isochronous sensory input, but temporal regularities in the environment are not always based on isochrony. Commonly, a distinction is made between temporal expectations based on learning absolute intervals (memory-based) and based on some periodicity, such as a beat in music (beat-based) (Breska & Deouell, 2017; Morillon, Schroeder, Wyart, & Arnal, 2016; Nobre & van Ede, 2018; Teki, Grube, Kumar, & Griffiths, 2011). Memory-based expectations have been shown to provide similar behavioral benefits as beat-based expectations (Bouwer, Honing, & Slagter, in press; Heideman, van Ede, & Nobre, 2018; O’Reilly, McCarthy, Capizzi, & Nobre, 2008) and may be especially important in the auditory domain, in which the timing of speech and non-Western music often has a predictable pattern, but is not necessarily periodic.
Memory-based expectations, based on a predictable pattern in an aperiodic rhythmic sequence, are a possible challenge for entrainment models, which are arguably better suited to explain temporal expectations for periodic input (Breska & Deouell, 2017; Rimmele et al., 2018). The possible role of entrainment in not just beat-based, but also memory-based temporal expectations is therefore currently actively debated (Bouwer et al., in press; Obleser, Henry, & Lakatos, 2017; Rimmele et al., 2018). Entrainment models could potentially account for memory-based expectations by assuming multiple coupled oscillators at different frequencies and with different phases (Tichko & Large, 2019), or by assuming flexible top-down phase resets at expected moments, though this would entail some top-down mechanism, making observed entrainment the consequence, rather than the cause of expectations (Obleser & Kayser, 2019; Rimmele et al., 2018). Alternatively however, memory-based expectations could be accounted for by climbing neuronal activity, peaking at expected moments (Breska & Deouell, 2017; Praamstra, Kourtis, Kwok, & Oostenveld, 2006). Only a handful of studies have directly compared neurophysiological responses associated with beat-based and memory-based expectations, showing no differences in phase locking (Breska & Deouell, 2017), or in effects on early auditory event-related potential responses (Bouwer et al., in press). Yet, these studies also reported tentative evidence for differences in underlying mechanism, in the form of faster CNV resolution for beat-based than memory-based expectations (Breska & Deouell, 2017) and suppression of unexpected events in beat-based rhythms, even when these events were fully predictable based on their pattern (Bouwer et al., in press). However, the former could be explained by more precise memory-based expectations for the intended beat-based sequences, which were isochronous and could be predicted by learning the repeated interval, and the latter did not directly probe the underlying mechanism implementing expectations. Thus, it is currently still unclear whether beat-based and memory-based expectations are subserved by shared or separate neural dynamics.
Here, we aimed to determine the role of entrainment in beat-based and memory-based expectations, by examining responses in a silent window after cessation of the rhythmic input, directly testing the prediction of entrainment models that entrainment should outlast sensory stimulation (Haegens & Zion Golumbic, 2018; Obleser & Kayser, 2019; Zoefel, ten Oever, & Sack, 2018). Crucially, such persistent entrainment may be one of the few ways of differentiating between real entrainment (“in the narrow sense”, see Obleser & Kayser, 2019) and regular evoked potentials, or similar phase locked responses that resemble entrainment with common analysis techniques (Zoefel et al., 2018), and that may not differentiate between beat-based and memory-based expectations (Breska & Deouell, 2017). However, the evidence for persistent entrainment is sparse, and mainly comes from behavioral studies (Hickok, Farahbod, & Saberi, 2015), and studies looking at entrainment in the alpha band in the visual domain (de Graaf et al., 2013; Mathewson et al., 2012). Humans, however, have a preference for forming temporal expectations in the auditory domain and at slower rates (Merchant, Grahn, Trainor, Rohrmeier, & Fitch, 2015), as naturally present in speech and music (i.e., the delta and theta range), questioning whether persistent entrainment in the alpha range in the visual system is relevant for the formation of temporal expectations in the natural auditory environment. Also, all of these studies used isochronous stimuli, in which expectations can easily be formed based on learning one absolute interval (i.e., memory-based). Thus, evidence for persistent entrainment after cessation of rhythmic input in the auditory domain and its prominent frequencies thus far remains elusive, as well as evidence for whether entrainment underlies beat-based and/or memory-based expectations.
We recorded EEG activity during and after non-isochronous auditory sequences with either a regular beat (eliciting beat-based expectations), a predictable pattern (eliciting memory-based expectations), or random timing (no expectations). Moreover, in some portion of trials, in the silence period, we asked participants to rate how well probe tones at various time points fitted the preceding rhythm. To foreshadow our results, consistent with entrainment underlying beat-based, but not memory-based expectations, we show that the effects of beat-based expectations on behavior outlasted the effects of memory-based expectations. Also, we found enhanced power at the beat frequency for beat-based sequences during listening, and, importantly, during the silence, while for memory-based sequences, we observed enhanced power at frequencies related to the rhythms only during listening, but not during the silence. We also find unique neural markers associated with memory-based expectations: while the memory-based sequences were followed by a CNV, related to the expectation for the next sound, for the beat-based sequences, the CNV was absent. Finally, using multivariate pattern decoding, we could classify above chance from the raw EEG signal in the silence whether participants had previously listened to a beat-based, memory-based, or random sequence. These findings provide clear evidence for the notion that different neural mechanisms underlie beat-based and memory-based expectations.
Methods
Before our EEG experiment, we first conducted a behavioral experiment in which a probe could be presented in each trial at different temporal positions across the entire silence period to more precisely determine the persistence and temporal dynamics of beat-based and memory-based expectations.
Behavioral Experiment 1
Participants
Thirty-two participants (18 women), aged between 18 and 44 years old (M = 24, SD = 5.6) took part in the experiment in exchange for course credit or monetary compensation. None of the participants reported a history of hearing or neurological problems, and all provided written informed consent prior to the onset of the study. The experiment was approved by the Ethics Review Board of the Faculty of Social and Behavioral Sciences of the University of Amsterdam.
Stimuli
We used rhythmic patterns marked by woodblock sounds of 60 ms length, generated in GarageBand (Apple Inc.), as previously used in (Bouwer et al., in press) to elicit beat-based and memory-based expectations (Figure 1). Each pattern was 1800 ms long and consisted of five temporal intervals. The number of tones was chosen to allow for learning of the rhythmic surface structure in the memory-based condition, while the length of the pattern was such that the formation of beat-based expectations with a period of the entire pattern would be unlikely in the memory-based sequences (Bouwer et al., in press; Honing & Bouwer, 2019; London, 2012; Schultz, Stevens, Keller, & Tillmann, 2013). Sequences were constructed by concatenating four patterns and a final tone, for a total sequence length of 7260 ms (four patterns of 1800 ms, plus 60 ms for the final tone).

A) Twelve patterns of five temporal intervals with integer ratio durations and an event at each 600 ms period were created to form beat-based sequences. Equivalent patterns without a regular beat every 600 ms were created by using non-integer ratio durations, while keeping the number of intervals and grouping structure the same (random condition). For the memory-based sequences, only pattern 1 was used, to allow for learning of the intervals. B) Four semi-randomly chosen patterns were concatenated to form rhythmic sequences. In both the beat-based and random sequences, the last pattern was always pattern 1 or 2, to equate the acoustic context preceding the silence period. C) To measure behavioral effects of expectations, a probe tone could appear at various temporal positions in the silence period (indicated by the dashed red lines), predictable based on a beat (B+, light orange), predictable based on memory (M+, light purple), or unpredictable based on the beat (B-) or memory (M-). Subjects had to indicate how well the probe tone fitted the preceding rhythm.
In the twelve beat-based patterns used (Figure 1), temporal intervals were related to each other with integer-ratio durations. The shortest interval had a length of 150 ms, with the relation between the five intervals used of 1:2:2:3:4 (i.e., 150, 300, 300, 450, and 600 ms). The sounds were grouped such that a perceptually accented sound (Povel & Okkerman, 1981) occurred every 600 ms (every unit length 4), giving rise to a beat at 100 beats per minute, or 1.67 Hz, within the range of preferred tempo for humans (London, 2012). All beat-based patterns were strictly metric, with the beat always marked by a sound (Grahn & Brett, 2007). Sequences of beat-based patterns were constructed from four semi-randomly chosen patterns, with the restriction that the last pattern of the sequences was always pattern 1 or 2 (see Figure 1). This way, the final 600 ms preceding the silence epoch was equated in terms of the acoustic context, to make the bleed of auditory ERPs into the silence as similar between conditions as possible. Note that in beat-based sequences, a sound could be expected every 600 ms based on the beat, but the surface structure of the rhythmic pattern was unpredictable, due to the random concatenation of patterns.
To create patterns that did not allow for beat-based expectations (“aperiodic” patterns, see Figure 1), the ratios by which the temporal intervals were related were changed to be non-integer (1:1.4:1.4:3:5.2, or 150, 210, 450, and 780 ms respectively). In these patterns, no marked beat was present at unit length four, nor at any other subdivision of the 1800 ms pattern (Bouwer et al., in press), while the patterns were matched to their periodic counterparts in terms of overall length, event density, number of sounds, and grouping structure.
From the aperiodic patterns, two types of sequences were created: memory-based and random sequences. To create sequences allowing for memory-based expectations, we concatenated four identical patterns. To be able to use the data with an EEG-based decoding analysis (Experiment 2), we needed the timing of expectations in the silence to be identical for each sequence, hence we restricted the memory-based sequences to only pattern 1. The use of a single pattern was not only necessary for decoding, but also optimized the experiment for memory-based expectations, since participants only had to memorize one pattern, allowing them to easily form expectations, even if the single sequences were only four patterns long.
For the random sequences, four semi-randomly chosen aperiodic patterns were concatenated. Like for the beat-based sequences, the final pattern was always pattern 1 or 2, equating the final 600 ms of the sequences in terms of acoustics. In the random sequences, the timing of sounds could not be predicted based on the surface structure of the rhythm, nor on the basis of an underlying beat.
A spectral analysis of the stimuli in the range in which a beat can normally be perceived (the delta-range, 0.5-4 Hz) confirmed that in the beat-based sequences, a peak was present at the beat frequency of 1.67 Hz as well as at 3.33 Hz (see Figure 2). The 3.33 Hz peak is a harmonic of the beat frequency, but also the frequency at which participants may perceive subdivisions of the beat (e.g., an extra layer of perceived metrical regularity with a period of 300 ms). In the memory-based and random sequences, the peak at 1.67 Hz was not just smaller in an absolute sense, but also in a relative sense: in the memory-based and, to a lesser extent, random condition, peaks at 2.22 Hz and 3.89 Hz were most prominent in the sound signal.

Ten sequences per condition were generated to base the spectral analysis on. Note that these sequences were identical for the memory-based condition, but semi-random for the beat-based and random conditions. The envelope of each sequence was obtained by performing a Hilbert transform, and subsequently, fft was used to obtain the spectral decomposition and power values were averaged over ten sequences.
Procedure
Participants were tested individually in a dedicated lab at the University of Amsterdam. Upon arrival, participants were provided with information about the experiment, provided informed consent, and were allowed to practice the task. On each trial, a probe tone was presented at 600, 780, 885, 990, 1200, or 1485 ms after the onset of the last tone of the sequence (see Figure 1C). These positions were carefully chosen to represent times at which a tone could be expected based on the beat (600, 1200 ms), based on memory for the pattern (780, 990, 1200 ms), or neither (885, 1485 ms). Note that the latter two probe tones that were unexpected based on the beat (780, 885, 990, and 1485 ms) did not fall on subdivisions of the beat. After the probe tone was presented, participants were asked to judge on a four-point scale (“very poorly”, “poorly”, “well”, “very well”) how well the probe tone fitted the preceding sequence, similar to previous studies investigating the perception of musical meter (Manning, Harris, & Schutz, 2017; Manning & Schutz, 2013; Palmer & Krumhansl, 1990). Participants could respond with four buttons on the armrest of their chair, two on each side. The order of the answer options on the screen in front of the participants was randomized on each trial, to avoid any artefacts of motor preparation in participants that anticipated which answer they would provide. There was no time limit for responses and the next trial started after a response was made.
Each participant was presented with 18 blocks of 30 trials, amounting to 540 trials in total, 180 trials per condition, and 30 trials per probe position for each condition. In each block, only one type of sequence (beat-based, memory-based, or random) could appear to optimize for the formation of expectations. Blocks were semi-randomized, with each type appearing once in a set of three blocks. Sounds were presented through a single speaker positioned in front of the participant using Presentation® software (version 14.9, www.neurobs.com). After completion of the experiment, participants performed the Beat Alignment Task (Iversen & Patel, 2008; Müllensiefen, Gingras, Musil, & Stewart, 2014) to assess their beat perception abilities, and completed the musical training subscale from the Goldsmith Musical Sophistication Index (GMSI) questionnaire to assess their musical training (Müllensiefen et al., 2014). In total, a session lasted two hours.
Statistical analysis
A total of 17280 responses was included in the analysis (32 participants, 3 conditions, 6 probe positions, 30 responses each). To account for the ordinal nature of the Likert-scale responses (Bouwer, Burgoyne, Odijk, Honing, & Grahn, 2018; Carifio & Perla, 2008; Jamieson, 2004), we used a mixed ordinal regression model. With this model, the ordinal responses are normalized, to correct for potential unequal distances between rating points. The results can subsequently be interpreted similar to the results from a normal mixed model regression. Two independent variables and their interaction were included in the model as fixed factors: Condition (beat-based, memory-based, or random), and Probe Position (600, 780, 885, 990, 1200, or 1485 ms). Additionaly, the score on the GMSI musical training questionnaire was included as a continuous variable (Musical Training, as well as its interactions with the two fixed factors. We used a random intercept for each subject to account for between-subject variation.
The initial model showed a significant effect of Probe Position in the random condition, most likely due to recency effects. To assess the effect of Probe Position in the beat-based and memory-based conditions while accounting for recency effects, for each participant we subtracted the mean response in the random condition at each position from the responses in the beat-based and memory-based condition. Subsequently, we submitted the random-baseline-corrected ratings to a second ordinal regression model, with only two levels for the factor Condition (beat-based and memory-based) and without the random intercept for each participant (as the baseline correction already corrected for between-subject variability). For both the original model, and the baseline corrected model, significant interactions were followed up by tests of simple effects, corrected for multiple comparisons using Tukey’s HSD. The statistical analysis was conducted in R (R Development Core Team, 2008). The ordinal mixed model was implemented using the clmm() function from the ordinal package (Christensen, 2019). Subsequently, we used the Anova() function from the car package (Fox & Weisberg, 2019) to look at omnibus effects for the main factors of interest, and the emmeans package (Lenth, 2019) to assess simple effects and compare slopes between conditions.
EEG Experiment 2
Participants
Thirty-two participants (26 women), aged between 19 and 28 years old (M = 23, SD = 2.5) took part in the EEG experiment in exchange for course credit or monetary payment. Due to technical problems, the data from five participants was not recorded correctly. The remaining 27 participants (21 women) were between 19 and 28 years old (M = 23, SD = 2.4). None of the participants reported a history of hearing or neurological problems, and all provided written informed consent prior to commencing the study. The experiment was approved by the Ethics Review Board of the Faculty of Social and Behavioral Sciences of the University of Amsterdam.
Stimuli
The stimuli were identical to those used in Experiment 1. Experiment 2 contained both trials in which a probe tone was presented, and trials in which a 7260 ms sequence was followed by a silence period. The latter were used for EEG analyses, uncontaminated by a probe presentation. The silent period lasted for 2100 ms after the onset of the last sound, providing 300 ms immediately following the final sound to allow for ERPs to mostly return to baseline, and 1800 ms (three full beat cycles) of silence for the analysis. After the silence, the onset of the next sequence was jittered between 25 and 75 ms to prevent carryover of the beat from previous sequences (e.g., the next trial started between 325 and 375 ms after the last beat in the silence, which is not on the beat, nor at a subdivision of the beat).
Procedure
In Experiment 2, participants were presented with 18 blocks of 36 trials, for a total of 648 trials, 216 per condition. For each condition, 162 trials were silence trials, and did not contain a probe tone. Fifty-four trials contained a probe tone. In Experiment 2, probes were only presented at 990, 1200, or 1485 ms after the onset of the last tone of a sequence. We chose to use the last three probe positions, to 1) limit the time for the EEG experiment to prevent fatigue, 2) provide participants with the incentive to form expectations well into the silence period, as a probe tone could appear as late as 1485 ms into the trial, and 3) obtain some measure of whether participants formed expectations, by including positions that were expected based on the beat and memory (1200 ms), based on memory only (990 ms) or neither (1485 ms). To make sure that participants stayed vigilant with regards to the task, in each block, the number of probe trials was varied between 3 and 11. Including breaks, practice trials, the BAT, the GMSI questionnaire, and setting up the EEG equipment, Experiment 2 lasted between 3.5 and 4 hours.
EEG recording
EEG was recorded at 1 kHz using a 64-channel Biosemi Active-Two acquisition system (Biosemi, Amsterdam, The Netherlands), with a standard 10/20 configuration and additional electrodes for EOG channels, on the nose, on both mastoids, and on both earlobes.
EEG analysis
Preprocessing was performed in MATLAB, version 2015a (Mathworks) and EEGLAB, version 14.1.1 (Delorme & Makeig, 2004). Data were offline down-sampled to 256 Hz, re-referenced to linked mastoids, bad channels were removed, and eye-blinks were removed using independent component analysis. Subsequently, bad channels were replaced by values interpolated from the surrounding channels.
ERPs
To assess possible differences in time-domain data caused by expectations, we first looked at ERPs in the silence window. In line with previous research, we may expect climbing neuronal activity, or a CNV, peaking at the moment that participants expect the next event (Breska & Deouell, 2017; Mento, 2013). For beat-based sequences, the strongest expectation for the next event would be at 600 ms after the onset of the last sound (see Figure 1). For memory-based expectations, this would be at 780 ms. For the ERP analysis, the continuous data were filtered using 0.1 Hz high-pass and 40 Hz low-pass finite impulse response filters. Epochs were extracted from the data from −1800 till 2100 ms relative to the onset of the last sound. Epochs with a voltage change of more than 150 microvolts in a 200 ms sliding window were rejected from further analysis. For each participant and condition, epochs were averaged to obtain the ERPs, and ERPs were averaged over participants to obtain grand average waveforms for plotting. All waveforms were initially baseline corrected using the average voltage of a 50 ms window preceding the onset of the last sound of the sequence. This baseline can be regarded as preceding the “cue” (the last event before the onset of the expectation). Such a baseline is customary in CNV analyses. However, visual inspection suggested that this baseline was biased, as baseline correction resulted in an overall shift of the waveform amplitude relative to each other, as also reflected in a significant cluster when comparing beat-based and memory-based conditions that spanned the entire analysis epoch. This was likely caused by the rapid succession of sounds preceding the onset of the silence, which made it impossible to find a clean, unbiased baseline. Therefore, we repeated the analysis without baseline correction, to confirm that the results were not just caused by a noisy baseline.
To assess the presence of differences between conditions in the time-domain waveforms in the silence period, we used cluster-based permutation testing as implemented in the Fieldtrip toolbox (Oostenveld, Fries, Maris, & Schoffelen, 2011). All timepoints from 300 till 1200 ms after the onset of the final sound were included in the analysis (see Figure 1). This excluded a large portion of the ERP response to the final sound, and included both the first expected moments for beat-based (600 ms) and memory-based (780 ms) expectations and additional time to allow for an evaluation of possible return to baseline of the CNV (Breska & Deouell, 2017). Three cluster-based tests were used to compare all three conditions against each other (i.e., beat-based vs. random; memory-based vs. random; beat-based vs. memory-based). Clusters were formed based on adjacent time-electrode samples that were significantly different between conditions, based on dependent samples T-tests and a threshold of p < 0.05. Clusters were subsequently evaluated statistically using permutation tests with 2000 permutations of the data.
Frequency tagging
A strong prediction of entrainment theories is that the entrainment outlasts stimulation with the entraining stimulus. Therefore, we looked at the frequency content of the signal in the silence period, specifically at the three frequencies most prominent in the sound signal: 1.67 Hz (the beat), 2.22 Hz (in the memory-based condition), and 3.33 Hz (subdivisions of the beat). While the spectral analysis of the sound signal (Figure 2) showed a peak at 3.89 Hz, this peak was absent in the EEG signal on visual inspection. We therefore did not include this frequency in the analyses. To obtain the spectrum of the EEG signal in the silence, we used the raw, unfiltered data. Epochs were extracted from the continuous data both from −1800 till 0 ms relative to the onset of the last sound (control window, see Figure 1), and from 300 till 2100 ms relative to the onset of the last sound (silence window, see Figure 1), the latter starting at 300 ms to avoid contamination from the final ERPs. Both windows thus had equal length, both spanning three full cycles of the beat. Epochs with an amplitude change of 250 microvolts or more in a sliding 200 ms window were rejected from further analysis. All epochs were baseline corrected using the mean of the entire epoch. Subsequently, epochs were averaged for each condition separately to obtain the evoked signal, phase locked to the onset of the final sound, and similar to previous studies using frequency tagging to look at beat-based perception (Nozaradan et al., 2011; Nozaradan, Peretz, & Mouraux, 2012).
For each participant and condition separately, the average waveforms were transformed into the frequency domain using an FFT, with the data zero-padded to 4608 samples (NFFT) to obtain a better frequency resolution (0.056 Hz), and importantly, be able to extract data at exactly the frequencies of interest. Note that the zero-padding can only improve the frequency resolution, but not the frequency precision, which by definition with the 1800 ms epochs is limited to 0.55 Hz. While the design of the experiment simply does not allow for a better resolution, the 0.55 Hz does allow us to differentiate between the frequencies of interest, which are 0.55 Hz or more apart. The obtained power values at each frequency were normalized to account for the 1/f distribution of noise, and to account for bleeding into neighboring frequency bins (Nozaradan et al., 2011, 2012). For each frequency, we averaged over 5 bins centered on the frequency of interest (e.g., 1.56 – 1.78 Hz for the beat frequency, 2.11 – 2.33 Hz for the memory-based frequency, and 3.22 – 3.44 Hz for the beat subdivisions). Subsequently, we subtracted the average of neighboring bins four to six on either side (e.g., 1.33 – 1.44 Hz and 1.89 – 2.00 Hz for the beat frequency, 1.89 – 2.00 Hz and 2.44 – 2.56 Hz for the memory-based frequency, and 3.00 – 3.11 Hz and 3.56 – 3.67 Hz for the beat subdivisions).
To statistically test differences between conditions in the evoked power at the frequencies of interest, we used cluster-based permutation tests. First, this avoided bias by selecting only a subset of electrodes, as we used all scalp electrodes, as was done in previous research (Lenc, Keller, Varlet, & Nozaradan, 2018; Nozaradan et al., 2011; Tal et al., 2017). Second, the permutation tests accounted for the non-normal distribution of the data. Like for the ERPs, we ran T-tests comparing the normalized data for all conditions. For each frequency of interest, clusters were formed based on adjacent electrodes with significant differences between conditions based on dependent samples T-tests and a threshold of p < 0.05. Clusters were evaluated using permutation tests with 2000 permutations of the data.
Multivariate decoding
While the frequency tagging approach assesses the frequency content of the evoked signal, and thus phase locking of low frequency oscillations, it does assume stationarity of the sinusoidal signal and considers the average activity in the entire silence window. Most likely however, the low frequency oscillations will decrease in power and become less phase locked over time in the absence of rhythmic input. To examine the dynamics of temporal expectations with high temporal precision, here we used multivariate decoding. Our approach is based on the assumption that temporal expectations are always coupled with feature or spatial expectations (e.g., we cannot predict “when” without also predicting “what”), as suggested by studies showing that we only use temporal expectations to improve perception if we can also predict the content (Morillon et al., 2016) or location (O’Reilly et al., 2008) of an upcoming event. Thus, we expected to be able to decode the representation of the expected sound at expected moments. As the expected moments are different for each condition, this then allows us to decode in the silence window whether participants were previously listening to a beat-based, memory-based, or random sequence.
Using the ADAM toolbox (Fahrenfort, van Driel, van Gaal, & Olivers, 2018), we applied a classification algorithm to high-pass filtered data (0.5 Hz) for each participant using 10-fold cross validation. Using all electrodes, each dataset was split into 10 equally sized subsets. For each subset, a linear discriminant classifier trained on the remaining 9 subsets was tested. As for the permutation tests, we ran all comparisons separately (e.g., beat-based vs. memory-based, beat-based vs. random, and memory-based vs. random). We ran the decoding algorithm while training and testing on each timepoint in a window starting at 1800 ms before the onset of the final sound, and ending at 2100 ms after the onset of the final sound (see Figure 1), creating a temporal generalization matrix of classification accuracy at each possible combination of training and testing time points (King & Dehaene, 2014).
We assessed the dynamics of temporal expectations in two ways following this decoding procedure. First, we examined whether we could decode above chance in the silence which condition sequence participants were listening to before. To do so, we only considered classification when training and testing on the same timepoints (i.e., decoding the diagonal). Second, we examined whether we could observe a pattern of recurrent activity (King & Dehaene, 2014). More specifically, we expected that training at expected times would yield above chance performance when testing at expected times, regardless of whether these time points were the same (e.g., when training at 600 ms, we expected to be able to accurately distinguish the beat-based from the random condition when testing at not just 600 ms, but also at 1200 and 1800 ms, as all these times were on the beat, or similarly expected).
For the diagonal separately, and for the entire training-testing-time matrix, classification accuracies for each comparison of two conditions were submitted to cluster-based permutation tests to assess whether they exceeded the chance level of 0.5. T-tests with a threshold of 0.05 were performed for each timepoint and training-testing time combination, comparing the accuracy to 0.5. Subsequently, observed cluster-sizes were compared to a null distribution of cluster-sizes obtained by 1000 random permutations of the data to assess significance.
Results
Behavioral
Experiment 1
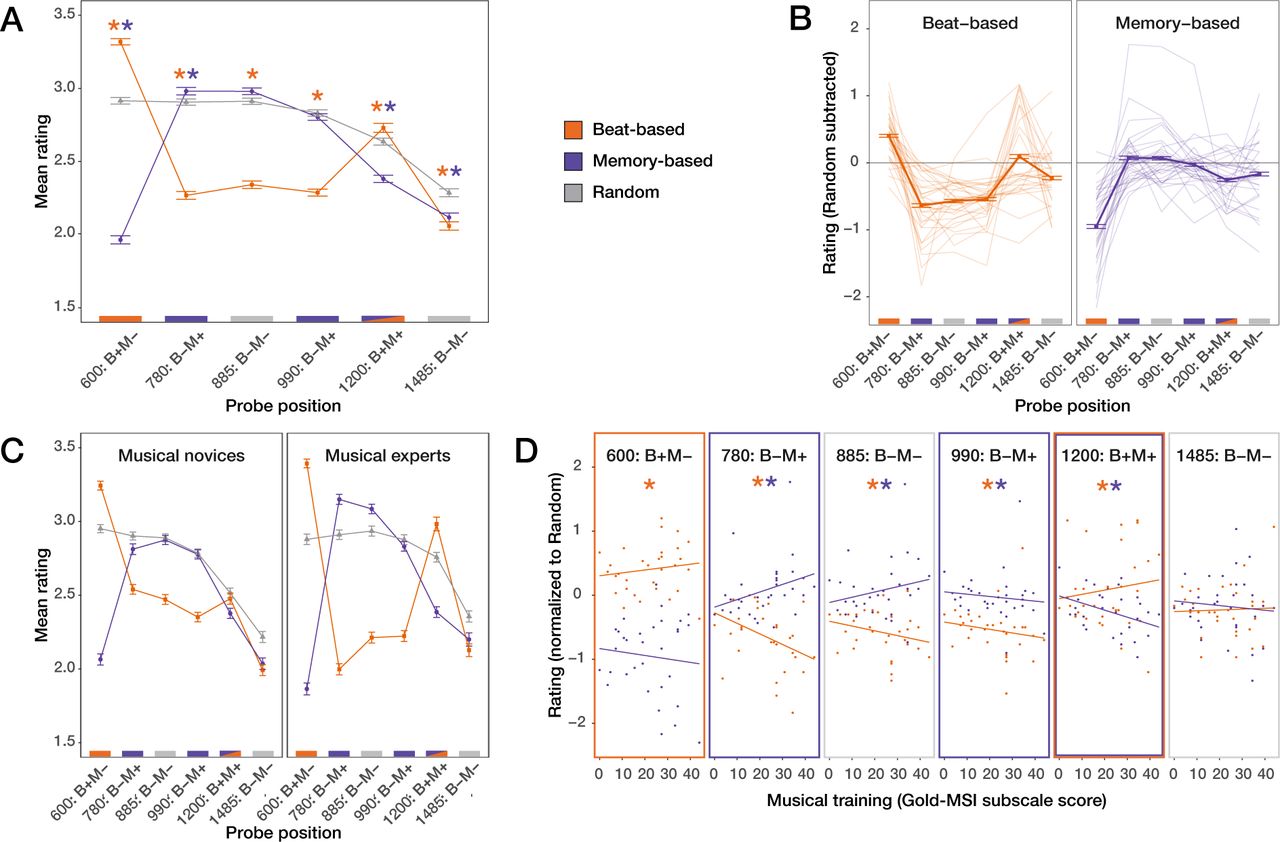
Figure 3A shows the average ratings for each condition and probe position. Visual inspection of this figure suggests that beat based expectations were associated with higher fitness ratings for sounds at expected times than unexpected times for two beat cycles in the silence window (at 600 and 1200 ms), while the effects of memory-based expectations appeared to subside after the first expected time point in the silence window (780 ms). This was confirmed by our statistical analyses. The ordinal regression showed main effects of Condition (χ2(2) = 300.72, p < 0.001), Position (χ2(5) = 1067.05, p < 0.001), as well as Musical Training (χ2(1) = 5.16, p = 0.023). However, crucially, these main effects were accompanied by a very large two-way interaction between Condition and Position (χ2(10) = 2478.98, p < 0.001), showing that the effects of beat-based and memory-based expectations on fitness ratings differed, depending on the position of the probe. We found additional smaller interactions between Position and Musical Training (χ2(5) = 67.26, p < 0.001), Condition and Musical Training (χ2(2) = 6.01, p = 0.05), and, interestingly, Condition, Position, and Musical Training (χ2(10) = 204.88, p < 0.001). Following the interactions, tests of simple main effects showed that the effect of Position was significant in all conditions (all ps < 0.001), and the effect of Condition was significant for all probe positions (all ps < 0.001. The main effect of Position in the random condition showed that even after sequences in which no specific temporal structure was present, ratings depended on the position of the probe. This likely was due to recency effects. To account for these effects when comparing the ratings at different positions in the beat-based and memory-based conditions, we subtracted the ratings in the random condition at each position from the ratings in the other conditions. The baseline corrected model (Figure 3B) showed similar interactions between Position and Condition (χ2(5) = 2147.55, p < 0.001), and between Position, Condition, and Musical Training (χ2(5) = 154.46, p < 0.001). The latter indicated that the correlation between Musical Training and the rating score depended on both the Position and the Condition of the probe tone.

A. Mean ratings for all conditions and positions. Colored stars indicate positions where ratings in the beat-based (orange) and memory-based (purple) conditions differed from the random condition. B. Single participant data, with the random condition subtracted to account for serial position effects. For the beat-based but not the memory-based condition, ratings follow the expectedness pattern, indicated by colored lines on the bottom of the plots (orange: expected based on the beat; purple: expected based on memory; grey: neither). C. Data median split based on scores on the musical training questionnaire. The pattern of results, while present for both groups of participants, is enhanced for musical experts. Note: the median split is for visualization purposes only, the models were run with musical training as a covariate. D. Association between musical training and rating for each condition and position. A positive association was observed for the beat-based condition at 600 and 1200 ms (expected positions) and for the memory-based condition at 780 (expected) and 885 ms (unexpected). Negative associations were observed in the beat-based condition at 780, 885, and 990 ms (all unexpected), and in the memory-based condition at 990 (unexpected) and 1200 ms (expected).
Beat-based expectations
At both 600 ms and 1200 ms (expected in terms of a beat), probes in the beat-based condition were rated as better fitting than probes in the random condition (both ps < 0.001 as evident from the full model). At 780, 885, 990, and 1485 ms (unexpected in terms of a beat), probes in the beat-condition were rated as worse fitting than probes in the random condition (all ps < 0.001). Moreover, within the beat-based condition, at 600 ms, baseline corrected ratings were higher than at any other probe position (all ps < 0.001), and at 1200 ms baseline corrected ratings were higher than at 780, 885, 990, or 1485 ms (all ps < 0.001). Baseline corrected ratings for probes at 780, 885, and 990 ms (all unexpected in terms of the beat) did not differ from each (all ps > 0.38). Probes at 1485 ms (unexpected in terms of the beat) were rated as better fitting than probes at 780, 885, and 990 ms (all ps < 0.001).
As can be seen in Figure 3C and 3D, higher scores on the Musical Training questionnaire were associated with higher fitness ratings in the beat-based condition at 600 and 1200 ms (expected in terms of the beat), but lower fitness ratings at 780, 885, 990, and 1485 ms (unexpected in terms of the beat). Slopes reach significance at all positions except 1485 ms (all ps < 0.002). Also, the association between Musical Training and ratings differed between beat-based and memory-based conditions, at 600, 780, 885, and 1200 ms (all ps < 0.001).
To sum up, for the beat-based sequences, we could observe a clear pattern in the results indicating that beat-based expectations were used to rate the probes well into the silence window, affecting ratings up to 1200 ms after the onset of the last sound. Beat-based expectations lead to higher ratings for expected probes (600 and 1200 ms), and lower ratings for unexpected probes (780, 885, 990, and 1485 ms), both when comparing ratings for each position to the random condition, and when comparing ratings for each position within the beat-based condition. At 1200 ms, these effects resulted in a classic inverted U-curve, as previously associated with beat-based processing (Bauer, Jaeger, Thorne, Bendixen, & Debener, 2015; Jones et al., 2002). The effects of beat-based expectations did diminish over time, as is apparent from differences between ratings at 600 and 1200 ms, and at 1485 ms and other unexpected time points. Both the enhancing and attenuating effects of beat-based expectations were correlated with musical training. It is worth noting that the longer lasting effects of beat-based expectations (at 1200 ms) were very heterogenous in our participant pool. Out of 32 participants, only 18 showed the inverted U, with higher ratings at 1200 than at 990 and 1485 ms.
Memory-based expectations
For memory-based sequences, ratings at 600 ms (unexpected based on the pattern) were lower than for the random sequences (p < 0.001) and lower than at any other position (all ps < 0.001, baseline corrected model), showing that participants also formed predictions based on the sequences. In line with this, at 780 ms (expected in terms of memory), ratings were higher in the memory-based condition than in the random condition (p = 0.009). After this point, ratings did not differ between memory-based and random conditions for probes at 885 and 990 ms, while being lower for memory-based than random conditions at 1200 and 1485 ms (both ps < 0.001). However, ratings at 780 ms did not differ from ratings at 885 ms (unexpected in terms of memory), while being higher than at 990 (expected), 1200 (expected), and 1485 (unexpected) ms (all ps < 0.032). In addition, ratings at 885 and 990 ms were higher than at 1200 and 1485 ms (all ps < 0.001).
As for beat-based expectations, for memory-based expectations, there was a positive association between ratings and musical training at an expected time point (780 ms; p < 0.001), and a negative, albeit nonsignificant, association at an unexpected time point (600 ms; p = 0.08). However, at 885 ms (unexpected in terms of memory), the results behaved like at 780 ms, with higher ratings associated with more Musical Training (p < 0.001). At 990 and 1200 ms, Musical Training was associated with lower ratings (both ps < 0.004), but these results are counterintuitive, as these are expected positions based on the pattern.
The results for memory-based expectations suggest that just like for beat-based expectations, participants were able to predict the timing of probes based on the preceding sequence. However, the results show that while this was still the case at 780 ms after the onset of the last tone, at later probe positions, the effects of memory-based expectations did not reflect the preceding sequence. At 885 ms, the results, both in terms of the ratings and how they were associated with musical training, behaved similar to at 780 ms. This may indicate that the memory-based expectations at this point were not precise enough to differentiate between positions, even when the deviation in time is half the learned interval (105 of 210 ms). After this point, the results suggest that participants did not correctly represent the preceding sequence anymore.
Experiment 2
Figure 4 shows the behavioral results obtained from the EEG experiment. Replicating Experiment 1, we found main effects of Condition (χ2(2) = 92.30, p < 0.001) and Position (χ2(2) = 49.36, p < 0.001), accompanied by interactions between Condition and Position (χ2(4) = 96.62, p < 0.001), and Condition, Position, and Musical Training (χ2(4) = 11.04, p = 0.03). Following the analysis strategy from Experiment 1, we subtracted the ratings from the Random condition from the ratings for the other two conditions, yielding a baseline corrected model with similar interactions (Condition and Position: χ2(2) = 31.46, p < 0.001); Condition, Position, and Musical Training: χ2(2) = 8.29, p = 0.02).

Even with only 18 trials per participant per condition and position, we could replicate the inverted U-curve for beat-based sequences at the end of the silence epoch. Like in Experiment 1, the results for the memory-based condition do not follow the memory-based pattern, but instead, are consistent with building expectations for the next trial.
In line with the preceding beat-based sequences, probes at 990 and 1485 ms (both unexpected times based on the beat) were rated lower in the beat-based condition than in the random and memory-based conditions (all ps < 0.004), and within the beat-based condition, probes at 1200 ms were rated as better fitting than at 990 (p < 0.001) and 1485 ms, though the latter difference did not reach significance. Thus, like in Experiment 1, we found an inverted U-curve at 1200 ms after the final tone, suggestive of beat-based expectations lasting at least two beat cycles. Like in Experiment 1, at 1200 ms (expected based on the beat), higher ratings in the beat-based condition were associated with more musical training (p = 0.008), suggesting that the effects of beat-based expectations correlate with musical expertise. Additionally, probes at 990 ms were rated lower than at 1485 ms (p < 0.001), possibly because the effects of beat-based expectations diminished over the course of the silence.
In the memory-based condition, ratings did not follow the pattern of the preceding sequences. At 990 ms, expected based on the memorized pattern, probes were rated as worse fitting than in the random condition (p < 0.001), and as worse fitting than at 1200 and 1485 ms (both ps < 0.02), while at 1485 ms (unexpected based on the pattern), probes were rated as better fitting than in the random condition, and as better fitting than at 1200 ms (both ps < 0.001). Also, at 1200 ms (expected based on the pattern), higher ratings were associated with less musical training for the memory-based condition (p = 0.01), contrary to what would be expected if the effects of expectations are enlarged in musical experts.
Thus, the behavioral results from Experiment 2, though based on less trials than Experiment 1, suggest a similar pattern as found in Experiment 1: while beat-based expectations exert their effect well into the silence period, with participant faithfully following the expected pattern, memory-based expectations fail to affect ratings in the second half of the silence period in a manner consistent with the learned pattern. Albeit speculatively, the results for the memory-based expectations may be more in line with expectations for the start of the next trial leading to higher ratings for probe positions closer to the end of the silence period, as in Experiment 2, after non-probe trials, the next trial followed each silent period at a somewhat predictable time.
EEG
ERPs
Figure 5 shows the average ERPs for each condition, and scalp topographies for windows in which we found significant clusters. As can be seen in this Figure, a CNV-like frontocentral negativity was observed early in the silence window in the memory-based and random conditions, but not the beat-based condition. Without baseline correction, the random condition elicited a significantly more negative deflection (p = 0.01) than the beat-based condition in a frontocentral cluster between 300 and 614 ms after the onset of the last sound (though note that we did not include timepoints preceding 300 ms in the cluster-based tests). In the same latency range (300 – 473 ms), there was a trend for the memory-based condition to elicit a more negative deflection than the beat-based condition as well (p = 0.08). Thus, in a window between approximately 300 and 450 ms, we found tentative evidence for more negative-going waveforms in both the random and memory-based condition compared to the beat-based condition, with scalp topographies consistent with a CNV (Figure 5B). In a later window, the memory-based condition elicited a second negative deflection, which showed a trend to be larger than in the beat-based condition (p = 0.08, 864 – 1005 ms).

Left panels (A and C) show the grand average waveforms for the silence window for a central electrode cluster (FC1, FCz, FC2, C1, Cz, C2, CP1, CPz, CP2). Time 0 is the onset of the last tone of the sequence. Colored bars on the bottom of the plots, and vertical orange and purple lines, indicate at which times a tone would be expected based on the beat (light orange) and memory (light purple). Note that these are expected times, but no sounds were played during the window shown after time 0. Right panels (B and D) show the scalp distributions for window in which a significant cluster was observed.
With the more traditional pre-cue baseline (Figure 5C and 5D), there was a trend for the random condition to elicit a more negative deflection than the beat-based condition (p = 0.06, 300 – 446 ms) and for the memory-based condition to elicit a more negative deflection than the random condition (early window: p = 0.08, 380 – 551 ms; later window: p = 0.02, 774 – 1200 ms). Note that a significant cluster spanning the entire analysis window of 300 – 1200 ms was found when comparing between the memory-based and beat-based condition with baseline correction (p = 0.01), indicative of a possible overall shift due to a biased baseline. However, while the results were somewhat different depending on the choice of baseline, the overall picture is the same, with significant clusters in an early and later window, and negative deflections with a frontocentral scalp distribution consistent with a CNV for the memory-based and random but not the beat-based condition.
Frequency tagging
In Figure 6, the average power for all electrodes and separately for each condition in the control (during the auditory sequence) and silence windows is depicted. In the control window, the frequency response followed the sound input. That is, at the beat frequency (1.67 Hz), significant clusters (see Figure 7A) indicated higher power in the control window for the beat-based sequences than the memory-based (p < 0.001) and random (p = 0.006) sequences. At 2.22 Hz (Figure 7B), prominent in the memory-based and random sound sequences, higher power was observed in the EEG signal in the memory-based than beat-based (p = 0.02) and random (p = 0.02) sequences, and higher power was observed in the random than beat-based sequences (p = 0.04). Finally, at 3.33 Hz (subdivisions of the beat, Figure 7C), power in the control window was larger for the beat-based than memory-based (p = 0.01) and random (p = 0.005) conditions. Thus, in the control window, the EEG signal reflected the spectral properties of the sound signal, as can be expected, since each sound will have elicited an ERP, which are represented in steady-state potentials, and thus picked up by the frequency analysis.

In the control window, during auditory stimulation, peaks can be observed at all frequencies of interest, and for the relevant conditions (e.g., 1.67 and 3.33 Hz in the beat-based condition, and 2.22 Hz in the memory-based condition). In the silence window, the peaks at 1.67 and 3.33 Hz are larger in the beat-based condition than in the memory-based and random conditions, while peaks at 2.22 Hz do not differ between conditions. This suggests that only beat-based expectations persisted in the silence window.


Electrodes contributing to significant clusters are highlighted below each plot.
Average power (all electrodes)
Importantly, during the silence, no significant clusters were found at 2.22 Hz (Figure 7B), but at the beat frequency (1.67 Hz, Figure 7A), power was significantly larger for the beat-based than the memory-based (p = 0.01) and random (p = 0.01) conditions. In addition, at 3.33 Hz (Figure 7C), power for the beat-based condition was larger than for the memory-based condition (p = 0.04), with a trend when comparing the beat-based with the random condition (p = 0.08). Thus, while the memory-based and random conditions showed tracking of the sound during stimulation (which is sometimes considered entrainment “in the broad sense” (Obleser & Kayser, 2019)), in the silence, entrainment was only present for the beat-based condition. This finding fits our behavioral observations that beat-based expectations persisted longer in the silence than memory-based expectations. Note however that like for the behavioral results indicative of entrainment (the inverted U-curve following beat-based sequences), there was a large heterogeneity between participants (see Figure 7). While the power differences came out as significant in the overall cluster-based analyses, out of 27 participants, only 16 showed on average (over all electrodes) larger power in the beat-based condition at the beat frequency when compared to both the random and memory-based condition.
Multivariate decoding
Finally, to examine the dynamics of temporal expectations with high temporal precision, we conducted a multivariate decoding analysis. Figure 8 shows the decoding accuracy on the diagonal (e.g., training and testing on the same timepoints) for the silence window, and Figure 9A shows the temporal generalization matrices for each comparison, including the control window. On the diagonal, decoding was significantly better than chance for all three comparisons (beat-based vs. random: 1045 - 1670 ms and 1763 – 2076 ms, both ps < 0.007; memory-based vs. random: 13 – 357 ms and 607 – 1763 ms, both ps < 0.006; beat-based vs. memory-based: 763 - 1451 ms and 1545 – 1763 ms, both ps < 0.02). Thus, based on the silence window alone, the classifier was able to learn which type of sequences participants had heard before. However, looking at the temporal generalization matrices, it becomes apparent that this above-chance decoding was not due to recurrent activity for expected events. Only clusters on the diagonal were significant for each comparison (Figure 9A), suggesting that the decoding mainly picked up on task-related differences (e.g., possible different strategies used by participants, depending on the type of sequences). This is also apparent from the fact that, apart from right after the onset of the last sound, decoding for all three comparisons was best in the time window where probes were presented (990 – 1485 ms), and a direct comparison of decoding accuracy on the diagonal of beat-based vs. random and memory-based vs. random comparisons yielded no significant clusters.
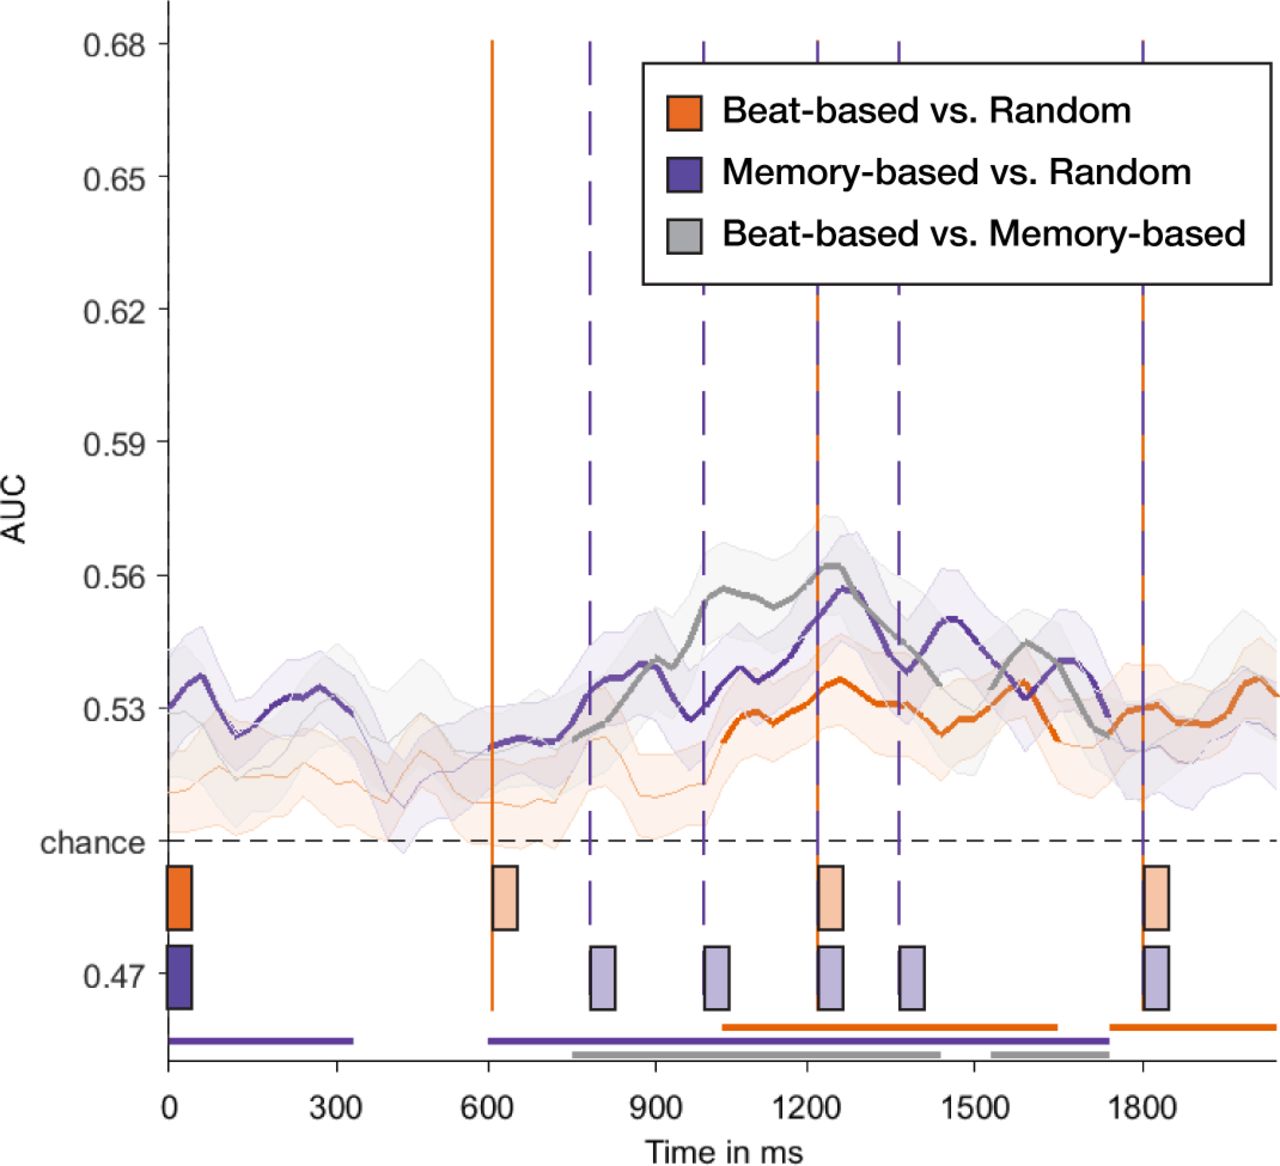
The graph shows decoding accuracy for each comparison for the silence window (starting at time 0, the onset of the final sound of each sequence). Bars on the bottom of the graph, and attached lines, indicate expected times. Horizontal lines on the bottom of the graph indicate clusters of time points where decoding was significantly larger than chance.

A) Temporal generalization matrices for each comparison for the group analysis. The Y-axis shows the training time points, and the X-axis testing time points. Non-significant time points have been masked, only time points that showed significant above chance decoding in the cluster-based analysis are shown in color. Note that the upper right quadrant, highlighted by the black box, is the silence window. B) Temporal generalization matrix for a participant showing recurrent activity following the expected beats. When decoding the beat-based vs. the other two conditions (left- and rightmost plots), peaks in accuracy follow a clear oscillatory pattern, with a phase consistent with the beat-based sequence (600 ms between beats and decoding peaks).
Of note, the decoding results varied considerably between participants. In one participant in particular (Figure 9B), we observed a pattern in the temporal generalization matrix that was consistent with the hypothesized result for an oscillatory process (King & Dehaene, 2014). However, even though some other participants also showed recurrent activity, the exact times of most accurate decoding, and the exact period of the recurrent process, differed widely between participants, obscuring these effects in the grand averages. These individual differences may be caused by individual preferences for a level of regularity in the beat-based stimuli (Drake, Jones, & Baruch, 2000), with some people attending mostly to the beat level (1.67 Hz), but others possibly attending to subdivisions (3.33 Hz) or the level of the meter (0.83 Hz). Also, for different people, the optimal phase of delta oscillations (e.g., the phase that aligns with expected moments) may differ (Breska & Deouell, 2017; Henry & Obleser, 2012), possibly causing optimal decoding at different time points.
Discussion
In the current study, we aimed to identify and directly compare the neural mechanisms underlying temporal expectations based on a regular beat, and temporal expectations based on learning a predictable pattern, by examining the development of climbing activity and the persistence of neural entrainment after cessation of rhythmic input with either a regular beat, a predictable pattern of temporal intervals, or random timing. We found several indications that point to separate mechanisms for beat-based and memory-based expectations. First, behaviorally, we found that while the effects of beat-based expectations lasted for at least two beat cycles, the effects of memory-based expectations subsided after the first expected moment in time. Second, while memory-based expectations elicited a CNV component in the evoked potential, this negative deflection was absent for beat-based expectations. Third, we observed significantly more power at the beat frequency in the silence window when participants were previously listening to a beat-based sequence as compared to a memory-based or random sequence. The observed longer lasting behavioral effects of beat-based compared to memory-based expectations, and increased oscillatory power at the beat frequency following beat-based but not memory-based sequences both point towards entrainment underlying beat-based, but not memory-based expectations. The time-domain results showing a CNV for memory-based, but not beat-based sequences suggest that the former may rely on climbing neuronal activity. These findings provide support for the notion that beat-based and memory-based expectations rely on different neural mechanisms (Breska & Deouell, 2017), but not for models that assume shared mechanisms, be it entrainment (Tichko & Large, 2019), or a general top-down mechanism for temporal expectations (Rimmele et al., 2018).
Behaviorally, for the beat-based condition, we observed a pattern clearly in line with entrainment models, with an inverted U-curve, an indication of entrainment (Bauer et al., 2015; Jones et al., 2002), present as late as 1200 ms after the final tone of each sequence in both experiments. Beat-based expectations thus affected the fitness ratings for at least two beat cycles after the end of the rhythmic pattern, as predicted by nonlinear oscillator models, that assume oscillations are self-sustaining (Large, 2008; Large & Palmer, 2002). Expectations in the beat-based condition not only lead to higher ratings for expected events, but also to lower ratings for unexpected events, when compared to the random and memory-based conditions. Suppression of unexpected events may be metabolically beneficial (van Atteveldt et al., 2015), and as such, has been suggested to be a hallmark of entrainment and the associated “rhythmic” mode of processing (Schroeder & Lakatos, 2009a; Zoefel & Vanrullen, 2017). Indeed, suppression off the beat has even be proposed to be a better indication of beat-based expectations than facilitation on the beat (Bouwer et al., in press; Breska & Deouell, 2017), in line with the current results, where the effects of beat-based expectations at unexpected time points exceeded those at expected time points. Memory-based expectations similarly affected fitness ratings, with enhanced ratings at the first expected time point, and lower ratings at the first unexpected time point, showing that participants did form expectations based on the predictable rhythmic pattern. However, importantly, for the memory-based condition, the results are not suggestive of sustained oscillations, as the effects of expectations subside after the first expected moment.
Both the effects of beat-based and memory-based expectations were associated with musical training. This is consistent with a large body of research looking at the association between musical training and beat-based perception (Bouwer et al., 2018; Bouwer, Werner, Knetemann, & Honing, 2016; Cameron & Grahn, 2014; Matthews, Thibodeau, Gunther, & Penhune, 2016; Vuust et al., 2005). The finding that memory-based expectations were also associated with training is in line with a previous study showing that percussionists outperformed non-musicians on a tapping task for both rhythms with and without a regular beat (Cameron & Grahn, 2014), and is not surprising given that musical training affects many aspects of auditory perception (Moreno & Bidelman, 2014). Some previous studies have failed to show differences between musicians and non-musicians, however (Bouwer, Van Zuijen, & Honing, 2014; Geiser et al., 2009; Grahn & Brett, 2007). As argued previously (Bouwer et al., 2018), these differences may be due to differences in task design. In the current study, the task required explicit ratings of how well probes fitted with the preceding rhythm. Performance on such an explicit task may be particularly improved by musical training, as it may provide musically trained participants with additional strategies to perform the task. The use of implicit timing tasks may be a better probe of innate differences in timing abilities, which need not necessarily be related to musical training (Law & Zentner, 2012).
Crucial to entrainment models of beat-based expectations (Haegens & Zion Golumbic, 2018; Henry & Herrmann, 2014; Large, 2008; Large & Jones, 1999; Obleser & Kayser, 2019), we found that power at the beat frequency (1.67 Hz) and its harmonic (3.33 Hz) in the EEG signal during the silence window was larger following beat-based than memory-based or random sequences. Such enhanced power was not found for a frequency inherent to the memory-based sequence (2.22 Hz). Methodologically, our approach has the advantage of sidestepping the issues associated with measuring phase locking during rhythmic stimulation, in particular confounding contributions from tone-evoked responses (Capilla, Pazo-Alvarez, Darriba, Campo, & Gross, 2011; Novembre & Iannetti, 2018; Zoefel et al., 2018). Ongoing oscillations in silence, after sensory input is stopped, are therefore regarded as strong evidence for entrainment (Breska & Deouell, 2017; Haegens & Zion Golumbic, 2018; Obleser & Kayser, 2019; Zoefel et al., 2018). As such, our observation of enhanced power at the beat frequency during silence provides important novel support for the notion that entrainment of low-frequency neural oscillations underlies beat-based perception. However, some caveats remain. First, the Fourier transform assumes stationarity in the oscillating signal, while entrainment models propose a dampening factor to account for decreasing oscillatory power over time (Large, Herrera, & Velasco, 2015). To assess power at specific frequencies over time, wavelet convolution is often used as an alternative, but when using wavelet parameters sufficient to differentiate between the specific frequency of the beat and other low frequency activity (i.e., many wavelet cycles), the temporal resolution becomes too low to disentangle activity during and before the silence. A recently proposed promising alternative, which assesses oscillatory activity in the time domain (Cole & Voytek, 2019), is not very well suited for this specific purpose either, as it requires filtering the signal at the specific frequency of interest, again posing problems for disentangling low frequency oscillations due to the beat, the memory-based pattern, and ongoing ERPs. Currently, state-of-the-art analysis methods thus do not yet provide an easy way of assessing whether low frequency oscillations are a marker of endogenous entrainment (“in the narrow sense”, see Obleser & Kayser, 2019; Zoefel et al., 2018). This issue remains a challenge for future research.
The absence of power at 2.22 Hz following the memory-based sequences suggests that entrainment does not underlie expectations based on learning a pattern, contrary to a recently proposed oscillator model that can capture aspects of memory-based expectations (Tichko & Large, 2019). We can however not delineate between entrainment not underlying memory-based expectations, and oscillatory activity being dampened faster for memory-based than beat-based expectations. Nonetheless, in the time-domain, we found a CNV in the silence window following the memory-based and random sequences, but not the beat-based sequences. The observed differences in the CNV suggest that rather than one entrainment mechanism that may work better for regular than irregular rhythms, an alternative mechanism based on climbing neuronal activity specifically supports formation of memory-based expectations. Contrary to this notion, previous studies did find a CNV peaking at expected times not only for memory-based, but also for beat-based expectations (Breska & Deouell, 2014, 2017; Praamstra et al., 2006). Importantly, the latter studies used isochronous rhythmic sequences to probe beat-based expectations. In isochronous sequences, the repeating identical temporal interval allows for a memory-based strategy as well, which requires learning only one interval. Thus, to probe beat-based expectations without confounding them with memory-based expectations, it is crucial to use non-isochronous sequences (Bouwer et al., in press, 2016). Here, using a beat-based sequence that did not allow for expectations based on simply learning transitional probabilities, we did not observe a CNV, suggesting that a CNV is specific to memory-based, and likely cue-based (Mento, 2013, 2017), temporal expectations.
While previous studies showed that the peak of the CNV coincided with an expected time (Breska & Deouell, 2017; Mento, 2017; Praamstra et al., 2006), here, the peak latency of the CNV was earlier, peaking around 400 ms for the memory-based condition, while the first expected time point in the silence was at 780 ms. This can be explained by assuming that the time course of the CNV indexes temporal expectations in a probabilistic way. While the pattern was fully predictable in the memory-based sequences, it contained several temporal intervals with durations between 150 and 780 ms. The peak at 400 ms may have indexed the average interval presented in the sequence (∼360 ms). This explanation is also supported by the presence of a CNV with a similar time course for the random condition. Like in the memory-based condition, in the random condition, participants could not use a beat-based strategy to perform the task. Thus, they may have attempted to predict the timing of an upcoming sound based on the distribution of the absolute intervals, which while random in terms of transitional probabilities, was on average identical to the memory-based condition. Interestingly, the average interval in the beat-based condition was also 360 ms, but here, the CNV was absent, suggesting that in the presence of a possible beat-based strategy, the brain may operate in a rhythmic mode of processing (Rimmele et al., 2018; Schroeder & Lakatos, 2009a). A second CNV-like peak, around 950 ms, was only present for the memory-based condition but not the random condition. Speculatively, this second peak may be indicative of expectations based on not just the distribution of possible intervals, but also their transitional probabilities, which would predict a sound at 780 ms. The delayed latency of the CNV-like peak compared to the expected time point is consistent with the behavioral results, that show generalization of the effects of expectations at 780 ms to later time points.
Multivariate pattern analysis may provide an alternative way for examining neural entrainment with high temporal precision, as the strength or sharpness of the neural representation of tones may vary over time as a function of temporal expectations (Auksztulewicz et al., 2019, 2018). While we were able to decode above chance from the silence window which type of sequence participants heard, this decoding seemed to primarily reflect general task-related activity. Decoding against the random condition was not better for the beat-based than memory-based condition, and best decoding was observed in the second half of the silence window, where probes could be presented. Also, in the group-average decoding results, we did not observe recurrent activity, as reflected in stronger decoding accuracy at expected time points. Yet, we did show a proof of concept for our approach in at least one participant, who showed a clear oscillatory pattern in decoding accuracy when decoding the beat-based against the other two conditions.
One reason for the failure of finding condition and temporally specific decoding accuracy at the group level is heterogeneity between individuals. People differ in their preferences for a level of regularity in beat-based perception (Drake et al., 2000). In the current experiment, some individuals may have attending mostly to the beat level (1.67 Hz), and others to subdivisions (3.33 Hz) or the level of the meter (0.83 Hz). Also, the optimal phase of delta oscillations (e.g., the phase that aligns with expected moments) may differ across individuals (Breska & Deouell, 2017; Henry & Obleser, 2012), possibly causing optimal decoding at different time points. Finally, while it is often assumed that most people automatically form beat-based expectations (Honing, 2012), recent evidence showed phase locking to speech in only about half of the population (Assaneo et al., 2019). Indeed, in our EEG study, only about two-thirds of the participants behaviorally showed evidence for beat-based expectations in the second half of the silence window. Also, we only observed enhanced power at the beat frequency following beat-based sequences in about half of the participants, in line with individual differences in reliance on beat-based perception. Understanding individual differences in temporal expectations is therefore an important direction for future research, with significant implications for applications of musical rhythm, such as in motor rehabilitation (Dalla Bella, Dotov, Bardy, & Cochen De Cock, 2018).
In summary, we have shown that beat-based and memory-based expectations can be differentiated in terms of their behavioral and neurophysiological effects once sensory input has ceased. These findings suggest that different mechanisms implement temporal expectations based on periodic and aperiodic input streams, with the former based on entrainment of low frequency neural oscillations, and the latter on climbing neural activity indexing a memorized interval.
Footnotes
FLB is supported by an ABC Talent Grant awarded by Amsterdam Brain and Cognition.
HAS is supported by a European Research Council (ERC) starting grant (679399).
References
- 1.↵
- 2.↵
- 3.↵
- 4.↵
- 5.↵
- 6.↵
- 7.↵
- 8.
- 9.↵
- 10.↵
- 11.↵
- 12.↵
- 13.↵
- 14.↵
- 15.↵
- 17.↵
- 18.↵
- 19.↵
- 20.↵
- 21.↵
- 22.↵
- 23.↵
- 24.↵
- 25.↵
- 26.↵
- 27.↵
- 28.↵
- 29.↵
- 30.↵
- 31.↵
- 32.↵
- 33.↵
- 34.↵
- 35.↵
- 36.↵
- 37.↵
- 38.↵
- 39.↵
- 40.↵
- 41.↵
- 42.↵
- 43.↵
- 44.↵
- 45.↵
- 46.↵
- 47.↵
- 48.↵
- 50.↵
- 51.↵
- 52.↵
- 53.↵
- 54.↵
- 55.↵
- 56.↵
- 57.↵
- 58.↵
- 59.↵
- 60.↵
- 61.↵
- 62.↵
- 63.↵
- 64.↵
- 65.↵
- 66.↵
- 67.↵
- 68.↵
- 69.↵
- 70.↵
- 71.↵
- 72.↵
- 73.↵
- 74.↵
- 75.↵
- 76.↵
- 77.↵
- 78.↵
- 79.↵
- 80.↵
- 81.↵
- 82.↵
- 83.↵


