

Abstract
Educational attainment (EA) is influenced by cognitive abilities and by other characteristics and traits. However little is known about the genetic architecture of these “non-cognitive” contributions to EA. Here, we use Genomic Structural Equation Modelling and results of prior genome-wide association studies (GWASs) of EA (N = 1,131,881) and cognitive test performance (N = 257,841) to estimate SNP associations with variation in EA that is independent of cognitive ability. We identified 157 genome-wide significant loci and a polygenic architecture accounting for 57% of genetic variance in EA. Phenotypic and biological annotation revealed that (1) both cognitive and non-cognitive contributions to EA were genetically correlated with socioeconomic success and longevity; and (2) non-cognitive contributions to EA were related to personality, decision making, risk-behavior, and increased risk for psychiatric disorders; (3) non-cognitive and cognitive contributions to EA were enriched in the same tissues and cell types, but (4) showed different associations with gray-matter neuroimaging phenotypes.
Success in school – and in life – depends on skills beyond cognitive ability1–4. Randomized trials of early-life education interventions find substantial benefits to educational outcomes, employment, and adult health, even though the interventions have no lasting effects on children’s cognitive functions5, 6. These results have captured the attention of educators and policy makers, motivating growing interest in so-called “non-cognitive skills”7–9. Among non-cognitive skills suspected to be important for educational success are motivation, curiosity, persistence, and self-control1,10–13. However, questions have been raised about the substance of these skills and the magnitudes of their impacts on life outcomes14.
Twin studies find evidence that non-cognitive skills are heritable3,15–18. Genetic analysis could help clarify the contribution of these skills to educational attainment and elucidate their connections with other traits. A challenge to genetic research is a lack of consistent and reliable measurements of non-cognitive skills in existing genetic datasets19.
To overcome this challenge, we borrowed the strategy used in the original analysis of non-cognitive skills within the discipline of economics20,21: We operationalized non-cognitive skills as a latent variable that reflects the joint influence of all traits other than cognitive ability that contribute to educational attainment. We applied Genomic Structural Equation Modeling (Genomic-SEM)22 to existing GWASs of EA and cognitive performance (CP)23 in order to conduct a GWAS-by-subtraction. This approach allows us to estimate genetic associations with a non-cognitive skills phenotype that was never directly measured.
To evaluate results of the GWAS-by-subtraction of non-cognitive skills, we conducted phenotypic and biological annotation analysis. We used genetic correlation and polygenic score analysis to test genetic associations between non-cognitive skills and an array of socioeconomic and health outcomes, and relevant individual differences suggested by literature from different research fields. We also performed biological annotation analyses in order to identify cell types, tissues, and neurobiological structures that differentially relate to cognitive and non-cognitive skills.
Results
GWAS-by-Subtraction Identifies Genetic Associations with Non-Cognitive Variance in Educational Attainment
The term “non-cognitive skills” was originally coined by economists studying individuals who were equivalent in cognitive ability, but who differed in educational attainment.21 Our analysis of non-cognitive skills was designed to mirror this original approach: We focused on genetic variation in educational outcomes not explained by genetic variation in cognitive ability. Specifically, we applied Genomic Structural Equation Modeling (Genomic-SEM)22 to summary statistics from GWASs of educational attainment (EA)23 and CP23 (Figure 1). Both EA and CP were regressed on a latent factor, which captured genetic variance in CP (hereafter “Cog”). EA was further regressed on a second latent factor capturing genetic variance in EA independent of CP, hereafter “NonCog”. By construction, genetic variance in NonCog was independent of genetic variance in Cog (rg=0). In other words, the NonCog factor represents residual genetic variation in educational attainment that is not accounted for by the Cog factor. These two latent factors were then regressed on individual SNPs, yielding a GWAS of the latent constructs Cog and NonCog.
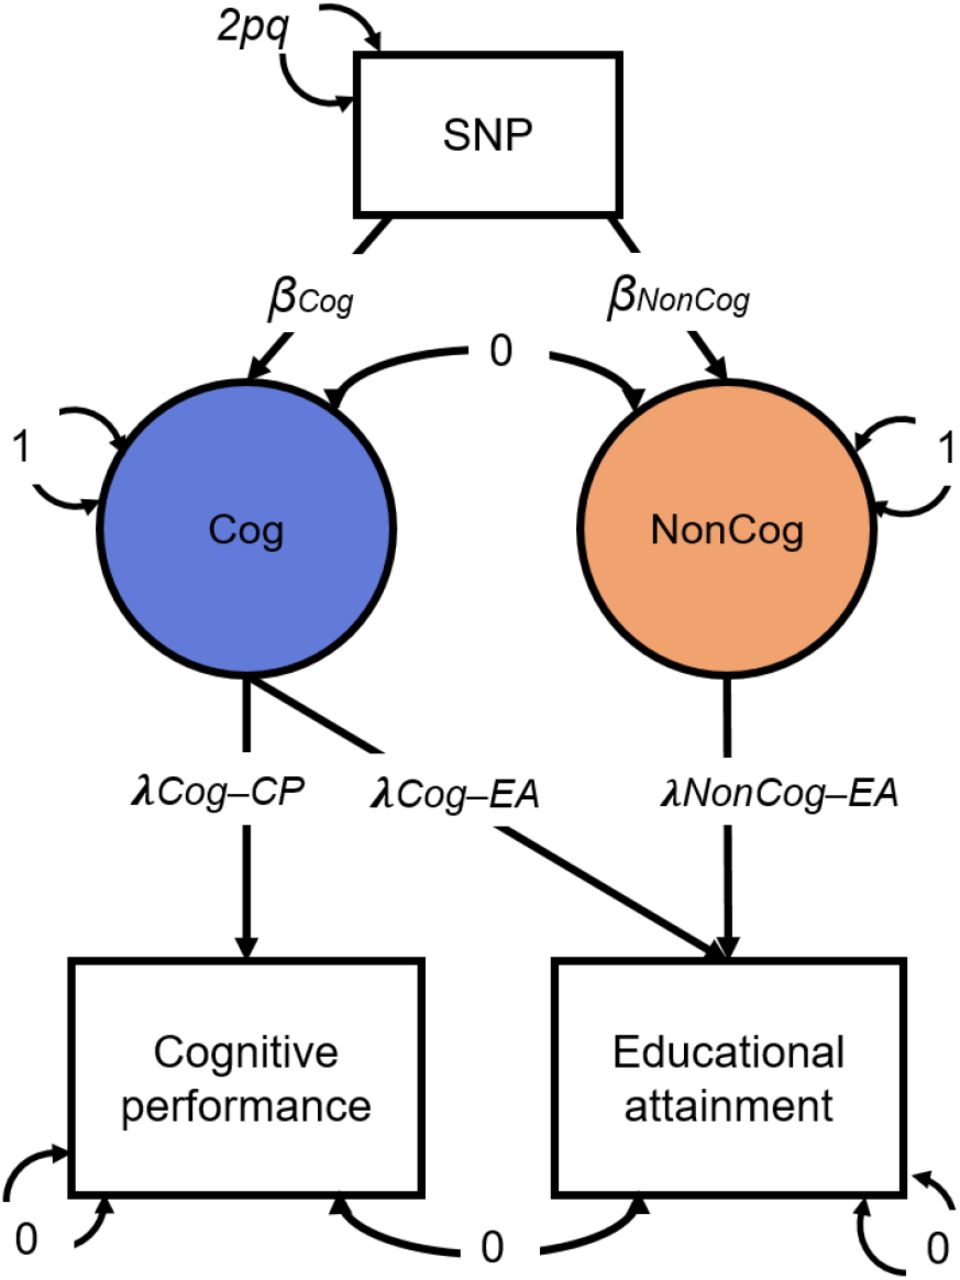
Cholesky model as fitted in Genomic SEM, with path estimates for a single SNP included as illustration. SNP, Cognitive performance (CP) and Educational attainment (EA) are observed variables based on GWAS summary statistics. The genetic covariance between CP and EA is estimated based on GWAS summary statistics for CP and EA. The model is fitted to a 3×3 observed variance-covariance matrix (i.e. SNP, CP, EA). Cog and Non-Cog are latent (unobserved) variables. The covariances between CP and EA and between Cog and NonCog are fixed to 0. The variance of the SNP is fixed to the value of 2pq (p = reference allele frequency, q = alternative allele frequency, based on 1000 Genomes phase 3). The variances of CP and EA are fixed to 0, so that all variance is explained by the latent factors. The variances of the latent factors are fixed to 1. The observed variables CP and EA were regressed on the latent variables resulting in the estimates for the path loadings: λCog-CP=.4465; λCog-EA=.2305; λNonCog-EA=.2432. The latent variables were then regressed on each SNP that met QC criteria.
The NonCog latent factor accounted for 57% of genetic variance in EA. LD Score regression analysis estimated the NonCog SNP-heritability as h2NonCog=.0637 (SE=.0021). After Bonferroni correction, GWAS of NonCog identified 157 independent genome-wide significant lead SNPs (Figure 2) (independent SNPs defined as outside a 250Kb window, or within a 250Kb window and r2 < 0.1). As SNP associations on CP are entirely mediated by the Cog latent factor, results from the GWAS of Cog parallel the original GWAS of CP reported by Lee et al. (2018)23 and are reported in Supplementary Note 1.
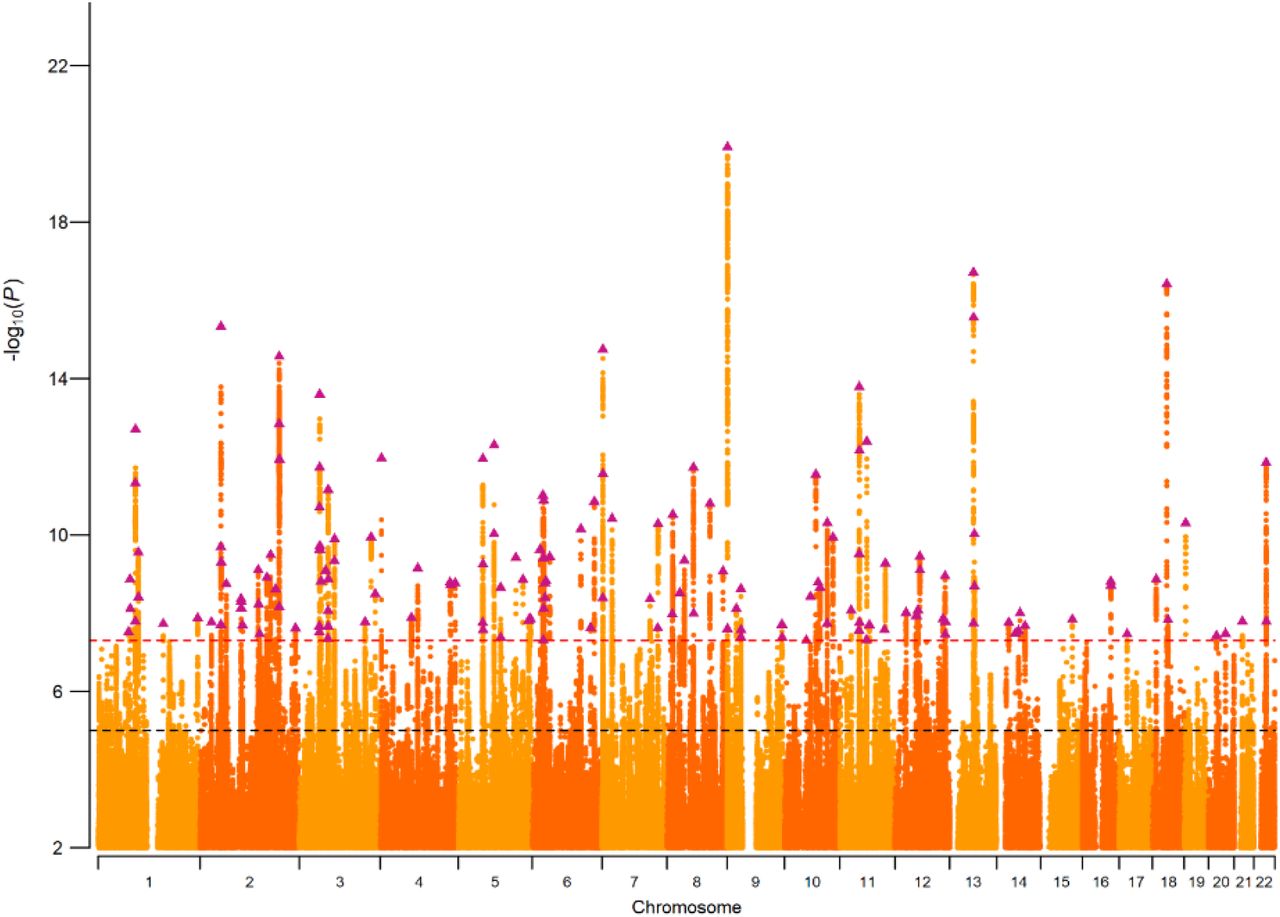
Plot of the −log10(p-value) associated with the Wald test of βNonCog for all SNPs, ordered by chromosome and base position. Purple triangles indicate genome-wide significant (p < 5e10−8) and independent (within a 250Kb window and r2 < .1) associations.
Phenotypic Annotation I: Validating the NonCog Factor
To establish if the Genomic-SEM GWAS-by-subtraction succeeded in isolating genetic variance in education that was independent of cognitive function, we investigated whether NonCog genetically correlated with measures related to educational attainment and cognitive function and compared genetic correlations with Cog. We also confirm these results by conducting polygenic score (PGS) meta-analysis in 6 independent cohorts from the Netherlands (Netherlands Twin Register24 [NTR]), the U.S. (Texas Twin Project25; National Longitudinal Study of Adolescent to Adult Health26 [AddHealth], Wisconsin Longitudinal Study27 [WLS]), New Zealand (Dunedin Longitudinal Study28), and the United Kingdom (E-Risk29). Results reported in this preprint omit polygenic score analysis of the Dunedin and E-Risk cohorts. Effect-sizes for rg and PGS analysis are reported in Figure 3 and Supplementary Figure 2 and Supplementary Tables 4, 5 and 9.

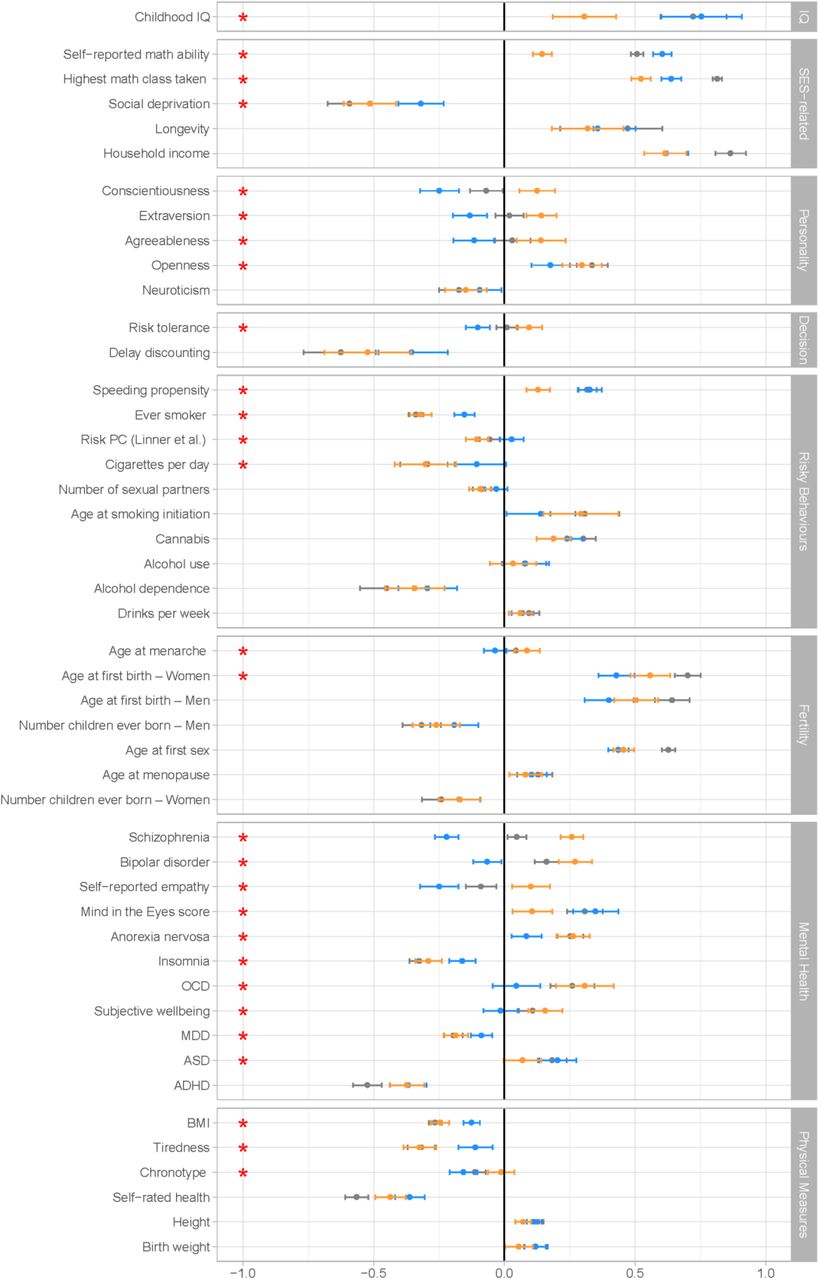
Genetic correlations between NonCog, Cog, and EA and other traits of interest, as estimated with Genomic SEM. Correlations with NonCog are in orange; with Cog in blue; with EA in gray. Error bars represent 95% CIs. The red stars represents a significant (FDR corrected p-value < 0.05) difference in the magnitude of the correlation with Cog versus NonCog. The difference test is based on a chi-squared test associated with a comparison between a model constraining these two correlations to be identical, versus a model where the correlations are freely estimated.

Meta-analytic estimates of the polygenic score associations with cognitive test performance, educational achievement and socioeconomic measures. Cog and NonCog PRS were entered simultaneously in multiple regression. 95% CI are represented by black bars. Cohorts, measures and sample size are detailed in Supplementary Tables 6-9. Traits were measured in different cohorts: Full scale IQ in WLS, Texas twins and NTR (N=2815); Reading and Mathematics Achievement in AddHealth, Texas Twins and NTR (N=9274-10474); Educational Attainment in AddHealth, WLS, and NTR (N=21365); Occupation in AddHealth (N=5527); Parental SES in Texas Twins (N=566).
NonCog genetics have weaker associations with cognitive functions as compared to Cog genetics. NonCog and Cog were both genetically correlated with childhood IQ30; however, the magnitude of NonCog rg was less than half the rg for Cog (NonCog rg=0.31 (SE=.06), Cog rg=0.75 (SE=.08), pdiff_fdr<.0001). Of the total genetic correlation between childhood IQ and EA, 31% of the variance was explained by NonCog and 69% by Cog. In PGS analysis in the NTR and Texas Twin cohorts (N=2,815), effect-sizes for associations with IQ were smaller for NonCog as compared to Cog (NonCog β=.13 (SE=.01), Cog β=.25 (SE=.03); pdiff<.0001; Dunedin and E-Risk analysis pending). Sensitivity analyses of tests measuring different dimensions of cognitive function are reported in Supplementary Figure 2. These results confirm that NonCog genetic associations with cognitive test performance, while greater than zero, are of smaller magnitude as compared to EA or Cog genetics.
NonCog genetics have weaker associations with young people’s academic abilities/skills as compared to Cog genetics
We next tested if NonCog was genetically associated with academic abilities that contribute to educational attainment. NonCog rg with self-reported math ability was positive and statistically different from zero, but smaller in magnitude as compared to Cog (NonCog rg=0.15 (SE=.02), Cog rg=0.61 (SE=.02), pdiff_fdr<.0001). In Genomic-SEM analysis, NonCog explained 22% of the rg between EA and math ability. In PGS analysis in the NTR, Texas-Twin, and AddHealth cohorts, NonCog and Cog polygenic scores were associated with reading and math skills, although effect-sizes were smaller for NonCog than for Cog (for reading: NonCog β=.14 (SE=.03), Cog β=.20 (SE=.02), pdiff=.0032, N=9,274; for math: NonCog β=.17 (SE=.03), Cog β=.26 (SE=.01), pdiff<.0001, N=10,474). These results suggested that NonCog skills are related to educational attainment in part through pathways other than the development of specific academic skills/abilities.
NonCog genetics have similar associations with academic achievement as compared to Cog genetics
In contrast to difference between NonCog and Cog genetic correlations with self-reported math ability, genetic correlations were more similar for achievement in math education (self-report of most advanced math course taken: NonCog rg=0.52 (SE=.02), Cog rg=0.64 (SE=.02), pdiff_fdr<.0001). In Genomic SEM analysis, NonCog accounted for 48% of the rg between EA and math achievement.
Findings were parallel for analysis of educational attainment. To compute rg among NonCog, Cog, and educational attainment, we re-ran the Genomic-SEM model using summary statistics that omitted the 23andMe sample from the EA GWAS. We then computed the rg between NonCog (estimated without 23andMe) and EA in the 23andMe sample. NonCog was more strongly associated with EA than was Cog (NonCog rg =.71 (SE=.02), Cog rg=.57 (SE=.02), pdiff < .0001). In PGS analysis based on the full Genomic-SEM model including 23andMe, effect-sizes for associations with educational attainment were similar for NonCog and Cog (AddHealth, WLS and NTR meta-analysis NonCog β=.22 (SE=.03), Cog β=.22 (SE=.02), pdiff=.63, total N=21,365; Dunedin and E-Risk analysis pending).
NonCog genetics have similar associations with socioeconomic attainment and longevity as compared to Cog genetics
The public-health significance of educational attainment is partly due to its relationship with long-term economic and health outcomes31,32. We therefore tested if NonCog was related to these long-term outcomes and if magnitudes of associations were similar to those for Cog.
Socioeconomic Attainment
In genetic correlation analysis, NonCog was as strongly – or more strongly – associated with socioeconomic attainment outcomes, as compared to Cog (for income33, NonCog rg=.62, (SE=.04), Cog rg=.62 (SE=.04), pdiff_fdr=.95; for neighborhood deprivation33, NonCog rg=−.51 (SE=.05), Cog rg=−.32 (SE=.04), pdiff_fdr=.001). NonCog explained 53% of the EA rg with income and 65% of the EA rg with neighborhood deprivation. In PGS analysis in the AddHealth cohort (N=5,527), NonCog and Cog PGS showed similar associations with occupational attainment (NonCog β=.20 (SE=.01), Cog β=.20 (SE=.02), pdiff=.865; Dunedin analysis pending).
Longevity
We estimated rg with longevity as proxied by parental lifespan34. Genetic correlations were similar for NonCog and Cog (NonCog rg=.32 (SE=.07); Cog rg=.36 (SE=.07); pdiff_fdr=.71). In Genomic-SEM analysis, NonCog explained 50% of the rg between EA and longevity.
In sum, validation analysis found NonCog genetics were less-related to cognitive- and academic-ability phenotypes as compared to Cog genetics, but showed comparable associations with academic-, economic- and health-attainment phenotypes. These findings are consistent with GWAS-by-subtraction analysis having identified genetic influences on non-cognitive skills important to achievement in school and beyond.
Phenotypic Annotation II. Exploring Genetic Correlates of the NonCog Factor
Our next set of phenotypic annotation analyses investigated connections between the NonCog factor and phenotypes linked with non-cognitive skills within the disciplines of economics and psychology (Figure 3).
NonCog genetics were associated with decision-making preferences
In economics, non-cognitive influences on achievement and health are often studied in relation to decision-making preferences35–38. NonCog was genetically correlated with higher levels of comfort with risk-taking39 (risk tolerance rg=.10 (SE=.03)) and willingness to forego immediate gratification in favor of a larger reward at a later time40 (delay discounting rg=−.52 (SE=.08)). In contrast, Cog was genetically correlated with generally more cautious decision-making characterized by lower levels of risk tolerance (rg=−.35 (SE=.07), pdiff_fdr<.0001) and moderate delay discounting (rg=−.10 (SE=.02), pdiff_fdr=.0852).
NonCog genetics were associated with less risky health behavior and delayed fertility
An alternative approach to studying non-cognitive skills in economics and other social sciences is to infer individual differences in non-cognitive skills from patterns of risk behavior. In genetic correlation analysis of obesity41, substance use39,42–45, and sexual behaviours and early fertility39,46,47, NonCog was consistently genetically correlated with lower levels of risk (rg range .2-.5), with the exception that the rg with alcohol use was not different from zero and rg with cannabis use was positive. Genetic correlations for Cog were generally in the same direction but of smaller magnitude.
NonCog genetics were associated with a broad spectrum of personality characteristics linked with social and professional competency
In psychology, non-cognitive influences on achievement are conceptualized as personality traits, i.e. patterns of stable individual differences in emotion and behavior. The model of personality that has received the most attention in genetics is a five-factor model referred to as the Big-5. Genetic correlation analysis of the Big-5 personality traits48–50 revealed NonCog genetics were most strongly associated with Openness to Experience (being curious and eager to learn; rg=.30 (SE=.04)) and were further associated with a pattern of personality characteristic of changes that occur as people mature in adulthood51. Specifically, NonCog showed a positive rg with Conscientiousness (being industrious and orderly; rg=.13 (SE=.03)), Extraversion (being enthusiastic and assertive; rg=.14 (SE=.03)), and Agreeableness (being polite and compassionate; rg=.14 (SE=.05)), and negative rg with Neuroticism (being emotionally volatile; rg=−.15 (SE=.04)). Genetic correlations of Cog with Openness to Experience and Neuroticism were similar to those for NonCog (pdiff_fdr-Openness=.0414, pdiff_fdr-Neuroticism=.4821). In contrast, genetic correlations of Cog with Conscientiousness, Extraversion, and Agreeableness were in the opposite direction (rg=−.12 to −.25, pdiff_fdr<.0005).
We conducted PGS analysis of Big-5 personality in the NTR, Texas Twin, AddHealth, and WLS cohorts (N = 21,203 - 21,290 across personality traits) (Supplementary Figure 3). NonCog PGS associations with personality traits paralleled genetic correlations, but were smaller in magnitude and were statistically different from zero at the alpha=0.05 threshold only for Openness (meta-analytic β=.13 (SE=.02)) and Agreeableness (meta-analytic β=.04 (SE=.02)). Also parallel to genetic correlation analysis, the Cog PGS associations with openness and neuroticism were in the same direction but smaller in magnitude as compared to NonCog associations, and were in the opposite direction for conscientiousness, extraversion, and agreeableness, although only associations with openness, conscientiousness, and neuroticism were statistically different from zero at the alpha=0.05 level (meta-analytic βNeuroticism=−.05, pdiff=<.0001; βOpenness=.08, pdiff=.152; βConscientiousness=−.03, pdiff=.001).
NonCog genetics were associated with higher risk for multiple psychiatric disorders
In clinical psychology and psychiatry, research is focused on mental disorders. Mental disorders are generally associated with phenotypic impairments in academic achievement and social role functioning,52,53 but positive genetic correlations with educational attainment and creativity have been reported for some disorders54,55. We therefore tested NonCog rg with psychiatric disorders based on published case-control GWAS56–62. NonCog was associated with higher risk for multiple clinically-defined disorders including anorexia nervosa (rg=.26 (SE=.04)), obsessive-compulsive disorder (rg=.31 (SE=.06)), bipolar disorder (rg=.27 (SE=.03)), and schizophrenia (rg=.26 (SE=.02)). Genetic correlations between Cog and psychiatric disorders were either much smaller in magnitude (anorexia nervosa rg=.08 (SE=.03), pdiff_fdr<.001; obsessive-compulsive disorder rg=.05 (SE=.05), pdiff_fdr<.01) or in the opposite direction (bipolar disorder rg=−.07 (SE=.03), pdiff_fdr<.001; schizophrenia rg=−.22 (SE=.02), pdiff_fdr<.001). Both NonCog showed negative genetic correlations with attention-deficit/hyperactivity disorder (NonCog rg=−.37 (SE=.03), Cog rg=−.37 (SE=.04), pdiff_fdr=.95).
In sum NonCog genetics were associated with phenotypes from economics and psychology thought to mediate non-cognitive influences on educational success. These associations contrasted with associations for Cog genetics, supporting distinct pathways of influence on achievement in school and later in life. Opposing patterns of association were also observed for psychiatric disorders, suggesting that the unexpected positive genetic correlation between educational attainment and mental health problems uncovered in previous studies arises from non-cognitive genetic influences on educational attainment.
Biological Annotation Analysis Reveal Shared and Specific Neurobiological Correlates NonCog and Cog genetics were enriched in similar tissues and cells
We tested whether common variants in genes specifically expressed in 53 GTEx tissues63 or in 152 tissues captured in a previous aggregation of RNA-seq studies64,65 were enriched in their effects on Cog or NonCog. Genes predominantly expressed in the brain rather than peripheral tissues were enriched in both NonCog and Cog (Supplementary Table 10).
To examine expression patterns at a more granular level of analysis, we used MAGMA66 and stratified LD score regression67 to test enrichment of common variants in 265 brain cell-type-specific gene-sets68. In MAGMA analysis, common variants in 95 of 265 gene-sets were enriched for association with NonCog. The enriched cell-types were predominantly neurons (97%), with enrichment most pronounced for telencephalon-projecting neurons, di- and mesencephalon neurons, and to a lesser extent, telencephalon interneurons (Supplementary Figure 4 and Table 12). As measured by correlation between Z-statistics, enrichment for Cog was similar to NonCog (r=.85) and there were no differences in cell-type-specific enrichment, suggesting little differentiation between cognitive ability and non-cognitive traits at the level of cell-type (Supplementary Figure 5). Stratified LDSC results were similar to results from MAGMA (Supplementary Note 2, Supplementary Figure 6 and Table 13). While the same gene-sets, based on scRNA-seq expression in neuronal cell-types, are enriched for NonCog and Cog, gene-level analysis69 (Supplementary Note 3) confirms the specific genes driving this enrichment do not necessarily affect the two traits in the same direction.
NonCog and Cog genetics show diverging associations with total and regional brain volumes
EA is genetically correlated with greater total brain volume70,71. We therefore compared the rg of NonCog and Cog with total brain volume and with 100 regional brain volumes (99 gray matter volumes and white matter volume) controlling for total brain volume (Supplementary Table 15)72. For total brain volume, genetic correlation was stronger for Cog as compared to NonCog (Cog rg=.22 (SE=.04), NonCog rg=.07 (SE=.03), pdiff=.005). Total gray matter volume, controlling for total brain volume, was not associated with either NonCog or Cog (NonCog: rg=.07 (SE=.04); Cog: rg=.06 (SE=.04)). For total white matter volume, conditional on total brain volume, genetic correlation was negative and stronger for NonCog as compared to Cog (NonCog rg= −.12 (SE=.04), Cog (rg=−.01 (SE=.04), pdiff=.04).
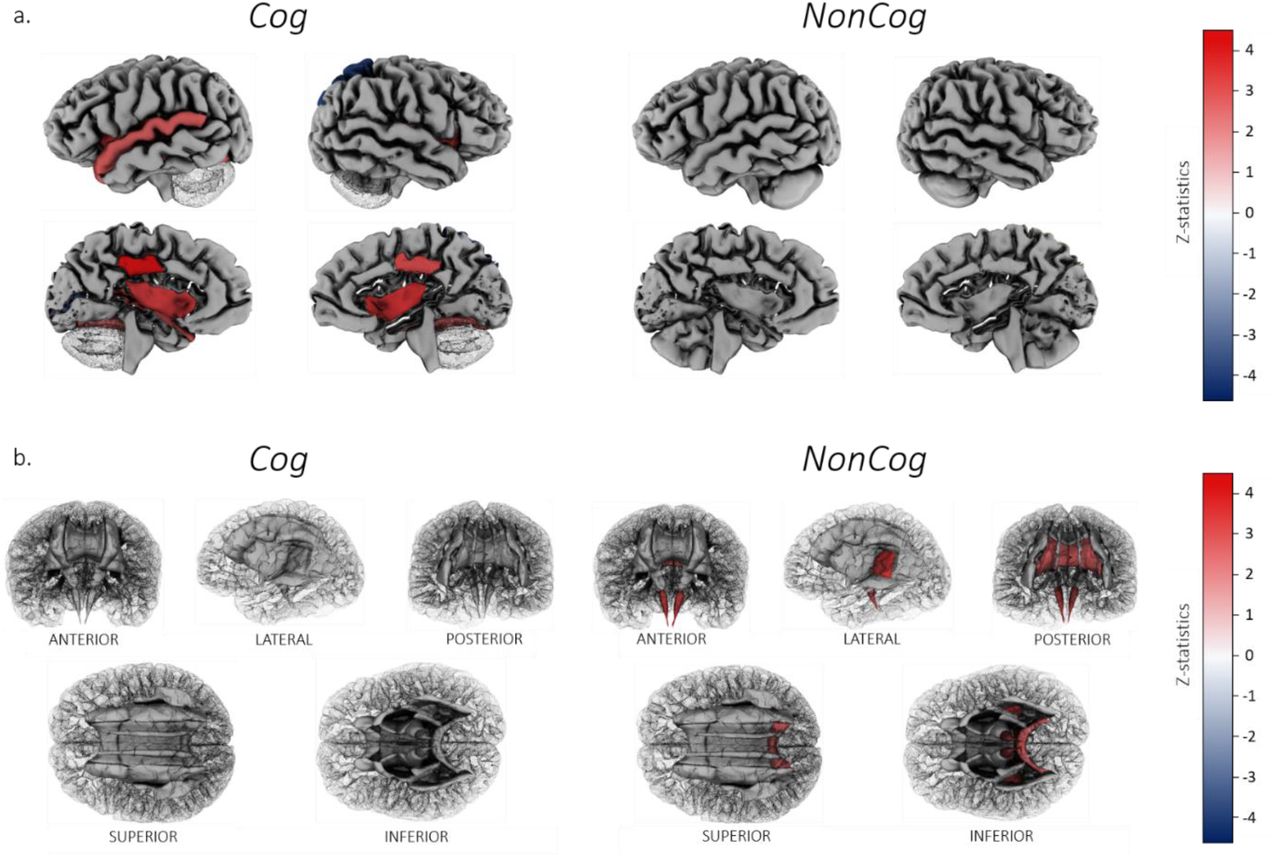
NonCog was not associated with any of the regional gray-matter volumes after FDR correction. In contrast, Cog was significantly associated with regional gray-matter volumes for the bilateral fusiform, insula and posterior cingulate (rg range .11-.17), as well as left superior temporal (rg=.11 (SE=.04)), left pericalcarine (rg=−.16 (SE=.05)) and right superior parietal volumes (rg=−.22 (SE=.06)) (Figure 5).
a. Cortical patterning of FDR-corrected significant genetic correlations with regional gray matter volumes for Cog versus NonCog, after correction for total brain volume. Regions of interest are plotted according to the Desikan-Killiany-Tourville atlas, shown on a single manually-edited surface (Klein & Tourville, 2012; http://mindboggle.info). Cog showed significant associations with gray matter volume for the bilateral fusiform, insula and posterior cingulate, the left superior temporal and left pericalcarine and right superior parietal volumes. NonCog was not associated with any of the regional brain volumes.
b. White matter tract patterning of FDR-corrected significant genetic correlations with regional mode of anisotropy (MO) for Cog versus NonCog. White matter tract probability maps are plotted according to the Johns Hopkins University DTI atlas (https://neurovault.org/). Cog was not associated with regional MO. NonCog showed significant associations with MO in the corticospinal tract, the retrolenticular limb of the internal capsule and the splenium of the corpus callosum.
NonCog and Cog genetics were weakly associated with white matter microstructure
We tested genetic correlation of NonCog and Cog with white matter tract integrity as measured using diffusion tensor imaging (DTI)73. Analyses included 5 DTI parameters in each of 22 white matter tracts (Supplementary Table 16): fractional anisotropy (FA), mean diffusivity (MD), axial diffusivity (AD), radial diffusivity (RD), and mode of anisotropy (MO).
We first analyzed tract-wide association of NonCog and Cog with the five DTI parameters. Cog was nominally associated with global white matter microstructure for two DTI parameters – average AD (rg=.09 (SE=.04); greater diffusion of water along the principal axis of diffusion) and average MO (rg=.11 (SE=.04); more tubular, as opposed to planar, water diffusion). Only average MO survived FDR correction (q=.014). These genetic correlations did not differ from genetic correlations with the NonCog factor (χ2 p >.324).
Next, we analyzed tract-specific genetic correlations for each of the 5 DTI parameters. NonCog was positively associated with MO in the corticospinal tract (rg=.14 (SE=.05)), retrolenticular limb of the internal capsule (rg=.12 (SE=.04)) and splenium of the corpus callosum (rg=.10 (SE=.04); Figure 5), whereas the Cog factor was not associated with any specific tracts. However, none of the FDR-significant associations for NonCog were statistically different from associations for Cog (pdiff_fdr=.89-.99), possibly reflecting a lack of power to detect differences in small effects.
Discussion
GWAS of non-cognitive influences on educational attainment (EA) identified 157 independent loci and polygenic architecture accounting for more than half the genetic variance in EA. In genetic correlation and PGS analysis, these non-cognitive (NonCog) genetics showed similar magnitude of associations with EA, economic attainment and longevity to genetics associated with cognitive influences on EA (Cog). As expected, NonCog genetics had much weaker associations with cognition phenotypes as compared to Cog genetics. These results contribute new GWAS evidence in support of the hypothesis that heritable non-cognitive skills influence educational attainment and downstream life-course economic and health outcomes.
Phenotypic and biological annotation analyses shed light on the substance of heritable non-cognitive skills influencing education. Economists hypothesize that preferences that guide decision-making in the face of risk and delayed rewards represent non-cognitive influences on educational attainment. Consistent with this hypothesis, NonCog genetics were associated with higher risk tolerance and lower time discounting. These decision-making preferences are associated with financial wealth, whereas opposite biases are hypothesized to contribute to a feedback loop perpetuating poverty74. Consistent with results from analysis of decision-making preferences, NonCog genetics were also associated with healthier behavior and later fertility.
Psychologists hypothesize that the Big Five personality characteristics of conscientiousness and openness are the two “pillars of educational success”2,3,75. Our results provide some support for this hypothesis, with the strongest genetic correlation evident for openness. But they also show that non-cognitive skills encompass the full range of personality traits, including agreeableness, extraversion, and the absence of neuroticism. This pattern mirrors the pattern of personality change that occurs as young people mature into adulthood51. Thus, non-cognitive skills share genetic etiology with what might be termed as “mature personality”. The absolute magnitudes of genetic correlations between NonCog and individual personality traits are modest. This result suggests that the personality traits described by psychologists capture some, but not all genetic influence on non-cognitive skills.
Although the general pattern of findings in our phenotypic annotation analysis indicated non-cognitive skills were genetically related to socially desirable characteristics and behaviors, there was an important exception. Genetic correlation analysis of psychiatric disorder GWAS revealed positive associations of NonCog genetics with schizophrenia, bipolar disorder, anorexia nervosa, and obsessive-compulsive disorder. Previously, these psychiatric disorders have been shown to have a positive rg with EA, a result that has been characterized as paradoxical given the impairments in educational and occupational functioning typical of serious mental illness. Our results clarify that these associations are driven by non-cognitive factors associated with success in education. These results align with the theory that clinically-defined psychiatric disorders represent extreme manifestations of dimensional psychological traits, which might be associated with adaptive functioning within the normal range76–78.
Our analysis found little support for the hypothesis that physical attributes, such as attractive appearance, might be associated with academic success because of social biases.79 There are not yet well-powered GWAS of physical attractiveness. However, tissue enrichments for NonCog genetics were found only in the brain and not in any peripheral tissues and genetic correlation with stature, a generally socially desirable physical attribute, were much smaller than for behavioral and psychological phenotypes.
Finally, biological annotation analyses suggest similarities in the cellular mediators of NonCog and Cog influences on educational attainment. In tissue-enrichment analysis, GWAS results for both Cog and NonCog were enriched for gene-sets predominantly expressed in the brain. In gene-set enrichment analysis, there were no statistically significant differences between NonCog and Cog. Thus, while the effects of genetic variation on NonCog and Cog are uncorrelated, the variation resides in the same (functional) regions of the genome that play a role in specific types of neurons. We found some evidence of differences between NonCog and Cog in associations with brain structure: NonCog was more strongly associated with white matter microstructure as compared to Cog, whereas Cog was more strongly associated with gray matter volumes as compared to NonCog. Moderate sample sizes in neuroimaging GWAS mean these results must be treated as preliminary, requiring replication with data from larger-scale GWAS of white-matter and gray-matter phenotypes. Results also illustrate how Genomic-SEM can be used to conduct GWAS of phenotypes not directly measured in large-scale databases, an application that might have broad utility beyond the genetics of educational attainment.
We acknowledge limitations. Genomic-SEM analysis to isolate non-cognitive genetic influences on educational attainment relies on a statistical model of a complex developmental process. Cognitive and non-cognitive skills develop in interaction with one another. For example, the dynamic mutualism hypothesis80 proposes that non-cognitive characteristics shape investments of time and effort, leading to differences in the pace of cognitive development81,82. In Genomic-SEM analysis, the NonCog factor is, by construction, uncorrelated with adult cognition. Thus, the statistical model is an imperfect representation of etiology. Nevertheless, statistical separation of NonCog from Cog, although artificial, allows us to test if heritable traits other than cognitive ability influence educational attainment and to explore what those traits may be. Our finding that NonCog genetics account for roughly half of all genetic variance in EA should motivate future longitudinal studies to collect repeated measures of cognitive and non-cognitive skills in order to study their reciprocal relationship across development83,84.
Our use of Genomic-SEM to perform GWAS-by-subtraction relied on published GWASs of adult cognitive performance and of educational attainment. Biases and limitations in these GWASs will also affect our results. For example, a large portion of data in the cognitive performance GWAS came from UK Biobank, which administered only a limited battery of cognitive tests. This limited battery could fail to capture genetic influences on some cognitive functions, resulting in incomplete separation of cognitive from non-cognitive genetics within the Genomic-SEM analysis. Genomic-SEM analysis of NonCog genetics using data from GWAS with more comprehensive cognitive testing is needed.
In the case of GWAS of educational attainment, the included samples were drawn mainly from Western Europe and the U.S., and participants completed their education in the late 20th and early 21st centuries. The phenotype of educational attainment reflects an interaction between an individual and the social system in which they are educated. Differences across social systems, including education policy, culture, and historical context, may result in different heritable traits having influence on educational attainment85. As a result, the GWAS results for educational attainment and the Genomic-SEM results for non-cognitive skills based on these results may not generalize beyond the times and places when and where GWAS samples were collected. Follow-up analysis in cohorts drawn from other contexts are needed to clarify how findings for NonCog genetics generalize.
Generalization of the NonCog factor is also limited by the homogeneity of ancestry in the educational attainment and cognitive performance GWASs. Analysis included only participants of European descent. Although this restricted sample is necessary given the lack of methods for integrating genome-scale genetic data across populations with different ancestries86,87, it raises a potential threat to external validity. Analysis of (Non)Cog in non-European populations should be a priority following either the conduct of GWAS in other ancestries or the refinement of methods to better integrate data across samples drawn from different ancestries.
Within the bounds of these limitations, our analysis provides a first view of the genetic architecture of non-cognitive skills influencing educational success. These skills are central to theories of human capital formation within the social and behavioral sciences and are increasingly the targets of social policy interventions. Our results establish that non-cognitive skills are central to the heritability of educational attainment and illuminate connections between genetic influences on these skills and social and behavioral science phenotypes.
Methods
Meta-analysis of educational attainment GWAS
We reproduced the Social Science Genetic Association Consortium (SSGAC) 2018 GWAS of educational attainment23 by meta-analyzing published summary statistics for N=766,345 (www.thessgac.org/data) with summary statistics obtained from 23andMe, Inc. (N=365,538). We included SNPs with sample-size > 500,000 and MAF > 0.005 in the 1000 Genomes reference set (10,101,243 SNPs). We did not apply genomic control, as standard errors of publicly available and 23andMe summary statistics were already corrected23. Meta-analysis was performed using METAL88.
GWAS-by-subtraction
The objective of our GWAS-by-subtraction analysis was to estimate, for each SNP, the association with educational attainment that was independent of that SNP’s association with cognition (hereafter, the NonCog SNP effect). We used Genomic-SEM22 to analyze GWAS summary statistics for the educational attainment and cognitive performance phenotypes in the SSGAC’s 2018 GWAS (Lee et al. 201823). The model regressed the educational-attainment and cognitive-performance summary statistics on two latent variables, Cog and NonCog (Figure 1). Cog and NonCog were then regressed on each SNP in the genome. This analysis allowed for two paths of association with educational attainment for each SNP. One path was fully mediated by Cog. The other path was independent of Cog and measured the non-cognitive SNP effect, NonCog. To identify independent lead hits with p <5e-8 (the customary p-value threshold to approximate an alpha value of 0.05 in GWAS), we pruned the results using a radius of 250 kb and an LD threshold of r2 <0.1 (Supplementary Tables 1 and 2).
Genetic correlations
We use Genomic-SEM to compute genetic correlations of Cog and NonCog with other education-linked traits for which well-powered GWAS data were available (SNP-h2 z-score >2; Supplementary Table 3) and to test if genetic correlations with these traits differed between Cog and NonCog. Specifically, models tested the null hypothesis that trait genetic correlations with Cog and NonCog could be constrained to be equal using a chi-squared test with FDR adjustment to correct for multiple testing. The FDR adjustment was conducted across all genetic correlation analyses reported in the article excluding the analyses of brain volumes described below. Finally, we used Genomic-SEM analysis of genetic correlations to estimate the percentage of the genetic covariance between educational attainment and the target traits that was explained by Cog and NonCog using the model illustrated in Supplementary Figure 8.
Polygenic score analysis
Polygenic score analyses were conducted in data drawn from six population-based cohorts from the Netherlands, the U.K., the U.S., and New Zealand: (1) the Netherlands Twin Register (NTR)24,89, (2) E-Risk29, (3) the Texas Twin Project25, (4) the National Longitudinal Study of Adolescent to Adult Health (AddHealth)26,90, dbGaP accession phs001367.v1.p1; (5) Wisconsin Longitudinal Study on Aging (WLS)27, dbGaP accession phs001157.v1.p1; and (6) the Dunedin Multidisciplinary Health and Development Study28. (At the time this preprint was posted, Dunedin and E-Risk analyses were not yet complete and data from these studies is not included in the reported analysis.) Supplementary Tables 6 and 7 describe cohort-specific metrics. Polygenic scores were computed based on weights derived using the LD-pred91 software with an infinitesimal prior and the 1000 Genomes phase 3 sample as a reference for the LD structure. LD-pred weights were computed in a shared pipeline to ensure comparability between cohorts. Each outcome (e.g., IQ score) was regressed on the Cog and NonCog polygenic scores and a set of control variables (sex, 10 principal components derived from the genetic data and, for cohorts in which these quantities varied, genotyping chip and age). In cohorts containing related individuals, non-independence of observations from relatives were accounted for using mixed linear models (MLM), generalized estimation equations (GEE), or by clustering of standard errors at the family level. We used a random effects meta-analysis to aggregate the results across the cohorts. This analysis allows a cohort-specific random intercept. Individual cohort results are in Supplementary Table 8 and meta-analytic estimates in Supplementary Table 9.
Biological annotation
Enrichment of tissue-specific gene expression
We used gene-sets defined in Finucane et al. 201892 to test for the enrichment of genes specifically expressed in one of 53 GTEx tissues63, or 152 tissues captured by the Franke et al. aggregation of RNA-seq studies64,65. This analysis seeks to confirm the role of brain tissues in mediating Cog and NonCog influences on educational attainment. The exact analysis pipeline used is available online (https://github.com/bulik/ldsc/wiki/Cell-type-specific-analyses).
Enrichment of cell-type specific expression
We leveraged single cell RNA sequencing (scRNA-seq) data of cells sampled from the mouse nervous system68 to identify cell-type specific RNA expression. Zeisel et al.68 sequenced cells obtained from 19 regions in the contiguous anatomical regions in the peripheral sensory, enteric, and sympathetic nervous system. After initial QC, Zeisel et al. retained 492,949 cells, which were sampled down to 160,796 high quality cells. These cells were further grouped into clusters representing 265 broad cell-types. We analyzed the dataset published by Zeisel et al. containing mean transcript counts for all genes with count >1 for each of the 265 clusters (Supplementary Table 11). We restricted analysis to genes with expression levels above the 25th percentile. For each gene in each cell-type, we computed the cell-type specific proportion of reads for the gene (normalizing the expression within cell-type). We then computed the proportion of proportions over the 265 cell-types (computing the specificity of the gene to a specific cell-type). We ranked the 12,119 genes retained in terms of specificity to each cell-type and then retained the 10% of genes most specific to a cell-type as the “cell-type specific” gene-set. We then tested whether any of the 265 cell-type specific gene-sets were enriched in the Cog or NonCog GWAS. This analysis sought to identify specific cell-types and specific regions in the brain involved in the etiology of Cog and NonCog. We further computed the difference in enrichment for Cog and NonCog to test if any cell types were specific to either trait. For these analyses, we leveraged two widely used enrichment analysis tools: MAGMA66 and stratified LD score regression67 with the European reference panel from 1000 Genomes Project Phase 3 as SNP location and LD structure reference, Gencode release 19 as gene location reference and the human-mouse homology reference from MGI (http://www.informatics.jax.org/downloads/reports/HOM_MouseHumanSequence.rpt).
MAGMA
We used MAGMA (v1.07b66), a program for gene-set analysis based on GWAS summary statistics. We computed gene-level association statistics using a window of 10kb around the gene for both Cog and NonCog. We then used MAGMA to run a competitive gene-set analysis, using the gene p-values and gene correlation matrix (reflecting LD structure) produced in the gene-level analysis. The competitive gene-set analysis tests whether the genes within the cell-type-specific gene-set described above are more strongly associated with Cog/NonCog than other genes.
Stratified LDscore regression
We used LD-score regression to compute LD scores for the SNPs in each of our “cell-type specific” gene-sets. Parallel to MAGMA analysis, we added a 10kb window around each gene. We ran partitioned LD-score regression to compute the contribution of each gene-set to the heritability of Cog and NonCog. To guard against inflation, we use LD score best practices, and include the LD score baseline model (baselineL2.v2.2) in the analysis. We judged the statistical significance of the enrichment based on the p-value associated with the tau coefficient.
Difference in enrichment between Cog and NonCog
To compute differences in enrichment we compute a standardized difference between the per-annotation enrichment for Cog and NonCog as:

Where eCog is the enrichment of a particular gene-set for Cog, eNonCog is the enrichment for the same gene-set for NonCog, seCog is the standard error of the enrichment for Cog, seNonCog is the standard error of the enrichment for NonCog, and CTI is the LD score cross-trait intercept, a metric of dependence between the GWASs of Cog and NonCog.
Enrichment of gene expression in the brain
We performed a transcriptome-wide association study (TWAS) using Gusev et al.69 (FUSION: http://gusevlab.org/projects/fusion/). We used pre-computed brain-gene-expression weights available on the FUSION website, generated from 452 human individuals as part of the CommonMind Consortium. We then superimposed the bivariate distribution of the results of the TWAS for Cog and NonCog over the bivariate distribution expected given the sample overlap between EA and CP (the GWAS on which our GWAS of Cog and NonCog are based, see Supplementary Note 2).
Brain modalities
Brain volumes
We conducted genetic correlation analysis of brain volumes using GWAS results published by Zhao et al.72. Zhao et al. performed GWAS of total brain volume and 100 regional brain volumes, including 99 gray matter volumes and total white matter volume (Supplementary Table 15). Analyses included covariate adjustment for sex, age, their square interaction and 20 principle components. Analyses of regional brain volumes additionally included covariate adjustment for total brain volume. GWAS summary statistics for these 101 brain volumes were obtained from https://med.sites.unc.edu/bigs2/data/gwas-summary-statistics/. Summary statistics were filtered and pre-processed using Genomic SEM’s “munge” function, retaining all HapMap3 SNPs with allele frequency >.01 outside the MHC region. We used Genomic-SEM to compute the genetic correlations between Cog, NonCog and brain volumes. Analyses of regional volumes controlled for total brain volume. For each volume, we tested if correlations differed between Cog and NonCog. Specifically, we used a chi-squared test to evaluate the null hypothesis that the two genetic correlations were equal. We used FDR adjustment to correct for multiple testing. The FDR adjustment is applied to the results for all gray matter volumes for Cog and NonCog separately.
White matter structures
We conducted genetic-correlation analysis of white-matter structures using GWAS results published by Zhao et al.73. Zhao et al. performed GWAS of diffusion tensor imaging (DTI) measures of the integrity of white-matter tracts. DTI parameters were derived for fractional anisotropy (FA), mean diffusivity (MD), axial diffusivity (AD), radial diffusivity (RD), and mode of anisotropy (MO). Each of these parameters were measured for 22 white matter tracts of interests (Supplementary Table 16) resulting in 110 GWAS. GWAS summary statistics for these 110 GWAS were obtained from https://med.sites.unc.edu/bigs2/data/gwas-summary-statistics/. Summary statistics were filtered and processed using Genomic SEM’s “munge” function; retaining all HapMap3 SNPs with allele frequency >.01 outside the MHC region. For each white matter structure, we tested if genetic correlations differed between Cog and NonCog. Specifically, we used a chi-squared test to evaluate the null hypothesis that the two genetic correlations were equal. We used FDR adjustment to correct for multiple testing. As these different diffusion parameters are statistically and logically interdependent, having been derived from the same tensor, FDR adjustment was applied to the results for each type of white matter diffusion parameter separately. FDR correction was applied separately for Cog and NonCog.
Data and Resources
An FAQ on why, how and what we studied: https://medium.com/@kph3k/investigating-the-genetic-architecture-of-non-cognitive-skills-using-gwas-by-subtraction-b8743773ce44 GWAS summary data for Cog & NonCog: https://www.dropbox.com/s/cvzcedsfhbznv36/GWAS_sumstats_Cog_NonCog_Demange_et_al.zip?dl=0 A tutorial on how to perform GWAS-by-subtraction: http://rpubs.com/MichelNivard/565885
Acknowledgements
This study was developed with support from the Jacobs Foundation at a meeting organized by DWB and KPH with support from ETD and CM and attended by PB, BWD, JW, and others. We gratefully acknowledge contributions to the meeting from Katrin Mannik and Felix Tropf, and the Jacobs Foundation Fellowship team who made the meeting possible. DWB, KPH, MGN, ETD, CM are fellows of the Foundation. JW is a Jacobs Foundation Young Scholar. We would like to thank the research participants and employees of 23andMe for making this work possible. The study also used data from the Netherlands Twin Register (NTR), the Texas Twin Study, the National Longitudinal Study of Adolescent to Adult Health (Add Health), the Dunedin Longitudinal Study, the E-Risk Study, and the Wisconsin Longitudinal Study (WLS). NTR is supported by: ‘Twin-family database for behavior genetics and genomics studies’ (NWO 480-04-004), Longitudinal data collection from teachers of Dutch twins and their siblings (NWO-481-08-011); Twin-family study of individual differences in school achievement (NWO 056-32-010) and Gravitation program of the Dutch Ministry of Education, Culture and Science and the Netherlands Organization for Scientific Research (NWO 0240-001-003); NWO Groot (480-15-001/674): Netherlands Twin Registry Repository: researching the interplay between genome and environment; NWO-Spi-56-464-14192 Biobanking and Biomolecular Resources Research Infrastructure (BBMRI – NL, 184.021.007 and 184.033.111); European Research Council (ERC-230374); the Avera Institute for Human Genetics, Sioux Falls, South Dakota (USA) and the National Institutes of Health (NIH, R01D0042157-01A); the NIMH Grand Opportunity grants (1RC2MH089951-01 and 1RC2 MH089995-01). The Texas Twin Project is supported by NICHD grants R01HD083613 and R01HD092548. Add Health is supported by Eunice Kennedy Shriver National Institute of Child Health and Human Development grant P01HD31921, and GWAS grants R01HD073342 and R01HD060726, with cooperative funding from 23 other federal agencies and foundations. The Dunedin Multidisciplinary Health and Development Study is supported by the NZ HRC, NZ MBIE, National Institute on Aging grant R01AG032282, and UK Medical Research Council grant MR/P005918/1. The E-Risk Study is supported by the UK Medical Research Council grant G1002190 and Eunice Kennedy Shriver National Institute of Child Health and Human Development grant R01HD077482. The Wisconsin Longitudinal Study is supported by National Institute on Aging grants R01AG041868 and P30AG017266.
This research received additional support from the National Institute on Aging grant R24AG045061. This research benefited from GWAS results made publicly available by the SSGAC. Some of the work used a high-performance computing facility partially supported by grant 2016-IDG-1013 from the North Carolina Biotechnology Center.
PAD is supported by the grant 531003014 from The Netherlands Organisation for Health Research and Development (ZonMW). PB is supported by the NORFACE-DIAL grant number 462-16-100.ETD is supported by NIH grants R01AG054628 and R01HD083613. The Population Research Center at the University of Texas at Austin is supported by NIH grant P2CHD042849. AA is supported by the Foundation Volksbond Rotterdam. BD is supported by award # 96-17-04 from the Russell Sage Foundation and the Ford Foundation. DIB is supported by the Royal Netherlands Academy of Science (KNAW) Professor Award (PAH/6635). HFI was supported by the “Aggression in Children: Unraveling gene-environment interplay to inform Treatment and InterventiON strategies” project (ACTION). ACTION received funding from the European Union Seventh Framework Program (FP7/2007-2013) under grant agreement no 602768. EvB is supported by NWO VENI grant 451-15-017. KPH and ETD are Faculty Research Associates of the Population Research Center at the University of Texas at Austin, which is supported by grant, 5-R24-HD042849, from the Eunice Kennedy Shriver National Institute of Child Health and Human Development (NICHD). MGN is supported by ZonMW grants 849200011 and 531003014 from The Netherlands Organisation for Health Research and Development, a VENI grant awarded by NWO (VI.Veni.191G.030).
Footnotes
↵# Jointly supervised the work
“It takes something more than intelligence to act intelligently.” – Fyodor Dostoyevksy, Crime and Punishment
https://www.dropbox.com/s/cvzcedsfhbznv36/GWAS_sumstats_Cog_NonCog_Demange_et_al.zip?dl=0
References
- 1.↵
- 2.↵
- 3.↵
- 4.↵
- 5.↵
- 6.↵
- 7.↵
- 8.
- 9.↵
- 10.↵
- 11.
- 12.
- 13.↵
- 14.↵
- 15.↵
- 16.
- 17.
- 18.↵
- 19.↵
- 20.↵
- 21.↵
- 22.↵
- 23.↵
- 24.↵
- 25.↵
- 26.↵
- 27.↵
- 28.↵
- 29.↵
- 30.↵
- 31.↵
- 32.↵
- 33.↵
- 34.↵
- 35.↵
- 36.
- 37.
- 38.↵
- 39.↵
- 40.↵
- 41.↵
- 42.↵
- 43.
- 44.
- 45.↵
- 46.↵
- 47.↵
- 48.↵
- 49.
- 50.↵
- 51.↵
- 52.↵
- 53.↵
- 54.↵
- 55.↵
- 56.↵
- 57.
- 58.
- 59.
- 60.
- 61.
- 62.↵
- 63.↵
- 64.↵
- 65.↵
- 66.↵
- 67.↵
- 68.↵
- 69.↵
- 70.↵
- 71.↵
- 72.↵
- 73.↵
- 74.↵
- 75.↵
- 76.↵
- 77.
- 78.↵
- 79.↵
- 80.↵
- 81.↵
- 82.↵
- 83.↵
- 84.↵
- 85.↵
- 86.↵
- 87.↵
- 88.↵
- 89.↵
- 90.↵
- 91.↵
- 92.↵


