

Abstract
The role of transcallosal conduction delay (TCD) in hemispheric dominance and behavioral outcomes has long been theorized, but it has scarcely been investigated due to methodological shortcomings. Here, we report a new noninvasively measured index of TCD between homologous motor areas derived from TMS-evoked potentials. Notably, asymmetric TCD leads to finer bimanual coordination when signal is transmitted more quickly from the dominant primary motor cortex than in the opposite direction.
Main text
Conduction delay over long-range connections is a crucial feature of neural communication that impacts the efficacy of signal transmission between distant areas and thus influences the anatomo-functional architecture of the brain. Specifically, long transcallosal conduction delay (TCD) has been theorized to be the basis of hemispheric dominance: long TCD prevents the exchange of information between homologous cortical areas and favors the compartmentalization of signal processing 1–3. Such delays impact each transcallosal transfer of information regardless of the information conveyed, i.e., both when the processes of the two hemispheres must be integrated and when the two hemispheres exert mutual functional inhibition, possibly directed toward suppression of competing activation, as has been shown in the motor system 4. The impact of TCD on interhemispheric signal transmission may eventually have consequences on behavioral performance, which may become most apparent when tasks have strict timing constraints.
Despite the acknowledged importance of TCD in brain functioning, empirical support has been limited to date due to the lack of a direct noninvasive measure of TCD. Pioneering studies have exploited lateralized effects on reaction times and event-related potentials, but these effects may be affected by several stages along the processing stream. In relation to the motor system, estimates of TCD have been obtained with peripheral measures of transcallosal inhibition, such as the ipsilateral silent period (iSP), but they are affected by the corticospinal tract. Consequently, it is not well understood how conduction delay in transcallosal connections affects lateralized processing and behavioral outcomes.
Coregistration of transcranial magnetic stimulation (TMS) and electroencephalography (EEG) has the potential to provide temporally precise cortical measures of effective connectivity through TMS-evoked potentials (TEPs): After the direct activation of a target region at the time of TMS, a secondary neural response is generated in distant connected regions, e.g., a homologous area connected via the corpus callosum, and this response is recorded through EEG 5. Importantly, the amplitude and latency of the secondary response can be measured from the TEPs and reflect the strength and conduction delay of the connection, respectively.
In this work, we extracted from TEPs a signal component, named P15, which could represent the response of the contralateral primary motor cortex (M1) after signal transmission through callosal fibers, considering latency, topographic distribution on the scalp and polarity. In the following analyses, we show that P15 reflects transcallosal inhibitory control of the contralateral motor area; Indeed, P15 amplitude is related to inhibition of the contralateral M1 as measured by iSP. Importantly, P15 latency depends on the diffusivity of water molecules along the fibers of the callosal body, i.e., the structure connecting homologous motor cortices. Therefore, P15 latency provides an index of TCD.
With this new measure of effective connectivity, we show that asymmetry in TCD between motor cortices is beneficial for bimanual coordination in a task that has been shown to rely on callosal integrity 6: Specifically, shorter left-to-right TCD and longer right-to-left TCD resulted in better temporal performance in bimanual finger opposition movements. These findings suggest that, for in-phase bimanual movements, fast interhemispheric signal transmission per se (i.e., in both directions) is not as beneficial as an asymmetric interhemispheric signal transmission in which the TCD from the dominant M1 is shorter than the TCD from the nondominant M1.
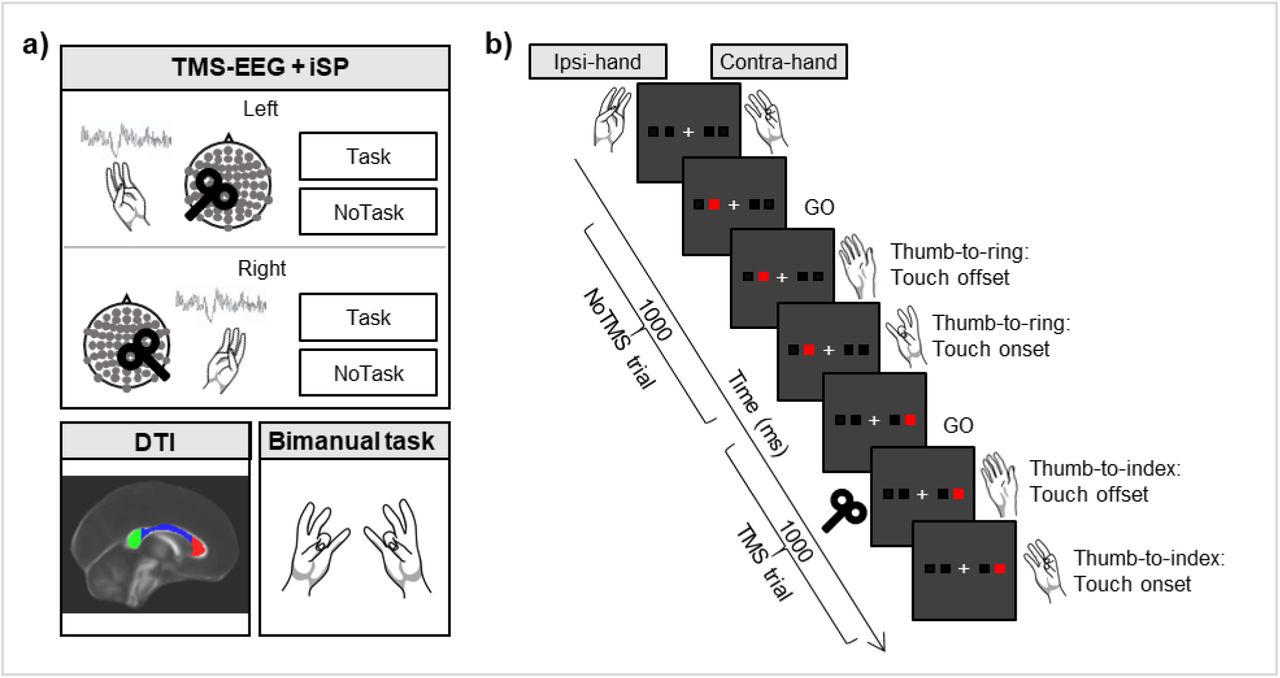
In our experiment (Fig. 1), TEPs and iSP were collected from the left and right M1 separately in healthy subjects (n = 15) during an iSP paradigm, in which the application of TMS over M1 induces a reduction in electromyographic activity of the ipsilateral target hand muscle due to transcallosal inhibition 7. To increase the range of motor inhibition, we manipulated the activity of the contralateral hand by including a condition in which the hand was at rest (NoTask) and a condition in which subjects performed thumb-to-finger opposition movements (Task) 8. Moreover, we assessed the microstructural integrity of the corpus callosum by means of diffusion tensor imaging (DTI)-derived parameters (fractional anisotropy, mean diffusivity, radial diffusivity and axial diffusivity) as well as bimanual coordination performance during in-phase bimanual sequences of thumb-to-finger opposition movements.

Study methods. a) Main steps of the experimental procedure, consisting of a TMS-EEG and iSP session, DTI acquisition and an in-phase bimanual coordination task. During TMS-EEG, the left and right M1 were stimulated in separate blocks in an iSP paradigm, involving Task and NoTask conditions. During both conditions, the thumb and the little finger of the ipsilateral hand were opposed, maintaining ∼25% of maximal APB muscle contraction. iSP is a reduction in electromyographic activity in the APB muscle after TMS due to transcallosal inhibition. In the NoTask condition, participants kept the contralateral hand at rest, while in the Task condition, they performed the unimanual finger opposition movement sequence described in b). b) Two example trials of the Task condition, comprising one trial without and one trial with TMS over the left M1. On the contralateral hand, the thumb was opposed to the finger indicated by the red square on the PC screen. A TMS pulse was triggered by the touch offset in half of the trials.
The stimulation of the targeted M1 induced a complex TEP response (Fig. 2a), including an early component, i.e., the abovementioned P15. The latency of P15 falls in the range of TCD estimated from anatomical studies 2,9 and double-coil TMS studies 4. The peak is located in the frontocentral sites of the contralateral hemisphere. The polarity is positive, in line with the relationship between positivity and inhibition that has been shown in motor areas. Importantly, P15 was highly consistent and could be detected in every condition (Fig. 2b-c), and the same was true of the iSP (Table 1).

P15 as a measure of transcallosal effective connectivity. a) Grand average of TEPs in the four experimental conditions. b) Topographical maps of P15 showing a consistent pattern of positive activation in frontal electrodes contralateral to TMS in the four experimental conditions. c) Grand average of P15 in the four experimental conditions (SE in shaded error bars). P15 was identified in each participant and each condition as the first positive peak within a 5-30 ms interval in pooled data from two frontal electrodes contralateral to TMS (F1 and FC1 for right TMS, F2 and FC2 for left TMS). d) Linear regression between P15 amplitude and normalized iSP area: higher P15 is associated with greater iSP, suggesting that P15 reflects transcallosal inhibition. e) Linear regression between axial diffusivity in the body of the corpus callosum and P15 latency: higher axial diffusivity predicts shorter P15 latency. In d) and e), blue dots indicate left TMS, and orange dots indicate right TMS. Data from the Task and NoTask conditions were pooled together.
First, P15 was linked to contralateral motor inhibition, as assessed by the relationship between TEPs and iSP: P15 amplitude predicts the normalized iSP area (r = 0.38, p =0.003), such that the larger the P15, the stronger the inhibition will be in the ipsilateral abductor pollicis brevis (APB; Fig. 2d). No significant relationship was found between P15 latency and iSP onset (r = 0.11, p = 0.41).
Moreover, as evidence that P15 reflects transcallosal connectivity, we assessed the relationship between the microstructural integrity of the corpus callosum and the features of P15 with a multiple regression analysis. We found that P15 latency was predicted by the mean diffusivity of the corpus callosum (F(3, 56) = 3.45, p = 0.02; no significant regression between P15 latency and fractional anisotropy: F(3, 56) = 0.5, p = 0.68). Specifically, the relationship was significant for the callosal body (r = -0.37, p = 0.003) but not for the other tested regions of interest (ROIs), i.e., the genu (r = - 0.16, p = 0.23) and the splenium (r = -0.13, p = 0.32). Crucially, the result concerning the mean diffusivity of the callosal body (F(2, 57) = 6.18, p = 0.004) was mainly explained by the diffusivity along the axons (axial diffusivity; r = -0.4, p = 0.001) rather than the radial diffusivity (r = -0.2, p = 0.12). Specifically, the higher the axial diffusivity was, the shorter the latency of P15, i.e., shorter TCD (Fig. 2e).
Taken together, these results strongly support the idea that P15 reflects the transcallosal inhibition of M1 and that its latency represents the TCD along the fibers of the callosal body.
Our next goal was to test how TCD affects behavior. We expected that TCD between homologous motor areas could affect the temporal precision of motor performance when bilateral movements must be coordinated. Therefore, we calculated the inter-hand interval, i.e., the time difference between taps with the right and left hand, during in-phase bimanual sequences of finger opposition movements. In this task, the two M1s need to be finely tuned, and the process has been associated with microstructural integrity of the corpus callosum 6.
A significant positive regression was found between P15 latency and inter-hand interval (r = 0.39, p = 0.03; Fig. 3a), such that shorter left-to-right TCD resulted in a shorter inter-hand interval, i.e., better bimanual coordination. In the opposite direction, the shorter the right-to-left P15 latency, the longer the inter-hand interval, indicating worse bimanual coordination (r = -0.46, p = 0.01; Fig. 3b). Crucially, the best predictor of bimanual coordination was the ratio of the P15 latency from the dominant (left) M1 to the P15 latency from the nondominant (right) M1 (r = -0.74, p < 0.001; Fig. 3c). Finally, as a control condition, we tested the relationship between P15 latency and inter-hand interval during bimanual repetitive thumb-to-index-finger opposition movements, in which the corpus callosum is less involved. Indeed, we found no significant regression between P15 latency and inter-hand interval (left TMS: r = 0.07, p = 0.72; right TMS: r = -0.12, p = 0.52; left/right TMS: r = 0.16, p = 0.57).

Asymmetric transcallosal conduction delay predicts finer bimanual coordination. The relationship between P15 latency and performance in the in-phase bimanual coordination task depends on the stimulated hemisphere. a) When TMS is delivered over M1 in the dominant hemisphere (left TMS), shorter P15 latency is associated with finer bimanual coordination (positive relationship between P15 latency and inter-hand interval). b) Conversely, when TMS is applied over M1 in the nondominant hemisphere (right TMS), the shorter the P15 latency is, the worse the bimanual coordination will be (negative relationship between P15 latency and inter-hand interval). c) Inter-hand interval is best predicted by the ratio of P15 latency following left TMS to P15 latency following right TMS, indicating that a shorter conduction delay from the dominant M1 to the nondominant M1 than in the opposite direction is associated with finer bimanual coordination.
These data show that bimanual coordination benefits from an asymmetric TCD between homologous motor areas when signal transmission from the dominant to the nondominant hemisphere is faster than transmission in the opposite direction.
These results show that the temporal domain is crucial for left hemisphere motor dominance. According to the model of neural cross-talk, motor commands are sent from each hemisphere both to the contralateral side and, in a mirror version, to the ipsilateral side 10–12. The relative TCD in each direction may affect how the signals from the two hemispheres interact and eventually interfere with each other. In line with present result that P15 reflects a functionally inhibitory signal, one possible mechanism is that prompt suppression of the nondominant motor area, conveyed through a functional inhibitory signal, may increase the efficiency of cross-talk at the corticospinal level, thus improving temporal coordination. However, we did not record P15 during the bimanual task, and we cannot exclude the possibility that in this condition, the transcallosal signal shifts to functional facilitation, determining the cross-talk at the cortical level. Nevertheless, faster signal transmission from the dominant hemisphere than from the nondominant hemisphere would still pose an advantage, reducing the interference effects of intruding commands. Altogether, finer bimanual coordination would be reached when the transmission was asymmetric and gave a temporal advantage to the signal from the dominant hemisphere over the nondominant hemisphere, regardless of the information conveyed (i.e., either functional inhibition or signal transmission).
Furthermore, the asymmetry in P15 latency may suggest asymmetrical callosal connections between homologous areas, expanding the notion of transcallosal cross-talk from a functional to a structural meaning, where the asymmetry of features between the callosal fibers from the left M1 to the right M1 and those from the right M1 to the left M1 can shape bimanual coordination performance. It is possible that asymmetric connectivity, in which only one direction of information processing is optimized, may be a consequence of the limited evolutionary growth of the corpus callosum relative to brain size due to spatial and metabolic constraints 13.
The positive relationship between P15 latency and the axial diffusivity of the callosal body is a crucial finding that supports the motion that P15 reflects the TCD. Accordingly, axial diffusivity represents the motion of water along the principal axis of the fibers rather than across it. In a healthy population, diffusivity measures may depend on several factors, including axonal diameter, myelin thickness, axon counts and density of packed fibers 14,15. Importantly, regardless of the specific underlying anatomical characteristics, higher axial diffusivity can reflect better signal propagation.
A TEP-based estimate of TCD may be very close to the actual TCD of the fiber tract, although it may be a slight overestimate due to the time required for TMS to activate pyramidal neurons in the target region, which takes less than 1 ms 16, and the time required for activation of local circuits in the connected area, which has been estimated to be approximately 1-2 ms. Moreover, although calculating TCD based on the peak of an EEG potential has the advantage of considering the moment in which the signal-to-noise ratio is the highest, signal onset may yield a more precise calculation. Given these considerations, P15 may include an overestimation of the TCD by approximately 2-3 ms, but overall, the timing fits with the predictions of TCD derived from anatomical studies 2,9 and from double-coil TMS studies 4.
The development of a noninvasive measure of TCD opens several new opportunities to study cortical connectivity and hemispheric asymmetries. This approach can be extended to other cognitive domains involving other regions of the corpus callosum and other major intrahemispheric tracts.
Methods
Participants
Fifteen healthy participants (mean age 35 years; range 26-47 years; 8 females) gave written informed consent and participated in the two experimental sessions of the study within two weeks: Session 1 consisted of magnetic resonance imaging (MRI) examination, and session 2 consisted of the behavioral task and TMS-EEG for TEP and iSP recording (Fig. 1).
All participants were right-handed according to the Edinburgh Handedness Inventory (mean ± SE: 81.5± 4.6), and they had no history of neurological disorders or contraindications to MRI or TMS. The study was performed in accordance with the ethical standards of the Declaration of Helsinki and was approved by the Ethical Committee of the IRCCS San Giovanni di Dio Fatebenefratelli (Brescia) and by the Ethical Committee of the Hospital of Brescia.
MRI acquisition
MRI was performed on a 3 T MR system (Skyra, Siemens, Erlangen, Germany). In a single session, the following scans were collected from each subject: axial T2-weighted fluid-attenuated inversion recovery (FLAIR; repetition time (TR) 9000 ms, echo time (TE) 76 ms, inversion time (TI) 2500 ms, slice thickness 3 mm, distance factor 10%, 1 average, field of view (FOV) 220 mm, voxel size 0.6×0.6×3.00 mm), DTI with spin-echo echo-planar axial sequences (multiband, TR 4100 ms, TE 75.0 ms, 1.8 mm isotropic resolution, b 1000 s/mm2, 64 encoding directions, 5 b0 images, fat suppression), and high-resolution T1-weighted 3D anatomical sequences (sagittal volume, TR 2400 ms, TE 2 ms, 0.9 mm isotropic resolution).
Bimanual coordination task
Participants were seated in a comfortable chair in a quiet room, resting their forearms on a table, and were asked to perform an in-phase bimanual task before the TMS-EEG session. The task consisted of performing repetitive, metronome-paced thumb-to-finger opposition movements at 2 Hz with their eyes closed; participants performed the task with both hands simultaneously to assess bimanual coordination 6. The motor sequences consisted of simple finger tapping (thumb-to-index-finger opposition) and a 4-item sequence that consisted of opposing the thumb to the index, middle, ring and little fingers. Each condition was performed twice in separate trials lasting 45 s and separated by a few minutes of rest to avoid fatigue effects. Finger contacts were recorded by two specially designed gloves (GAS, ETT, s.p.a., Genoa, Italy) 17.
TMS-EEG acquisition
Participants were comfortably seated in a dimly lit room in front of a computer screen, wearing an EEG cap and two gloves with integrated sensors. The participants were asked to perform two conditions (Task and NoTask) of an iSP paradigm in separate blocks while TMS-EEG was recorded. In the hand ipsilateral to the stimulation, the thumb and the little finger were opposed and contracted in both conditions (mean ± SE of percentage of maximal contraction: Task condition, 23% ± 1; NoTask condition, 23% ± 2). The activity in the hand contralateral to the stimulation depended on the condition. In the Task condition (Fig. 1b), the contralateral hand performed a unimanual finger tapping task. Participants were presented with four white squares on the distal phalanges of the index, middle, ring and little fingers. The white squares turned red one at a time in random order, and participants were instructed to respond as quickly and accurately as possible by opposing the thumb to the corresponding finger. The block started with participants in a resting position, touching the tip of the index finger to the tip of the thumb. Upon the presentation of the stimuli, participants lifted their fingers (touch offset) and tapped their thumb to the finger indicated by the stimulus (touch onset). Stimuli lasted 1000 ms and were presented at a frequency of 1 Hz. The number of stimuli per block was 120. Before the beginning of the recording, participants performed one block of the task with each hand to familiarize them with the task and to measure their reaction times (touch offset). Performance was not further analyzed in those blocks.
In the NoTask condition, participants saw the same stimuli as in the Task condition, but they were not required to perform any tapping with the contralateral hand, which was relaxed.
TMS over the M1 was randomly delivered in half of the trials, i.e., 60 pulses per block, at the time of touch offset measured by the engineered glove in the Task condition, and at the time of touch offset measured in the training block for the NoTask condition.
The stimulation was performed with a MagPro X100 including MagOption (MagVenture, Denmark) and set to deliver biphasic single pulses with a figure-of-eight C-B60 coil. The recharge delay was set at 500 ms. The coil was positioned tangentially to the scalp over the M1 hotspot, which was functionally localized as the position that induced reliable motor evoked potentials (MEPs) in the APB. The coil, with the handle pointing backward, was rotated away from the midline by approximately 45° so that the current induced in the cortex followed the optimal direction, i.e., anterior to posterior and posterior to interior (AP-PA). The stimulation intensity (mean ± SE: 58.1% of MSO ± 1.6%) was set at 110% of the individual average resting motor threshold (rMT), defined as the minimum TMS intensity to elicit an MEP of at least 50 µV in 5 out of 10 trials.
In order to ensure the precision of stimulation, a stereotaxic neuronavigation system (SofTaxic, EMS, Italy) was used in which the T1 anatomical MRI was coregistered to head position. EEG was recorded with a TMS-compatible EEG system (BrainAmp, Brain Products GmbH, Munich, Germany) from 67 channels according to the international 10-20 system (sampling rate: 5 kHz; online bandpass filter: between 0.1 and 1 kHz). The ground was placed at FPz, and all channels were referenced online to the nose. The skin/electrode impedance was below 5 kΩ. Vertical and horizontal eye movements were monitored with an electrooculogram using two pairs of electrodes in a bipolar montage. Electromyography (EMG) was recorded from the APBs of both hands using a pair of surface electrodes with a belly-tendon montage. Before TMS-EEG, EMG was recorded for 30 s while participants were asked to touch the little finger to the thumb and to maintain the muscle contraction at maximum strength. This recording was subsequently analyzed to calculate the relative contraction levels during TMS-EEG.
DTI analysis
DTI data were processed using FMRIB’s Diffusion Toolbox (FDT). After correction for eddy current distortions and motion artifacts, a diffusion tensor model was fitted at each voxel, and the three eigenvalues were calculated. Parametric maps were obtained for fractional anisotropy, mean diffusivity, axial diffusivity (i.e., water diffusivity parallel to the axonal fibers), and radial diffusivity (i.e., water diffusivity perpendicular to the axonal fibers) 15,18. All these maps were then nonlinearly transformed and aligned to 1 × 1 × 1 mm standard space using tract-based spatial statistics (TBSS) routines. The mean value of each DTI-derived parameter was calculated for each scan in the voxels included in the callosal fibers within three ROIs (genu, body, and splenium) from the JHU ICBM 81 white matter label atlas included in FSL.
Bimanual coordination assessment
To quantitatively evaluate bimanual coordination performance, we calculated the inter-hand interval as the absolute time difference between the onset of a finger tap with the left hand and the onset of the corresponding finger tap with the right hand: the longer the inter-hand interval value, the worse the bimanual coordination 6. This parameter was averaged over the different fingers in the sequence.
TMS-evoked potentials (TEPs)
TMS-EEG data analysis was performed in MATLAB (The MathWorks, Natick, MA, USA) with custom scripts using EEGLAB functions, FieldTrip functions, the source-estimate-utilizing noise-discarding (SOUND) algorithm 19 and the signal-space projection and source-informed reconstruction (SSP-SIR) algorithm 20. Continuous EEG was linearly interpolated from 1 ms before to 6 ms after the TMS pulse and high-pass filtered at 0.1 Hz. TMS-EEG data were then epoched from -200 ms before to 500 ms after TMS and downsampled to 2048 Hz. Measurement noise was discarded with the SOUND algorithm with the same spherical 3-layer model and regularization parameter (λ = 0.01) described in the original work 19. After the application of the SOUND algorithm, the signal was visually inspected, and initial artifact rejection was performed; then, independent component analysis (ICA; infomax algorithm) was run to correct ocular artifacts. TMS-evoked muscular artifacts in the first 50 ms were removed using SSP-SIR, a method based on signal-space projection and source-informed reconstruction. Muscle-artifact components (0-3 in each dataset) were identified from the time-frequency pattern and corresponding signal power. Then, epochs were low-pass filtered at 70 Hz and re-referenced to the average of TP9 and TP10. Finally, after a second visual inspection and artifact rejection, TMS-EEG data were baseline corrected from -100 ms to -2 ms before the TMS pulse and averaged. P15 amplitude and latency were measured by identifying each individual subject’s first positive peak between 5 and 30 ms in pooled data from two frontocentral channels (F2-FC2 for left TMS, F1-FC1 for right TMS).
Ipsilateral silent period (iSP)
iSP parameters were assessed in the trace obtained from averaging the 60 rectified EMG traces 7. The following iSP parameters were considered: the iSP onset, defined as the point after cortical stimulation at which EMG activity became constantly (for a minimum duration 10 ms) below the mean amplitude of EMG activity preceding the cortical stimulus; the iSP duration, calculated by subtracting the onset time from the ending time (i.e., the first point after iSP onset at which the level of EMG activity returned to the mean EMG signal); and the normalized iSP area, calculated using the following formula: [(area of the rectangle defined as the mean EMG × iSP duration)−(area underneath the iSP)] divided by the EMG signal preceding the cortical stimulus.
Statistical analysis
Statistical significance was set at p < 0.05. The relationships between P15 amplitude and normalized iSP area and between P15 latency and iSP onset were tested by simple linear regression. Multiple regression was used to test whether P15 latency was predicted by the microstructural integrity (fractional anisotropy and mean diffusivity) of different ROIs of the corpus callosum (i.e., genu, body and splenium). The significant correlation between the mean diffusivity of the callosal body and the P15 latency was further investigated by multiple regression with axial diffusivity and radial diffusivity as predictors to test which diffusivity direction accounted for the effect. Finally, simple linear regression was used to test the relationship between P15 latency (left-to-right, right-to-left, ratio between left-to-right and right-to-left) and inter-hand interval for sequential thumb-to-finger opposition movements and repetitive thumb-to-index-finger opposition movements separately.


