

ABSTRACT
The tumor suppressive miR-29 family of microRNAs is encoded by two clusters, miR-29b1∼a and miR-29b2∼c, which are regulated by oncogenic and tumor suppressive stimuli, including p53. Here we investigated whether MAPK hyperactivation-induced oncogenic stress regulates miR-29 abundance and how this signaling axis impacts melanoma development. Using mouse embryonic fibroblasts and human melanocytes, we found that oncogenic MAPK signaling stimulates p53-independent and p53-dependent transcription of pri-miR-29b1∼a and pri-miR-29b2∼c, respectively. Expression analyses revealed that while pri-miR-29a∼b1 remains elevated, pri-miR-29b2∼c levels decrease during melanoma progression. Using a rapid mouse modeling platform, we showed that inactivation of miR-29 in vivo accelerates the development of frank melanomas and decreases overall survival. We identified MAFG as a relevant miR-29 target that has oncogenic potential in melanocytes and is required for growth of melanoma cells. Our findings suggest that MAPK-driven miR-29 induction constitutes a tumor suppressive barrier by targeting MAFG, which is overcome by attenuation of miR-29b2∼c expression.
INTRODUCTION
Malignant melanoma is an aggressive cancer that arises as a consequence of activation of proto-oncogenes, most commonly BRAF and NRAS. Despite the recent advances in melanoma therapy, most patients still succumb to the disease. A better understanding of the molecular biology of melanoma is needed to identify new therapeutic targets. Non-coding RNAs (ncRNAs) are critical regulators of cell biology whose alteration can lead to the development of cancer, including melanoma. ncRNAs can be classified based on their length into long non-coding RNAs (lncRNAs), those ncRNAs exceeding 200 nucleotides, and small non-coding RNAs, ranging from 18-200 nucleotides (Djebali et al., 2012; Ponting et al., 2009). MicroRNAs (miRNAs) are a group of small non-coding RNAs that repress gene expression by binding to 3’UTRs of target mRNAs (Davis and Hata, 2009). To date, various miRNAs have been reported to regulate the biology of melanoma cells (reviewed in (Fattore et al., 2017; Romano and Kwong, 2017; Wozniak et al., 2016)) including miR-29a, which was recently described as a tumor suppressor in melanoma (Xiong et al., 2018).
The miR-29 family is encoded by two clusters, miR-29b1∼a and miR-29b2∼c, located on chromosomes 7q32.2 and 1q32.2 in humans, respectively (Alizadeh et al., 2019; Kriegel et al., 2012). Expression of the miR-29 clusters yields primary transcripts pri-miR-29b1∼a and pri-miR-29b2∼c, which are processed to generate three mature miRNAs, miR-29a, miR-29b, and miR-29c, that are highly conserved across species and share identical seed sequences (Kriegel et al., 2012). miR-29 is considered a tumor suppressor miRNA given its ability to repress genes involved in proliferation and cell survival such as AKT3 (Ugalde et al., 2011; Wei et al., 2013), DNMT3A/B (Nguyen et al., 2011), MCL1 (Mott et al., 2007), and CDK6 (Zhao et al., 2010). Over the last decade, miR-29 has emerged as a major regulatory hub that integrates signaling from potent oncogenes and tumor suppressors. Indeed, miR-29 expression is repressed by c-Myc (Chang et al., 2008; Mott et al., 2010; Zhang et al., 2012b) as well as Hedgehog and NF-κB (Mott et al., 2010). NRF2 was reported to stimulate or suppress miR-29 expression in different cell types (Kurinna et al., 2014; Shah et al., 2015), and p53 promotes miR-29 expression when stimulated by aging or chronic DNA damage (Ugalde et al., 2011).
In addition to DNA damage, p53 is induced by oncogene-activated MAPK pathway hyperactivation. ERK phosphorylates p53 at serine 15, thereby contributing to its activation (Wu, 2004). Moreover, MAPK activation increases expression of Cyclin D, which releases E2F-1 via RB phosphorylation, thereby promoting p14ARF transcription (Bates et al., 1998; Peeper et al., 1997). p14ARF in turn stabilizes p53 through inhibition of MDM2 (Sherr and Weber, 2000). MAPK hyperactivation downstream of oncogenic BRAF is a critical driver of melanoma development (Davies et al., 2002), and p53 activation in response to mutant BRAF has been observed in melanocytes (Ko et al., 2019; Yu et al., 2009).
In this study we tested if oncogenic MAPK signaling promotes expression of the tumor suppressive miR-29 family via the induction of p53. We describe that miR-29b1∼a is regulated directly by the MAPK pathway independently of p53 and remains elevated in melanoma. Conversely, miR-29b2∼c expression is responsive to p53 activation, and is downregulated during melanomagenesis. Inactivation of miR-29 in a melanoma mouse model augmented tumor development. Finally, we identified MAFG as a miR-29 target whose de-repression may be important for melanoma progression.
RESULTS
Oncogenic stress increases the abundance of mature miR-29 in mouse embryonic fibroblasts
Ageing and DNA damage stress induce miR-29 expression in a p53-dependent manner (Ugalde et al., 2011), and we sought to determine if oncogenic stress, i.e. the activation of p53 upon the expression of oncogenes such as mutant RAS or BRAF, also results in elevated miR-29 levels. We first validated DNA damage-induced expression changes of miR-29 in mouse embryonic fibroblast (MEFs). Treatment with Doxorubicin or Mitomycin C increased the protein levels of p53 and its target gene p21 (Supplementary Figure 1A) and elevated the abundance of the three members of the miR-29 family, miR-29a, miR-29b, and miR-29c, as measured by mature miRNA qRT-PCR (Supplementary Figure 1B).
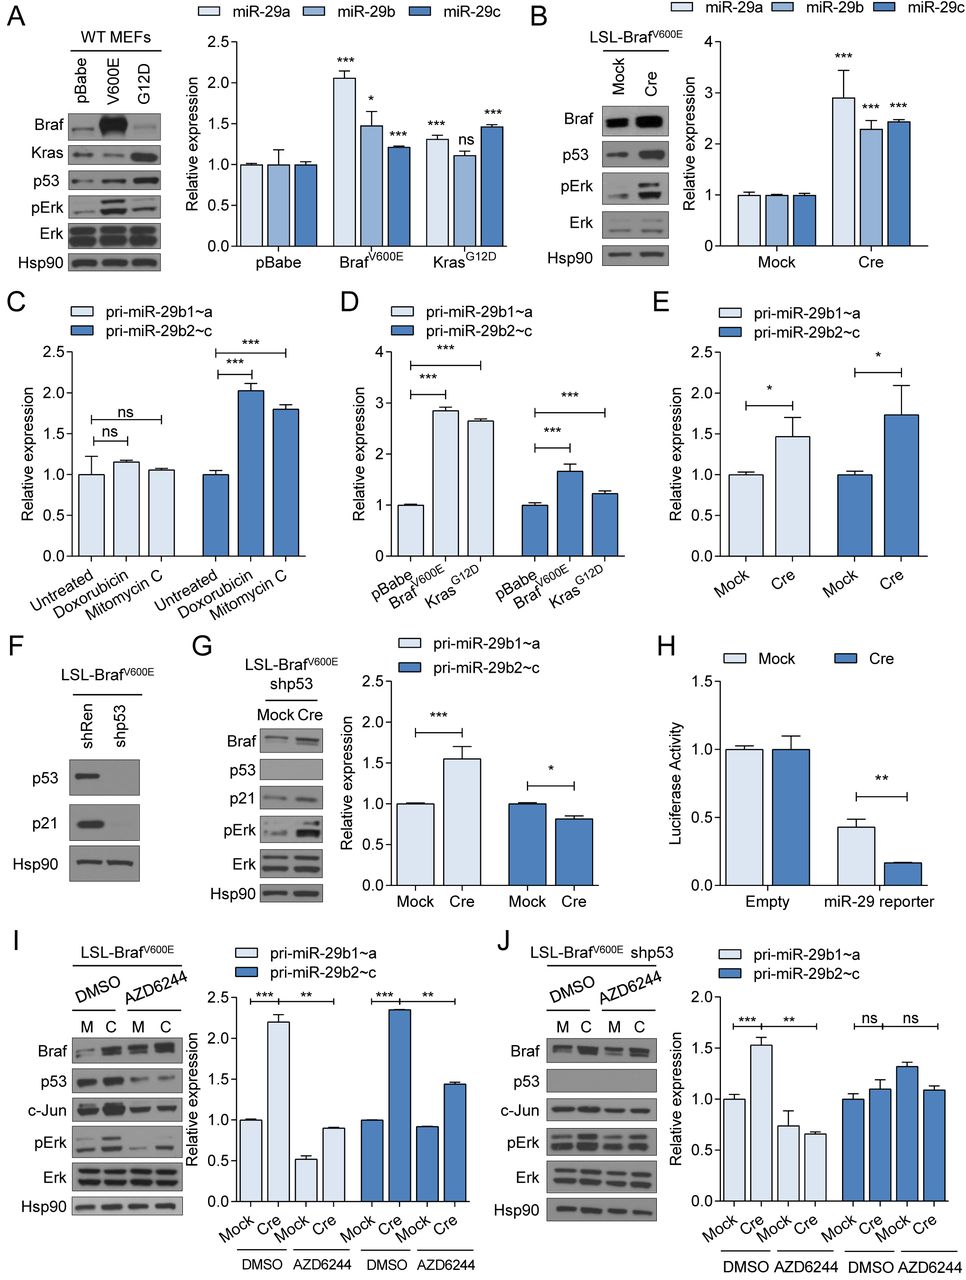
To test the effect of oncogenes on miR-29, we ectopically expressed BrafV600E and KrasG12D in wildtype MEFs. As expected, both oncogenes enhanced activation of the MAPK pathway, as indicated by an increase in phospho-ERK (Figure 1A). Overexpression of BrafV600E or KrasG12D also led to an increase of mature miR-29a, -29b, and -29c, an effect that was more pronounced in the BrafV600E-expressing cells (Figure 1A). In MEFs, supraphysiological expression of KrasG12D provokes enhanced p53 activity compared to KrasG12D expressed at physiological levels (Tuveson et al., 2004). To test if physiological expression of BrafV600E and KrasG12D also elevates miR-29, we used MEFs that carry Cre-inducible endogenous BrafV600E and KrasG12D alleles (LSL-BrafV600E and LSL-KrasG12D) (Jackson et al., 2001; Perna et al., 2015). Adenoviral-Cre mediated activation of endogenous BrafV600E or KrasG12D induced the upregulation of miR-29a, - 29b, and -29c (Figure 1B and Supplementary Figure 1C), indicating that these oncogenes enhance the expression of the miR-29 family.

(A) Ectopic expression of BrafV600E or KrasG12D in wildtype MEFs elevates expression of p53 and pERK (Western blot, left panel) and mature miR-29a, miR-29b, and miR-29c (qRT-PCR, right panel). (B) Induction of BrafV600E expression by Adeno-Cre (Cre) in LSL-BrafV600E MEFs elevates expression of p53 and pERK (Western blot, left panel) and mature miR-29a, miR-29b, and miR-29c (qRT-PCR, right panel). MEFs infected with empty adenovirus (Mock) serve as controls. (C-E) qRT-PCRs showing the expression of pri-miR-29b1∼a and pri-miR-29b2∼c in wildtype MEFs following treatment with Doxorubicin or Mitomycin C (C) or overexpression of BrafV600E or KrasG12D (D), and in LSL-BrafV600E MEFs following Adeno-Cre/Mock infection (E). (F) Western blot showing effective silencing of p53 in shp53-expressing LSL-BrafV600E MEFs. (G) Effect of p53 silencing on pri-miR-29b1∼a and pri-miR-29b2∼c expression measured by qRT-PCR in LSL-Braf V600E MEFs after induction of Braf V600E with Adeno-Cre. (H) Luciferase assay of shp53-expressing LSL-BrafV600E MEFs using a miR-29-Luciferase reporter. (I-J) Effect of MEK inhibitor (AZD6244) on the MAPK pathway and pri-miR-29b1∼a and pri-miR-29b2∼c expression in LSL-BrafV600E (I) and shp53-expressing LSL-BrafV600E MEFs (J). Western blots are shown in the left panels and expression of pri-miR-29b1∼a and pri-miR-29b2∼c measured by qRT-PCR are shown in the right panels of (G), (I) and (J). For all Western blots, Hsp90 was used as loading control. ns, not significant; * p < 0.05; ** p < 0.01; *** p < 0.001.
BrafV600E promotes transcription of pri-miR-29b1∼a and pri-miR-29b2∼c via the MAPK pathway and p53
MiR-29 may function as a melanoma tumor suppressor (Xiong et al., 2018) and the BRAFV600E mutation is found in over 50% of melanoma cases (Ascierto et al., 2012). We therefore focused our further analyses on the regulation of miR-29 by oncogenic BRAF. To determine if the regulation of miR-29 occurs at the transcriptional level, we assessed the expression of the miR-29b1∼a and miR-29b2∼c clusters using qPCR TaqMan probes to detect the primary miRNA transcripts, pri-miR-29b1∼a and pri-miR-29b2∼c. Surprisingly, Doxorubicin- and Mitomycin C only induced the expression of pri-miR-29b2∼c (Figure 1C), whereas ectopic overexpression of oncogenic BrafV600E or KrasG12D increased both pri-miR-29b1∼a and pri-miR-29b2∼c (Figure 1D). Similarly, endogenous activation of BrafV600E or KrasG12D resulted in upregulation of both pri-miR-29b1∼a and pri-miR-29b2∼c (Figure 1E and Supplementary Figure 1D), indicating that oncogenes promote the transcription of both miR-29 clusters whereas DNA damage-induced p53 only regulates expression of the miR-29b2∼c cluster in MEFs. These findings are at odds with the results obtained by mature miRNA qRT-PCRs where p53 activation increased expression of all three miR-29 family members. It is possible that the mature miR-29 qRT-PCR approach is unable to distinguish between miR-29a and miR-29c, which only differ in one nucleotide, as has been suggested previously (Kurinna et al., 2014). Indeed, miR-29a and miR-29c Taqman assays were unable to distinguish between miR-29a and miR-29c mimics transfected into A375 melanoma cells (Supplementary Figure 1E). Thus, the increased abundance of mature miR-29a upon DNA damage is most likely explained by elevated transcription of the highly homologous miR-29c family member.
To assess the role of p53 in regulating BrafV600E-induced transcription of pri-miR-29b1∼a and pri-miR-29b2∼c we silenced p53 with a retroviral shRNA in LSL-BrafV600E MEFs (Figure 1F). Retroviral infection did not interfere with BrafV600E-induced 29b1∼a and pri-miR-29b2∼c expression (Supplementary Figure 1F). As expected, induction of BrafV600E by adenoviral Cre failed to increase pri-miR-29b2∼c expression in the absence of p53 (Figure 1G). By contrast, BrafV600E increased pri-miR-29b1∼a expression in p53-silenced MEFs to the same extent as in p53-proficient MEFs (Figure 1G), suggesting that BrafV600E-mediated regulation of pri-miR-29b1∼a in MEFs is independent of p53. To test the physiological consequence of BrafV600E-induced pri-miR-29b1∼a expression, we performed a miR-29 Luciferase reporter assay in p53-silenced LSL-BrafV600E MEFs. Induction of BrafV600E decreased Luciferase activity, suggesting that increased miR-29b1∼a expression is sufficient for target repression (Figure 1H).
Given that BrafV600E-induced miR-29b1∼a expression is independent of p53, we examined the involvement of the MAPK pathway downstream of oncogenic BRAF in miR-29 regulation. To this end, we treated LSL-BrafV600E MEFs with the MEK inhibitor AZD6244 (Selumetinib) with or without induction of BrafV600E. 24 hours of AZD6244 treatment decreased basal and BrafV600E-induced MAPK pathway activity, as shown by reduced levels of pErk and the downstream transcriptional target c-Jun (Figure 1I and 1J). MEK inhibition also decreased basal and BrafV600E-induced pri-miR-29b1∼a expression (Figure 1I). This effect was also observed in p53-silenced LSL-BrafV600E MEFs (Figure 1J), indicating that oncogenic BRAF regulates miR-29b1∼a independently of p53 via the MAPK pathway. AZD6244 treatment blunted BrafV600E-induced pri-miR-29b2∼c expression, possibly due to reduced p53 expression (Figure 1I). Neither BrafV600E expression nor MEK inhibition affected pri-miR-29b2∼c levels in the absence of p53 (Figure 1J). These data suggest differential regulation of the miR-29 clusters by BrafV600E in MEFs: while miR-29b1∼a is controlled by the MAPK pathway, miR-29b2∼c is responsive to oncogenic stress-induced p53.
The MAPK pathway regulates miR-29 expression in human melanocytes and melanoma cells
We next examined if the regulation of miR-29 observed in MEFs is conserved in human melanocytes and melanoma cell lines. Treatment of the immortalized human melanocytes lines Hermes1 and Hermes3A with Doxorubicin increased p53 and p21 (Figure 2A). This induction of p53 robustly elevated pri-miR-29b2∼c levels (Figure 2A), indicating that p53 regulates pri-miR-29b2∼c in melanocytes. To analyze miR-29 regulation by the MAPK pathway in melanocytes we starved Hermes1 and Hermes3A cells of TPA, a phorbol ester that stimulates the MAPK pathway and that is required for melanocyte proliferation in vitro. Re-stimulation with TPA increased pERK levels and pri-miR-29b1∼a expression (Figure 2B). Interestingly, TPA also moderately enhanced pri-miR-29b2∼c expression (Figure 2B). Further, MEK inhibition with AZD6244 in Hermes1 and Hermes3A cells cultured in the presence of TPA diminished the expression of pri-miR-29b1∼a and pri-miR-29b2∼c (Figure 2C). Moreover, AZD6244 also decreased the levels of pri-miR-29b1∼a and pri-miR-29b2∼c in A375 and WM164 human melanoma cell lines (Figure 2D). Thus, while p53 potently stimulates miR-29b2∼c in both MEFs and melanocytes, the MAPK pathway induces expression of both miR-29 clusters in cells of the melanocytic lineage.

(A) Effect of Doxorubicin (Doxo) on pri-miR-29b1∼a and pri-miR-29b2∼c expression in human melanocytes Hermes1 (H1) and Hermes3A (H3). (B) Effect of TPA on pri-miR-29b1∼a and pri-miR-29b2∼c expression in human melanocytes. (C,D) Effect of AZD6244 on pri-miR-29b1∼a and pri-miR-29b2∼c expression in human melanocytes (C) and melanoma cells (D). (E) Expression of pri-miR-29b1∼a and pri-miR-29b2∼c in human melanocytes and melanoma cell lines obtained by RNAseq. (F) Expression of pri-miR-29b1∼a and pri-miR-29b2∼c in nevi and melanoma in the GSE112509 dataset. (G) Expression of pri-miR-29b1∼a and pri-miR-29b2∼c in parental Hermes1 and H1B cells obtained by RNAseq. (H) Effect of AZD6244 on pri-miR-29b1∼a and pri-miR-29b2∼c expression in H1B and H3B8 cells. pri-miR-29b1∼a and pri-miR-29b2∼c qRT-PCRs are shown in the left panels while Western blots are shown in the right panels of (A-D) and (H). For all western blots, HSP90 was used as loading control. ns, not significant; * p < 0.05; ** p < 0.01; *** p < 0.001. # FDR < 0.05; ## FDR < 0.01; ### FDR < 0.001.
Our results indicate that BrafV600E-induced expression of miR-29 may form a tumor suppressive barrier that restricts the full transformation of melanocytes. Thus, to analyze pri-miR-29 expression during melanomagenesis we performed RNA sequencing on four wildtype BRAF human melanocyte cell lines (Hermes1, Hermes2, Hermes3A, and Hermes4B) and five human melanoma cell lines (WM35, 1205Lu, WM164, SKMel28 and WM793) harboring the oncogenic BRAFV600E mutation. In addition, we interrogated pri-miR-29 expression in a publicly available RNAseq dataset (Kunz et al., 2018) from 23 nevi and 57 primary melanomas. In agreement with our observations, we found that there was a trend towards increased pri-miR-29b1∼a expression in melanoma cell lines and primary melanomas compared to melanocyte cell lines and nevi, respectively (Figure 2E and 2F). Notably, expression of pri-miR-29b2∼c was attenuated in melanoma cell lines and primary melanomas (Figure 2E and 2F), suggesting that a reduction of miR-29b and/or miR-29c is associated with melanoma progression.
To further analyze miR-29 regulation during melanocyte transformation, we examined the consequences of chronic BRAFV600E expression in human melanocytes. We delivered lentiviral HA-tagged BRAFV600E to Hermes1 and Hermes3A cells, which resulted in the emergence of four independent clones, one from Hermes1 (H1B) and three from Hermes3A (H3B2, H3B4 and H3B8). These cell lines are morphologically different from the parental lines, express ectopic BRAFV600E, and exhibit increased MAPK signaling as shown by elevated pERK and c-Jun (Supplementary Figure 2A and 2B), which enables these cells to proliferate in the absence of TPA (Supplementary Figure 2C and 2D). Notably, all four cell lines lost expression of p53 (Supplementary Figure 2A and 2B), and RNA sequencing revealed that similar to melanoma cell lines and primary melanomas, H1B cells exhibited reduced pri-miR-29b2∼c expression and a trend towards increased pri-miR-29b1∼a levels (Figure 2G). Finally, expression of both pri-miR-29b1∼a and pri-miR-29b2∼c was sensitive to AZD6244 treatment in H1B and H3B8 cells (Figure 2H). These observations indicate that while MAPK signaling enhances transcription of miR-29b1∼a in melanocytes, miR-29b2∼c is regulated by the MAPK pathway and p53. Furthermore, melanoma progression is associated with decreased pri-miR-29b2∼c levels, possibly through impaired p53 activity.
miR-29 inactivation promotes melanoma progression
To examine the role of miR-29 in melanoma formation in vivo, we first tested a miRNA sponge approach to inactivate miR-29 in vitro. To this end, we either transfected A375 melanoma cells with a hairpin inhibitor of miR-29a, which is upregulated in melanoma cells (Figure 2E), or delivered a lentiviral bulged miR-29 sponge construct. While inhibition of miR-29 enhanced only the focus formation capacity of A375 cells (Figure 3A), the miR-29 sponge construct increased proliferation and focus formation (Figure 3B and 3C). In addition, the miR-29 sponge increased the activity of a miR-29 Luciferase reporter (Figure 3D), indicating that this approach could be used in combination with our rapid melanoma mouse modeling platform (Bok et al., 2019) to assess continuous miR-29 inactivation in vivo. Embryonic stem cell (ESC)-derived chimeras produced by this approach are topically treated with 4OH-Tamoxifen (4-OHT) to activate melanocyte-specific Cre, which induces BrafV600E expression and heterozygous Pten deletion (Figure 3E), thereby initiating melanomagenesis. Cre also induces reverse transactivator (rtTA3) expression, enabling melanocyte-specific expression of transgenes upon Doxycycline administration (Figure 3E). We targeted ESCs with a Doxycycline (Dox)-inducible, GFP-linked miR-29 sponge allele or GFP as a control and produced miR-29 sponge and GFP control chimeras having similar ESC contribution (Figure 3F). Notably, chimeras expressing the miR-29 sponge developed melanoma faster (Figure 3G) and exhibited reduced overall survival (Figure 3H), indicating that inactivation of miR-29 accelerates melanoma development. To validate the functionality of the miR-29 sponge in mice, we derived a melanoma cell line from a miR-29 sponge chimera. Dox withdrawal turned off miR-29 sponge expression and enhanced repression of a miR-29 Luciferase reporter (Figure 3I), confirming that the sponge inactivated endogenous miR-29. Moreover, Dox withdrawal reduced proliferation (Figure 3J) and colony formation (Figure 3K) of the miR-29 sponge melanoma cells, indicating that continued miR-29 inactivation is required to maintain the transformed state.

(A) Effect of miR-29 inactivation in A375 cells on colony formation by hairpin inhibitors. (B,C) Effect of miR-29 inactivation by a miR-29 sponge construct in A375 cells on proliferation (B) and colony formation (C). (D) Effect of the miR-29 sponge on miR-29-Luciferase reporter activity in A375 cells. (E) Outline of the embryonic stem cell-genetically engineered mouse model approach (Bok et al., 2019) where a Dox-inducible miR-29 sponge is expressed in LSL-BrafV600E; PtenFL/WT melanocytes. (F) Percentage of chimerism in GFP (control) and GFP-miR-29 sponge chimeras. (G,H) Kaplan-Meier curves comparing the tumor free survival (G) and overall survival (H) of BrafV600E; PtenFL/WT GFP and miR-29 sponge chimeras. (I) miR-29-Luciferase reporter activity in miR-29 sponge melanoma cells. Dox withdrawal turns off expression of the sponge construct resulting in miR-29 reactivation. (J,K) Proliferation (J) and colony formation (K) upon miR-29 reactivation in miR-29 sponge melanoma cells. * p < 0.05; ** p < 0.01; *** p < 0.001.
Downregulation of miR-29 promotes melanoma through its target gene MAFG
miR-29 may elicit its tumor suppressive potential by repressing targets such as AKT3, DNMT3A/B, or MCL1 (Mott et al., 2007; Nguyen et al., 2011; Ugalde et al., 2011; Wei et al., 2013). Surprisingly, however, miR-29 hairpin inhibitors failed to increase the expression of these validated targets in A375 melanoma cells (Supplementary Figure 3A), suggesting that the effect of miR-29 hairpins on A375 focus formation (Figure 3A) is mediated by alternative targets. To identify miR-29 targets with roles in melanoma progression, we transfected A375 cells with miR-29a mimics and performed RNA sequencing. Genes that were reduced in response to miR-29a mimics were further prioritized based on three criteria: 1) the presence of predicted high-confidence miR-29 binding sites, 2) increased expression in primary melanoma compared to nevi in the GSE112509 dataset, and 3) a negative correlation in expression with pri-miR-29b2∼c in the GSE112509 dataset (Supplementary Figure 3B). This analysis yielded 9 candidate target genes: KCTD5, MYBL2, SLC31A1, MAFG, RCC2, TUBB2A, SH3BP5L, SMS, and NCKAP5L (Supplementary Figure 3C and 3D). Notably, amplification and/or overexpression of any of these 9 genes was associated with poorer survival of melanoma patients (Supplementary Figure 3E), implicating these miR-29 targets in melanoma progression. We selected MAFG for further analyses because MAFG has been implicated in melanoma as an epigenetic regulator and transcriptional repressor (Fang et al., 2016). In addition, phosphorylation by ERK promotes MAFG protein stability (Fang et al., 2016), suggesting that hyperactive MAPK signaling could increase MAFG levels in melanoma.
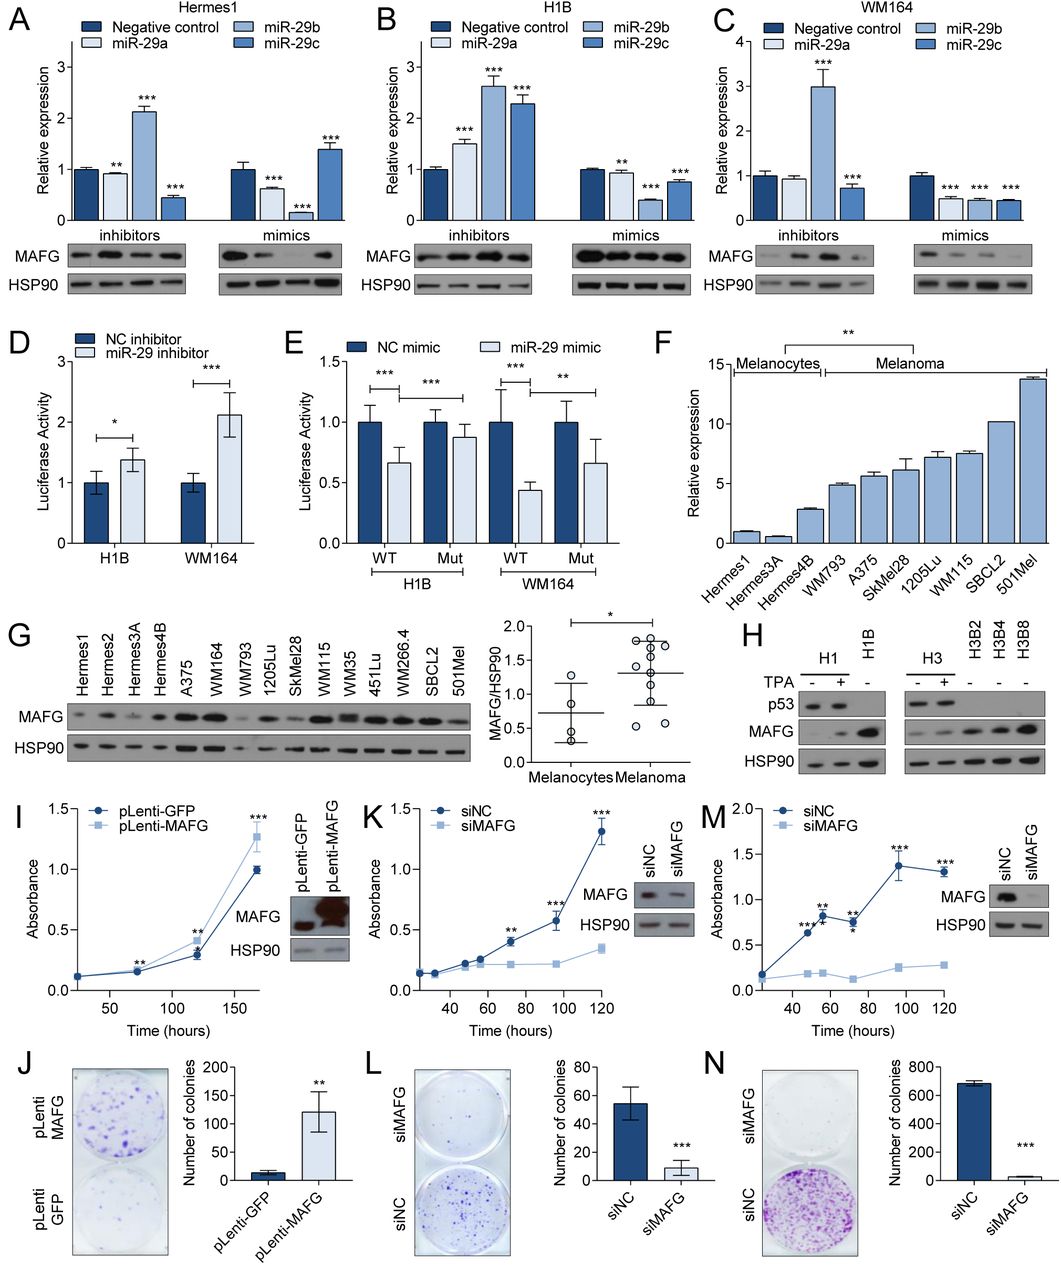
To validate MAFG as a target of miR-29 we first transfected miR-29a, miR-29b, or miR-29c mimics into melanocytes (Hermes1, Hermes3A), BrafV600E-expressing melanocytes (H1B, H3B8), and melanoma cells (A375, WM164). We observed a general reduction of MAFG mRNA and protein expression (Figure 4A-C, Supplementary Figure 4A-C). By contrast, hairpin inhibitors of miR-29a, miR-29b, or miR-29c increased MAFG mRNA and protein levels in these cell lines (Figure 4A-C, Supplementary Figure 4A-C). Next, we created a MAFG 3’UTR Luciferase reporter and mutated the seed sequence of the miR-29 binding site with the highest prediction score (Supplementary Figure 4D). Co-transfection of miR-29 inhibitor with the wildtype MAFG 3’UTR reporter into H1B, H3B8, A375, and WM164 cells increased Luciferase activity (Figure 4D and Supplementary Figure 4E). By contrast, miR-29 mimics reduced the activity of the wildtype MAFG 3’UTR reporter and this effect was partially rescued by the miR-29 binding site mutation (Figure 4E and Supplementary Figure 4F). These findings indicate that MAFG is a bona fide target of miR-29.

(A-C) MAFG mRNA (upper panels) and protein (lower panels) expression upon miR-29 inhibitors (left) or mimics (right) transfection in Hermes1 (A), H1B (B) and WM164 (C). (D) Activity of MAFG 3’UTR Luciferase reporter in response to miR-29 inhibitors. (E) Activity of MAFG wildtype or miR-29 binding site-mutant 3’UTR Luciferase reporter in response to miR-29 mimics. (F) qRT-PCR showing the basal expression levels of MAFG mRNA in melanocytes and melanoma cells. (G) Western blot showing the basal expression levels of MAFG protein in melanocytes and melanoma cells (left). Quantification of the Western blot is shown in the right panel. (H) Western blot showing MAFG expression in response to TPA stimulation or BRAFV600E expression. (I-J) The effect of MAFG overexpression in Hermes1 cells on proliferation (I) and colony formation (J). (K-N) The effect of MAFG silencing in WM164 (K, L) or A375 (M, N) cells on proliferation and colony formation. Western blots in (I, K, M) show the MAFG protein expression changes. For all Western blots, HSP90 was used as loading control. * p < 0.05; ** p < 0.01; *** p < 0.001.
We next assessed whether MAFG may play a role in melanoma development. First, we analyzed MAFG expression in melanocytes and melanoma cell lines and found that MAFG mRNA levels are increased in melanoma cell lines (Figure 4F). This finding corroborates the increase in MAFG mRNA observed in primary melanomas compared to nevi (Supplementary Figure 3D). MAFG protein expression was similarly elevated in melanoma cell lines compared to melanocytes (Figure 4G). TPA treatment increased MAFG protein expression in Hermes1 and Hermes3A cells (Figure 4H), which can be attributed to ERK-mediated MAFG stability (Fang et al., 2016). Interestingly, MAFG protein levels are further increased in BRAFV600E-expressing Hermes cells in which p53 is lost and pri-miR-29b2∼c is reduced (Figure 4H), suggesting gradual MAFG elevation during melanoma progression. Next, we examined the effects of modulating MAFG expression on melanocytes and melanoma cells. Stable overexpression of lentiviral MAFG in Hermes1 melanocytes increased proliferation (Figure 4I) and conferred the ability to form colonies (Figure 4J). Conversely, siRNA-mediated silencing of MAFG in A375 and WM164 melanoma cells markedly attenuated proliferation (Figure 4K and 4M) and colony formation (Figure 4L and 4N), indicating that MAFG has oncogenic potential and is required for the growth of melanoma cells.
DISCUSSION
Deregulation of miRNAs frequently occurs in cancer and is thought to play critical roles in all aspects of tumorigenesis. Here, we investigated the deregulation of miR-29, a miRNA with tumor suppressive properties in various cancer types (reviewed in (Alizadeh et al., 2019)), in melanoma progression. Using MEFs and human melanocytes, we uncover dual regulation of miR-29 downstream of oncogenic RAS and BRAF via MAPK signaling and p53. Diminished expression of the p53-dependent miR-29b2∼c cluster is associated with melanoma progression and inactivation of miR-29 promotes melanoma development in mice. De-repression of MAFG, which we identified as a bona fide target of miR-29, may contribute to melanoma progression.
Previous studies have shown that p53 regulates the expression of both miR-29b1∼a and miR-29b2∼c (Chen et al., 2018; Ugalde et al., 2011). However, our results indicate that transcription of miR-29b1∼a is independent of p53, both in MEFs and in melanocytes. Rather, miR-29b1∼a is regulated directly via MAPK signaling. This discrepancy is likely due to the fact that mature miR-29 species were analyzed by qRT-PCR in the previous studies, a method that failed to distinguish mature miR-29 family members, as has been suggested previously (Kurinna et al., 2014). Several studies have shown cluster-specific regulation of miR-29: NRF2 regulates miR-29b1∼a in keratinocytes (Kurinna et al., 2014) and Gli and NF-κB promote miR-29b1∼a expression in cholangiocarcinoma cells (Mott et al., 2010), while Myc represses expression of both miR-29b1∼a and miR-29b2∼c in B-cell lymphoma (Chang et al., 2008; Zhang et al., 2012a). Thus, each of the two miR-29 clusters is regulated by a distinct repertoire of cancer–associated pathways. Further studies into the regulation of miR-29 ought to include measurements of the primary miR-29 transcripts to avoid ambiguous results stemming from detecting mature miR-29 with low-specificity qRT-PCR methods.
Interestingly, while MAPK signaling promotes expression of only miR-29b1∼a in MEFs, the MAPK pathway induces transcription of both clusters in human melanocytes. It is possible that the regulation of miR-29b2∼c is not conserved between mouse and human or that miR-29b2∼c expression is controlled in a cell type-specific manner. Moreover, the induction miR-29b2∼c by MAPK signaling in melanocytes was much more modest than by p53 activation. Whether MAPK signaling and p53 activation coordinately enhance miR-29b2∼c expression upon acquisition of an oncogenic BRAF mutation or whether miR-29b2∼c is primarily regulated by p53 is unclear. Future studies will have to address these question, as well as identify the transcription factors downstream of the MAPK pathway that induce transcription of miR-29b1∼a and miR-29b2∼c in melanocytes.
Numerous reports describe tumor suppressive functions of miR-29 in cultured cells, including in melanoma cell lines (Cui et al., 2015; Chen et al., 2018; Nguyen et al., 2011; Nishikawa et al., 2015; Xiong et al., 2018; Yu et al., 2014), which we corroborated in our study. Given the tumor suppressive functions of miR-29 and its direct and indirect (via p53) regulation by MAPK signaling, we hypothesized that MAPK hyperactivation could provoke a miR-29-dependent barrier that prevents melanoma formation. The MAPK pathway is almost universally hyperactivated in melanoma, owing to the frequent activating mutations in BRAF and NRAS (Davies et al., 2002; Gray-Schopfer et al., 2005; Satyamoorthy et al., 2003; Sumimoto et al., 2006). Notably, growth arrested nevi are common in humans and >80% of nevi harbor BRAFV600E mutations (Wu et al., 2007; Yeh et al., 2013), suggesting that such a barrier indeed exists (Michaloglou et al., 2005). To overcome this barrier, BRAF/NRAS mutant melanocytes must reverse the increase in miR-29 levels. We observed that miR-29b2∼c expression is decreased in i) melanocytes upon chronic expression of BRAFV600E, which also provoked loss of p53, ii) melanoma cell lines compared to melanocytes, and iii) primary melanomas compared to nevi. It is tempting to speculate that while miR-29b1∼a remains elevated due to continuous MAPK hyperactivation, impaired p53 activity leads to decreased miR-29b2∼c expression, thereby promoting melanoma progression. p53 may play a role in the growth arrest of nevi (Gray-Schopfer et al., 2006; Terzian et al., 2010; Yu et al., 2009), and p53 inactivation in genetically engineered mice promotes melanoma development in the context of BRAFV600E (Viros et al., 2014). Moreover, p53 mutations and copy number losses occur frequently in cutaneous melanoma (Berger et al., 2012; Hodis et al., 2012; Krauthammer et al., 2015; Krauthammer et al., 2012; Zhang et al., 2016). Even more common are deletions of CDKN2A (Hodis et al., 2012; Krauthammer et al., 2015; Krauthammer et al., 2012; Zhang et al., 2016), which besides p16INK4A encodes ARF, a positive regulator of p53 protein stability. A p16INK4A-independent role for ARF in melanoma suppression has been described (Freedberg et al., 2008; Hewitt et al., 2002; Sharpless et al., 2003). Additionally, a subset of melanomas harbor amplifications of MDM2 (Cancer Genome Atlas, 2015; Muthusamy et al., 2006), an E3 ubiquitin ligase that promotes the turnover of p53. Thus, multiple mechanisms of p53 inactivation occur in melanoma, all of which could lead to a reduction in miR-29b2∼c expression.
Using a high-throughput mouse modeling approach, we inactivated miR-29 through expression of a sponge construct specifically in BrafV600E; PtenΔ/+ melanocytes. In agreement with our hypothesis, miR-29 inactivation accelerated the development of melanoma. Not only is this the first model used to study miR-29 inactivation in tumorigenesis, our approach also affirms that synthetic miRNA sponges are powerful tools to examine miRNA function in vivo. One advantage over traditional modeling approaches, such as the previously published conditional knock-out allele of miR-29b1∼a (Kogure et al., 2012), is that a miRNA sponge has the potential to inactivate all members of a miRNA family. However, it is usually not clear how well a sponge interacts with each family member, especially in cases like the miR-29 family where one member, miR-29b, is located in the nucleus (Hwang et al., 2007). Thus, future studies using alternative approaches such as CRISPR/Cas9-mediated specific deletion of individual clusters or miRNAs will further elucidate the role of each miR-29 family member in melanoma. This will also address if a decrease in miR-29b2∼c in melanoma simply lowers the overall miR-29 levels to promote melanoma, indicative of functional redundancy of miR-29a, -29b, and -29c, or if miR-29b and/or miR-29c have specific functions that are impaired upon miR-29b2∼c downregulation.
Since we did not observe changes in the expression of the validated miR-29 targets AKT3, MCL1, and DNMT3B, we identified new targets with putative relevance to melanoma. Of the 9 genes identified by our approach (KCTD5, MYBL2, SLC31A1, MAFG, RCC2, TUBB2A, SH3BP5L, SMS and NCKAP5L), MYBL2 and SLC31A1 have previously been identified as miR-29 targets (Hu et al., 2014; Martinez et al., 2011; Sun et al., 2018; Wu et al., 2013). We selected MAFG for further analyses because the protein is stabilized by ERK-mediated phosphorylation (Fang et al., 2016), suggesting that MAPK signaling converges on MAFG via ERK and miR-29. In addition to being repressed by miR-29, TCGA data indicate copy number gains of MAFG in melanoma. Thus, MAFG is deregulated in melanoma through multiple mechanisms, and our in vitro data further suggest that MAFG plays a critical role in melanoma progression and maintenance. Oncogenic roles for MAFG have so far been described in lung, ovarian, colorectal, and liver cancer (Fang et al., 2016; Liu et al., 2018; Vera et al., 2017), and, interestingly, MAFG is a binding partner of CNC and BACH protein families, including NRF2 (reviewed in (Katsuoka and Yamamoto, 2016)). NRF2 is a critical regulator of redox biology and cellular metabolism (Hayes and Dinkova-Kostova, 2014; Hirotsu et al., 2012), and mutations in NRF2 and its negative regulator KEAP1 occur frequently in lung and upper airway cancers (Cloer et al., 2019). By contrast, mutations in NRF2/KEAP1 are rarely observed in melanoma. Future studies will address if MAFG’s functions in melanoma require binding to and enhancing the transcriptional activity of NRF2, or if other binding partners are critical. Thus, our work has uncovered that miR-29 prevents melanoma progression downstream of MAPK signaling by repressing MAFG.
MATERIALS AND METHODS
Cell culture and treatments
The human immortalized melanocytes cell lines Hermes1, Hermes2, Hermes3A and Hermes4B were obtained from the Functional Genomics Cell Bank at St George’s, University of London, UK, and cultured in RPMI media supplemented with 10% FBS, 10ng/mL hSCF (R&D, Cat # 255-SC), 200nM TPA (Sigma, Cat # P8139), 200pM Cholera Toxin (Sigma, Cat # C8052), and 10nM Endothelin-1 (Sigma, Cat # E7764) at 37°C in a humidified atmosphere containing 10% CO2. A375 cells were purchased from ATCC and WM164 cells were a gift from M. Herlyn. Both cell lines were cultured in RPMI containing 5% FBS at 37°C in a humidified atmosphere containing 5% CO2. BRAFV600E- expressing human melanocytes cell lines were derived by infecting Hermes1 and Hermes3A with a BRAFV600E lentivirus (provided by L. Wan) for six hours in the presence of 8µg/mL Polybrene. Transduced cells were selected in 100nM of Hygromycin (Invivogen, Cat # ant-hg-1) for seven days in the absence of TPA. Four independent clones were picked and expanded until stable cell lines were obtained. MEFs were generated from E13.5-E14.5 embryos from LSL-BrafV600E (Karreth et al., Mol Cell 2009) or LSL-KrasG12D mice (Jackson et al., Genes & Dev, 2001) and cultured in DMEM containing 10% FBS at 37°C in a humidified atmosphere containing 5% CO2. Wildtype males were derived from littermate embryos that did not harbor the LSL-BrafV600E or LSL-KrasG12D alleles. To recombine floxed alleles, MEFs were infected with approximately 107pfu/mL Ad5CMVCre or Ad5CMVempty adenovirus obtained from the University of Iowa Viral Vector Core. Lenti-X 293T cells were obtained from Takara and cultured in DMEM containing 10% FBS at 37°C in a humidified atmosphere containing 5% CO2. All cells were routinely tested for mycoplasma using MycoAlert Plus (Lonza, Cat # LT07-710), and human melanoma cell lines were STR authenticated by Moffitt’s Molecular Genomics Core. Doxorubicin (Fisher Scientific, Cat # BP25131) was used at a final concentration of 10µM for 24 hours and AZD6244 (Selleckchem, Cat # S1008) was used at a final concentration of 0.5µM for 8 or 24 hours.
RNA isolation, RNAseq and quantitative RT-PCR
Total RNA was isolated using TRI-Reagent (Zymo Research, Cat # R2050-1-200) and mature miRNAs were isolated using the miRNeasy Mini Kit (Qiagen, Cat # 217004) according to the manufacturers’ recommendations. For qRT-PCR, 500ng of total RNA were retrotranscribed using PrimeScript RT Master Mix (Takara Bio, Cat. # RR036A), and subsequent TaqMan assay-based or SYBR Green-based qPCR were performed using PerfeCTa qPCR ToughMix (QuantaBio, Cat. # 97065-960) or PerfeCTa SYBR Green FastMix (QuantaBio, Cat. # 95073-012), respectively. Mature miRNAs were retrotranscribed using TaqMan MicroRNA Reverse Transcription Kit (Thermo Fisher, Cat # 4366596) and analyzed by qPCR using PerfeCTa qPCR ToughMix (QuantaBio, Cat. # 97065-960). Samples were analyzed in triplicate using the StepOne Plus PCR system (Applied Biosystems, USA). The comparative threshold cycle method (2-ΔΔCt) was used to calculate the relative expression levels. snoU6 was used as endogenous control for mature miRNAs while GAPDH or β-actin were used for mRNAs and pri-miRNAs. TaqMan Probes for expression analyses were purchased from Thermo Fisher Scientific (U6 snRNA: 001973; mouse β-actin: Mm02619580_g1; human β-ACTIN: mouse Cdkn1a: Mm04205640_g1; mmu-mir-29a: Mm03306859_pri; mmu-mir-29b-2: Mm03307196_pri; mmu-mir-29c: Mm03306860; mmu-mir-29b-1; Mm03306189_pri; hsa-mir-29a: Hs03302672_pri; hsa-mir-29c: Hs04225365_pri; hsa-miR-29a: 002112; hsa-miR-29b: 000413; hsa-miR-29c: 000587). Primers for SYBR Green qPCR were designed to target MAFG (Forward: 5’-CACCCTTCTCTCTTCCCTGCAA-3’; Reverse: 5’-TCTCTCTCCCGCAACTCTCTCT-3’), DNMT3B (Forward: 5’-AGTCGAAGGTGCGTCGTG-3’; Reverse: 5’-AGCCATTGTTCTCGGCTCT-3). AKT3 (Forward: 5’-GAGGACCGCACACGTTTCTA-3’; Reverse: 5’-TGTCTTCATGGTGGCTGCAT-3), MCL1 (Forward: 5’-GAGGACGAGTTGTACCGGCAG-3’; Reverse: 5’-CGTTTTTGATGTCCAGTTTCCGA-3) and GAPDH (Forward: 5’-GAGAGACCCTCACTGCTG-3’; Reverse: 5’-GATGGTACATGACAAGGTGC-3’).
RNA-sequencing
Total RNA from cell lines was sent to Novogene for RNA-sequencing. Data Analysis Downstream analysis was performed using a combination of programs including STAR, HTseq, Cufflink and our wrapped scripts. Alignments were parsed using Tophat program and differential expressions were determined through DESeq2/edgeR. GO and KEGG enrichment were implemented by the ClusterProfiler. Gene fusion and difference of alternative splicing event were detected by Star-fusion and rMATS software. Reads mapping to the reference genome: Reference genome and gene model annotation files were downloaded from genome website browser (NCBI/UCSC/Ensembl) directly. Indexes of the reference genome was built using STAR and paired-end clean reads were aligned to the reference genome using STAR (v2.5). STAR used the method of Maximal Mappable Prefix(MMP) which can generate a precise mapping result for junction reads. Quantification of gene expression level: HTSeq v0.6.1 was used to count the read numbers mapped of each gene. And then FPKM of each gene was calculated based on the length of the gene and reads count mapped to this gene. FPKM, Reads Per Kilobase of exon model per Million mapped reads, considers the effect of sequencing depth and gene length for the reads count at the same time, and is currently the most commonly used method for estimating gene expression levels (Mortazavi et al., 2008). Differential expression analysis: (For DESeq2 with biological replicates) Differential expression analysis between was performed using the DESeq2 R package (2_1.6.3). DESeq2 provide statistical routines for determining differential expression in digital gene expression data using a model based on the negative binomial distribution. The resulting P-values were adjusted using the Benjamini and Hochberg’s approach for controlling the False Discovery Rate (FDR). Genes with an adjusted P-value < 0.05 found by DESeq2 were assigned as differentially expressed.
Plasmids
pBabe, pBabe-BrafV600E, and pBabe-KrasG12D were gifts from D. Tuveson. pLenti-GFP-puro was purchased from Addgene (plasmid #17448). The CMV promoter and puromycin in pLenti-GFP-puro were replaced with the EF1α promoter and blasticidin, respectively, using standard In-Fusion cloning (Takara Bio, Cat. # 638911) to create pLEGB. The Myc-DDK-tagged ORF clone of MAFG (RC221486, OriGene USA) was a gift from I. Ibanez de Caceres and cloned into pLEGB to replace GFP by In-Fusion cloning using the following primers Forward: 5’-acagtctagaggatcctcgactggatccggtacc-3’; Reverse: 5’-gaggttgattgtcgacttgggcatggccaggtagc-3’. The full length MAFG 3’UTR sequence (NM_002359.3 OriGene, USA) was a gift from I. Ibanez de Caceres and cloned into psiCHECK2 plasmid by In-Fusion cloning using the following primers Forward: 5’-taggcgatcgctcgagcgatcgccaaagtccaag-3’; Reverse: 5’-tgtatatgatcagcggaccgggccgctggccgcaa-3’. The psiCHECK2-miR29 Luciferase reporter was created by oligo cloning into psiCHECK2 using the following oligos: sense 5’-tcgacTAACCGATTTCAcGATGGTGCTAgc-3’, antisense 5’-ggccgc TAGCACCATCgTGAAATCGGTTAg-3’.
Site-directed mutagenesis assay
We used the psiCHECK2-MAFG-3’-UTR to generate the miR-29 binding site mutant. Four different miR-29 binding sites were predicted by TargetScan, one of which is highly conserved. Site-directed mutagenesis was performed using the Q5 Site-Directed Mutagenesis Kit (NEB, Cat. # E0554S) according to the manufacturer’s instructions. The primers designed to introduce mutations were: Forward-5’-gactctggtgaCCTTTGACCTGTGGGTGTC-3’; Reverse-5’-gaccgcactttaCCGCTGCACAAAACCTCA-3’.
Cell Transfection and lentiviral transduction
For miR-29 overexpression and inhibition, 100,000 cells/well were plated in 6-well plates and transfected with 150 or 50 nM of Dharmacon miRIDIAN microRNA miR-29a mimic (C-310521-07-0002), hairpin inhibitor (IH-310521-08-0002) or negative controls (CN-002000-01-05; IN-001005-01-05) using JetPrime (VWR Cat # 89129-924) according to the manufacturer’s protocol and assayed after 48 hours. For Luciferase assays, cells were plated in 96-well plates at a density of 10,000 cells/well. psiCHECK-MAFG-3’-UTR_wildtype or psiCHECK MAFG 3’UTR_miR-29-mutant were co-transfected with miR-29 mimics or inhibitors, following the procedure described above. Luminescence was assayed after 24 hours using the Dual Luciferase Assay System (Promega, Cat # E1960), according to the manufacturer’s instructions. Similarly, miR-29-sponge melanoma cell lines were plated at a density of 10,000 cells/well and transfected with psiCHECK2 or psiCHECK2-miR-29 reporter following the same procedure. Luminescence was assayed after 48 hours using the Dual Luciferase Assay System. Results were normalized to the Renilla luminescence. For retroviral transductions, Lenti-X 293T cells were transfected with the retroviral vector and Eco helper plasmid at a 2:1 ratio. For lentiviral transductions, Lenti-X 293T cells were transfected with the lentiviral vector and the Δ8.2 and pMD2-VSV-G helper plasmids at a 9:8:1 ratio. Supernatants were collected 48 hours after transfection and filtered through a 0.45μm filter. Cells were plated in 6-well plates at a density of 300,000 cells/well and transduced with supernatants in the presence of 8 μg/mL Polybrene for 6 hours. Selection was carried out by treating the cells with 10 μg/ml Blasticidin for 5 days or 1 μg/ml Puromycin for 4 days. For siRNA transfections, 100,000 cells/well were plated in 6-well plates and transfected with 25nM of ON-TARGETplus MAFG siRNA (Dharmacon, Cat # L-009109-00-0005) or Non-Targeting control (Cat # D-001810-10-05) using JetPrime (VWR, Cat # 89129-924) according to the manufacturer’s protocol. 8 hours after transfection, cells were trypsinized and replated for cell biological assays.
Proliferation and colony formation assays
For proliferation assays, cells were plated in 96-well plates at a density of 1,000 - 2,500 cells/well and harvested for five days. Cells were fixed and stained with 0.1% crystal violet (VWR, Cat # 97061-850) solution in 20% methanol for 20 minutes followed by extraction of crystal violet with 10% acetic acid. Absorbance was measured at 600 nm using a plate reader. For colony formation assays, cells were plated in 6-well plates at a density of 1,000 - 2,000 cells/well and cultured for 2-3 weeks. Cells were fixed and stained with 0.1% crystal violet (VWR, Cat# 97061-850) solution in 20% methanol for 20 minutes. Colonies were quantified using Image J software.
Immunoblotting
Protein isolation was performed as previously described (Bok et al., 2019). 20μg of total protein were subjected to SDS-PAGE and Western blot, performed as previously described (Bok et al., 2019). Primary antibodies used were BRAF (Sigma, Cat # HPA001328), KRAS (Santa Cruz, Cat # sc-30), HA-Tag (Cell Signaling, Cat # 3724T), human p53 (Santa Cruz, Cat # sc-126), mouse p53 (BioVision, Cat # 3036-100), p21 (Abcam, Cat # ab109199), ERK (Cell Signaling, Cat # 4695), pERK (Cell Signaling Cat # 9101S), c-Jun (Cell Signaling Cat # 9165S), MAFG (Thermo Fisher Scientific, Cat # PA5-90907) and HSP90 (Cell Signaling, Cat # 4874)
ES cell targeting, mouse generation, and ESC-GEMM experiments
ES cell targeting and generation of chimeras was performed a described previously (Bok et al., 2019). Melanoma development was induced in 3-4 week old chimeras using 25mg/mL 4-OH Tamoxifen as described previously (Bok et al., 2019). Mice were fed 200mg/kg doxycycline (Envigo, Cat # TD180625) ad libitum. All animal experiments were conducted in accordance with an IACUC protocol approved by the University of South Florida. The derivation of the murine melanoma cell line from an ESC-GEMM chimera was performed as described previously (Bok et al., 2019).
Statistical analysis
Statistical analysis was performed using GraphPad Prism software. Survival data were compared by applying the Log-rank (Mantel-Cox) test, and all other data were analyzed with the unpaired two-tailed t-test or ordinary one-way ANOVA. A p-value below 0.05 was considered statistically significant.
AUTHOR CONTRIBUTIONS
Conceptualization, FAK and OV; Methodology, FAK, OV, IB; Investigation, FAK, OV, IB, NJ, KN, XX and NM; Writing-Original Draft, FAK and OV; Writing – Reviewing and Editing, FAK, OV, IB, NJ, KN, XX and NM. Funding Acquisition, FAK; Resources, FAK; Supervision FAK.
ACKNOWLEDGEMENTS
We thank A. Nyein and O. Balogun for technical assistance and Dr. I. Ibanez-de-Caceres for plasmids. This work was supported by grants to F.A.K. from the NIH/NCI (R03 CA227349) and the Melanoma Research Alliance (MRA Young Investigator Award and Team Science Award). This work was also supported by the Gene Targeting Core, Molecular Genomics Core, and Biostatistics and Bioinformatics Core, which are funded in part by Moffitt’s Cancer Center Support Grant (NCI, P30-CA076292).


