

Abstract
Spatial dynamics of range-shifting species can be deeply affected by biotic interactions. One ubiquitous type of biotic interaction involves parasites. These can affect nearly all biological systems and impose major selective pressure on the host, leading to rapid evolutionary responses. Despite the potentially large impact of parasites, their role on host dispersal and subsequent range expansions remains mostly unexplored.
Therefore, we investigated whether parasites affect and alter host evolution during experimental range expansions. Using microbial model organisms spreading in microcosm landscapes, we found multi-trait evolution and rapid evolutionary shifts in dispersal syndromes due to spatial dynamics and parasitism. As predicted by theory, hosts that had evolved in the absence of parasites changed their movement pattern and increased dispersal at the range margins. The presence of parasites during the range expansion reshaped host phenotypic divergence between front and core, with hosts exhibiting overall reduced dispersal but increased resistance in the front. We suggest that the evolved differences in resistance and other host traits may be associated with a trade-off between dispersal and foraging efficiency.
Our work shows that the eco-evolutionary interactions between host and parasite during range expansions can shift the contenders to novel evolutionary trajectories and result in unexpected evolutionary outcomes. Understanding and finding general patterns to these complex dynamics is of critical relevance for conservation and disease management.
Introduction
Species are on the move, and their ability to shift ranges and track climate changes have become crucial to escape the risk of extinction (Thomas et al., 2004) and respond to the climate crisis and the anthropogenic alteration of the environment (Hill et al., 1999; Parmesan and Yohe, 2003). Additionally, biological range expansions can affect biodiversity, community structure and ecosystem functioning (Hastings et al., 2005; Pecl et al., 2017). Despite the importance of such dynamics, it is rarely considered how biotic interactions such as parasitism may affect the final outcome (Kubish et al. 2014). The expanding species may carry or encounter a parasite along the way and establish a new (co)evolution history, which may determine or alter the spatial spread. This could potentially lead to disease outbreaks and unpredictable results, with great concern for human health and agriculture (Poulin, 2017).
The evolution of dispersal (Bowler and Benton, 2005; Clobert et al., 2012; Ronce, 2007) and dispersal syndromes, the covariation between dispersal and other dispersal-related traits (Clobert et al., 2009, 2012; Cote et al., 2017; Stevens et al., 2014), is a well-established phenomenon highly supported by theoretical and growing empirical evidence (reviewed in Kubisch et al., 2014). It has the potential to accelerate range expansions between core and front populations, alter metapopulation dynamics and generate unexpected eco-evolutionary feedbacks (Govaert et al., 2019; Hanski, 2012; Legrand et al., 2017). However, how parasitism, the most common and ubiquitous form of biotic interaction, might affect the evolution of such dispersal syndromes remain largely unexplored. In fact, the increase of dispersal due to spatial selection, spatially assortative mating or kin competition has been usually considered in single species, e.g. bacteria (Koskella et al., 2011; Taylor and Buckling, 2011), protists (Fronhofer and Altermatt, 2015), nematodes (Friedenberg, 2003), several arthropods species (Alford et al., 2009; Leotard et al., 2009; Lombaert et al., 2014; Ochocki and Miller, 2017; Petegem et al., 2018; Simmons and Thomas, 2004; Weiss-Lehman et al., 2017; Williams et al., 2016), vertebrates (Alford et al., 2009; Phillips et al., 2006) and even in plants (Szűcs et al., 2017). Only a limited number of studies explored the consequences of species interactions on host dispersal evolution. These were focused on predation (Pillai et al., 2012; Poethke et al., 2010), or on the epidemiological and ecological outcome of parasites altering the biological relationships once arrived the new habitat (Dunn et al., 2012; Strauss et al., 2012). Hence, we still have limited to no knowledge of the effect of parasites on the evolution of the spreading host and on their impact on the range expansion itself (Kubisch et al., 2014).
Rapid evolution can deeply affect the outcomes of range expansions (Williams et al., 2016, 2019), and parasites impose additional strong selective pressures on the host due to virulence and mortality (Daversa et al., 2017; Sheldon and Verhulst, 1996). The little theory developed shows that parasitism may either promote or confine range expansion. Strong oscillation in host population densities due to parasitism promoted host dispersal and bet-hedging strategies, independently of dispersal costs (Chaianunporn and Hovestadt, 2012a). Interestingly, different parameter combinations not leading to such spatio-temporal variability and oscillations may select against dispersal (Chaianunporn and Hovestadt, 2012a). In another theoretical work, parasites (natural enemies and parasitoids in the paper) enforced the limits of range expansion of their hosts (Hochberg and Ives, 1999). Similarly, modelling on plant systems emphasizes that long seed dispersal can be achieved when parasitism is associated with high host survival (low virulence) and lower dispersal costs (Muller-Landau et al., 2003). Yet, this is rarely the case, and the ubiquity of parasites and pests (Packer and Clay, 2000) impose high costs, limiting and constraining dispersal. Hosts likely rely on integrated genetic, physiological, functional or behavioural responses to face parasites during dispersal (Brown et al., 2015). Further, dispersal is a heritable trait itself (Saastamoinen et al., 2018) which allows population to respond to the potential differences in selection occurring in core or front populations and may drive phenotypic divergence with concurrent changes in other traits. Depending on the genetic architecture of host traits, this may or may not impose constraints on the constitutive evolutionary responses (Hall et al., 2017). The joint action of multiple selection pressures on dispersal, life-history, or interacting traits such as resistance, may lead to the evolution of different trait associations, and thus different syndromes. For example, in the case of physiological or life history trade-offs, dispersal selection at the range front may be impeded by parasite-mediated selection, such that the presence of parasites would effectively slow down a range expansion.
Thus, how do the different selective pressures driving the emergence of dispersal syndromes and the response to parasitism interact in shaping host multi-trait evolution and range expansion? Through an experimental evolution approach, our goal was to investigate host phenotype diverge during a range expansion scenario and whether this was additionally affected by parasitism. We mimicked range expansions in laboratory microcosms, and in a common garden experiment we measured six relevant host traits using the host Paramecium caudatum and its bacterial parasite Holospora undulata. For simplicity we only tracked range core and range front populations: the front of infected or uninfected populations constantly dispersed into new microcosms, while the core always remained in place. We expected increased dispersal in the front, and this to be a main driver of multi-trait phenotypic divergence with concurrent changes in movement patterns, growth and population size. We predicted parasites to affect and modify host dispersal syndromes and phenotypic divergence by reducing dispersal in the infected populations and driving selection for increased resistance (Koskella et al., 2011). Since dispersal and resistance are predicted to be both costly (Bonte et al., 2012; Schmid-Hempel, 2003), the interactions and interplay of these two with the other traits, and the relative outcome of the spatial dynamic, might then depend on which selection acts stronger. Overall, the results are in accordance with our predictions confirming trait divergence between core and front populations. Parasitism modified the outcome of the range expansion reshaping host phenotypic divergence in the core and front. Considering how hosts rarely disperse alone, and that they can encounter and establish novel parasitic associations during their spread, understand the effect of parasitism on range expansion has relevant implications for biological control, conservation and management decisions.
Material and methods
Study system
Paramecium caudatum is a freshwater filter-feeding ciliate from the Northern Hemisphere (Wichterman, 1986). Nuclear dimorphism is typical of ciliates: The “germ-line” micronucleus is active during the sexual stage, while the highly polyploid “somatic” macronucleus regulates gene expression during the asexual stage, when replication occurs through mitotic division. In this experiment, clonal populations are maintained asexually (max. 1-2 population doublings per day at constant 23°C) in 50 ml FalconTM tubes, using a sterilised lettuce medium (1g dry weight of organic lettuce per 1.5l of Volvic mineral water), supplemented ad libitum with the bacterium Serratia marcescens as a food resource (referred to as bacterised medium, hereafter; see Nidelet and Kaltz, 2007). The gram-negative bacterium Holospora undulata is an obligate parasite, infecting the micronucleus of the P. caudatum (Görtz & Fokin 2009). The infection life cycle comprises both horizontal and vertical transmission (Fokin, 2004). Paramecium ingest infectious forms from the aquatic environment, which subsequently colonise the micronucleus and differentiate into multiplying reproductive forms; these reproductive forms are vertically transmitted to the daughter cells of mitotically dividing hosts. The infection life cycle is completed when reproductive forms differentiate into infectious forms, which are then released during host cell division or upon host death (Nidelet and Kaltz, 2007). Infection reduces cell division and survival of the Paramecium (Restif and Kaltz, 2006), as well as dispersal (Fellous et al., 2011). Experimental evolution of resistance to this parasite was demonstrated in previous long-term experiments (Lohse et al., 2006) and can come at reproductive costs (Duncan et al., 2011).
Long-term range expansion experiment
Dispersal arenas
Similar to Fronhofer & Altermatt (2015), we used two-patch arenas for this selection experiment (Supplementary Information, Fig. S1). The arenas were built from two 14 mL plastic tubes (“core patch” and “front patch”) interconnected by 5-cm silicon tubing (0.6 mm inner diameter) serving as a corridor through which the Paramecium can actively swim and disperse. We define dispersal as the displacement of P. caudatum from the core patch to the front patch. In the long-term experiment, short episodes of dispersal (3h) alternated with periods of population growth and maintenance (1 week). Prior to each dispersal episode, the core patch was filled with 8 mL of Paramecium culture topped up with 5 mL of bacterised medium, whereas the front patch only contained 13 mL of bacterised medium (for details of the protocol, see the Supplementary Information). After the removal of a clamp that blocked the connection between the two tubes, Paramecium could freely disperse to the front patch or to stay in the core. After three hours, we blocked the corridor and estimated the cell density in the core and front patch, by sampling up to 1mL from each tube and counting the number of individuals under a dissecting microscope. The dispersal rate is thus the number of dispersers divided by the total number of individuals in the arena, divided by 3 hours.
Range expansion treatment
Two selection treatments were imposed. In the front selection treatment, only Paramecium that had dispersed into the front patch were maintained and allowed to grow for 1 week until the next episode of dispersal. Conversely, in the core selection treatment, only the non-dispersing Paramecium were maintained and allowed to regrow. These contrasting selection protocols were continued for a total of 26 cycles. The front selection treatment mimics the leading front of range expansion or a biological invasion, with populations continuously dispersing into a new microcosm. Populations from the core selection treatment stay in place and continuously lose emigrants. Each new growth cycle was started by placing on average 200 Paramecia from front and core selection treatments in 20 mL of fresh bacterised medium, carrying capacity was then reached within the following 3-4 days. The experiment was conducted with a single host line (63D). This line had undergone three years of parasite-free core selection prior to the present experiment; initially started from a mix of strains, it has become fixed for a single haplotype (O. Kaltz, unpublished data).
Parasite treatment
Core and front treatments were established for both infected and uninfected populations. Starting from a 63D laboratory culture, infected and uninfected selection lines were established. The parasites were taken from an ongoing experiment (Nørgaard et al. 2020, in prep.) that had already been imposing core and front selection on infected 63D populations for about 8 months (30 cycles). Using standard protocols (e.g., Duncan et al. (2011) and Supplementary Information), we extracted infectious forms of the parasite from 5 core selection lines and from 5 front selection lines, which were then used to inoculate our new, naive 63D hosts. In other words, we continued core and front selection treatments for the parasite, but replaced the previous hosts by new unselected hosts. In addition to these 10 infected selection lines, we established 3 uninfected front-selection lines and 3 uninfected core-selection lines as controls.
Adaptation assay
At the end of the long-term experiment, phenotypic trait assays for Paramecium from all 16 selection lines were performed under common-garden conditions. Parasite evolution will be analysed elsewhere (Nørgaard et al. 2020, in prep.).
Singleton isolation protocol
Using a micropipette, we arbitrarily picked 4 uninfected paramecia from each selection line and placed them individually in single 1.5 mL Eppendorf tubes filled with bacterised medium, where they were allowed to grow for 2 weeks until small monoclonal lines had established (c. 7-8 asexual generations). Each monoclonal line was then split into three technical replicates and grown for a second common-garden period of 10 days in 50-mL Falcon tubes to obtain mass cultures for the phenotype assays (16 selection lines x 4 monoclonal lines x 3 technical replicates = 192 replicates, Supplementary Information Fig. S3).
Phenotypic trait assays
After the second common-garden period and relaxed selection (absence of parasite, no dispersal treatment), technical replicates from 60 monoclonal lines were available for specifically designed tests measuring 6 phenotypic traits (Supplementary Information Fig. S3).
Resistance
To measure resistance, the Paramecium were confronted with parasites from core-selection and front-selection lines. We prepared the inocula by mixing the 5 infected core and 5 infected front selection lines, and extracting infectious forms from the two mixes (for details of the extraction protocol, see Supplementary Information 1). For inoculation, c. 5000 Paramecia were placed in a volume of 25 mL in a 50-mL tube, to which we added 4.5 × 10⁵ infectious forms (core-parasite or front-parasite inoculum). In this way, we set up 4-8 inoculated tubes per host selection line, balanced between the two parasite inocula (16 selection lines x 2-4 monoclonal lines x 2 technical replicates = 120 inoculated tubes). Four days post-inoculation, we fixed c. 20 individuals from each inoculated replicate with lacto-aceto-orcein (Görtz & Fokin 2009) and determined the absence or presence of infection using a phase-contrast microscope (1000x magnification). We define resistance as the proportion of uninfected individuals in the sample. Preliminary analysis showed that Paramecium from the four different selection treatments did not differ in their resistance to the mixes of front or core parasites (F3,12 = 0.44, n.s.); we therefore combined the two inoculum sources into a single “infected” category for the main analysis.
Dispersal rate
Dispersal was measured in linear 3-patch arenas (50 mL Falcon tubes; Fig. S2), where the Paramecium dispersed from the middle tube into the two outer tubes (see Supplementary Information 1 for detailed protocol). This arena configuration allowed us to use bigger volumes of culture and to obtain higher numbers of dispersers. Connections were opened for 3 h, dispersal rates were then estimated by counting the Paramecium in samples from the central tube (500 µl) and from the combined two outer tubes (3 mL). We employed technical replicates that had not been used for the resistance assay, and were kept in 30 mL of bacterised medium for several days prior to the dispersal test (1 replicate per monoclonal line = 60 dispersal tests = 2-4 tests per host selection line).
Population growth rate and equilibrium density
For the population growth assay, we placed groups of 5 arbitrarily picked Paramecium in 15-mL tubes filled with 10 mL of bacterised medium. Over 9 days, we tracked densities in 24-h intervals, estimated from number of individuals present in 200-µL samples. We set up 6-12 tubes per host selection line (3 tubes per monoclonal line), with a total of 180 tubes tested. For each tube, estimates of intrinsic population growth rate (r0) were obtained by fitting a Beverton-Holt population growth model to each density time series, using a Bayesian approach (Rosenbaum et al., 2019). For certain tubes we obtained unsatisfactory fits of carrying capacity; we therefore decided to use the mean density over the second half of the assay (day 5-9) as a proxy for equilibrium density. 19 tubes failed to produce a coherent growth pattern and remained at very low density; it was not possible to fit our population growth model to these data, and the tubes were therefore excluded from analysis.
Swimming speed and tortuosity
At the end of the above population growth assay, we analysed swimming behaviour, using an established pipeline of computer vision and automated video analysis to collect this data (Altermatt et al., 2015; Pennekamp et al., 2015). From a given tube, one sample of 119 µL was imaged under a Perfex Pro 10 stereomicroscope, using a Perfex SC38800 camera (15 frames per second; duration: 10 s; total magnification: 10x). Videos were analysed using the bemovi R-package (Pennekamp et al., 2015; for settings see script in supplementary materials), which provided individual-based data on swimming speed and the tortuosity of swimming trajectories (= standard deviation of the turning angle distribution). Swimming speed and tortuosity were averaged over all individuals in a sample prior to analysis. A total of 60 samples (1 per monoclonal line) was used for analysis, giving 2-4 observations per host selection line.
Statistical analysis
Our main focus was the analysis of trait associations. To this end, we constructed a data matrix with the measurements of the 6 traits for 60 monoclonal lines (for resistance, the mean over the two technical replicates was calculated). To impute 10 missing observations in population growth rate and equilibrium density we used the “missMDA” package version 1.16 (Josse and Husson, 2016). Using the approach of Stoks et al. (2016), trait distributions were normalised by picking the best transformation (“bestNormalize” package version 1.4.2 of Peterson and Cavanaugh, 2019), centred to their mean and scaled by their standard deviation. We then performed a multivariate analysis of variance (MANOVA), with range expansion treatment (core vs front selection lines), parasite treatment (infected vs uninfected control selection lines) and their interaction considered as fixed factors. Selection line identity was included as random factor. From this same data set, we also performed univariate analyses for each of the 6 traits. In a second step, to better understand the multivariate results, we performed a principal component analysis (PCA), based on the means per selection line and thus a data matrix of 16 x 6 = 96 observations. To complement graphical inspection of results, we used the first and second components (PC 1, PC 2) for ad-hoc comparisons between treatments. All statistical analyses were performed with R v 3.6.2 (R CoreTeam 2017).
Results
Univariate analyses and MANOVA
We found signatures of selection history in the observed phenotypic trait variation and covariation (Table 1). In all univariate analyses, there were significant effects of range expansion treatment (4 traits), parasitism treatment (3 traits) or their interaction (3 traits). Except for the two swimming traits, we mostly detected simultaneous signals of the two selection treatments (Table 1, Fig. 2). This multi-trait divergence was confirmed by the MANOVA (Table 1). Looking at all traits combined, this analysis revealed significant effects of the parasitism treatment (p = 0.002) as well as significant effects of the range expansion treatment (p < 0.001) and their interaction (p = 0.046). This revealed that both selection treatments acted jointly to produce a strong phenotypic differentiation in the Paramecium.
Results of the MANOVA and ANOVAs for the effect of range expansion and parasitism treatment and of their interaction on the six host traits analysed. The significant p-values are highlighted in bold.
Principle component analysis (PCA)
By means of PCA, the (co)variation in multidimensional trait space can be projected onto two main axes (PC 1 and PC 2). This allows us to describe the divergence of treatments in 2-dimensional space and to identify the individual traits that contribute most to this divergence (Fig. 1). First, along the PC 1 axis, we observed a clear effect of the range expansion treatment (front vs core selection), as illustrated by the separation of the respective clouds of points (red vs blue). This front/core separation is complete for the parasite-free selection lines (lower two clouds in Fig. 1, F 1,4 = 17.70, p= 0.013), and for selection lines evolving in the presence of the parasite (upper two clouds, F 1,4 = 6.77, p= 0.031). The direction and length of the different arrows in Fig. 1 show that the observed patterns were mainly driven by differences in swimming behaviour (PC 1 highest two loadings: speed −0.5295, tortuosity +0.5221). As found in the univariate analyses (Table 1), Paramecium from the front treatment had a 12% lower swimming speed than Paramecium from the core (Fig. 2E), instead swam in a more non-linear fashion (23% higher tortuosity; Fig. 2F). Second, along the PC 2 axis, phenotypic differentiation was driven by the parasite selection treatment. This separation between parasitised and parasite-free selection lines was complete for the front-(upper vs lower red clouds, Fig. 1, F 1,4= 7.32, p= 0.035) but less pronounced for the core-selection treatment (upper vs lower blue points, Fig. 1, F 1,4= 5.12, p= 0.064). Direction and length of their arrows indicate that resistance and dispersal are the key traits responsible for this multivariate response (PC 2 highest two loadings: dispersal −0.6605 resistance +0.6118). Specifically, the univariate analyses (Table 1) show that exposure to parasites was linked with an increase in resistance for front selection lines (+ 10%, Fig. 2B), and a general decrease in dispersal (−50%, Fig. 2A) In summary, the treatment combining new front selection conditions with new exposure to parasites produced the strongest phenotypic divergence relative to the negative control treatment (no parasite, continued core selection). Multiple traits contribute to this divergence, with strongest signals from parasite resistance, dispersal and movement-related traits. The details of the PCA are provided in the Supplementary material Table S1 and S2.
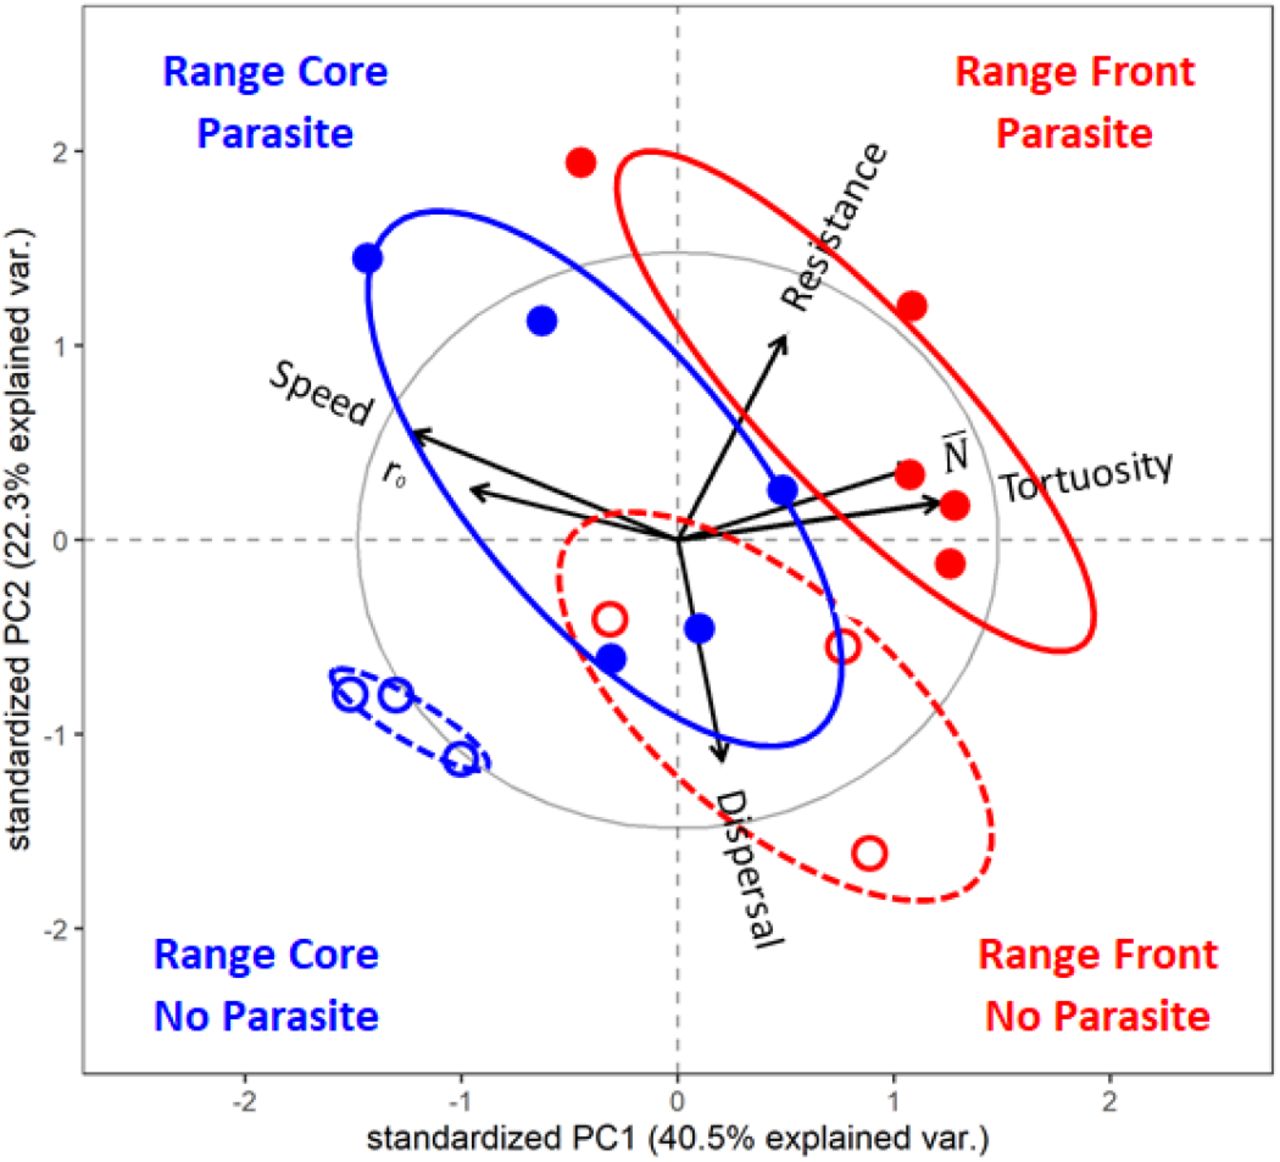
PCA of the six host traits considering the first two principal component axes, PC 1 and PC 2. The length of the thin arrows inside the graph represents the loading values; the longer the arrow the higher the correlation with the PC axis and the variance explained by that trait. The points are the phenotypic values of the selection lines in multivariate space: core (blue) and front (red) of a range expansion in the presence (full dots) or absence (empty dots) of parasites. The blue empty dots with dotted ellipsis represent the ancestral host populations. The ellipses represent the 68% containment probability region of the multivariate space for the four evolutionary treatments. The black arrows on the x and y axis show the evolutionary direction of the host phenotype due to the selection imposed by range expansion and parasitism.
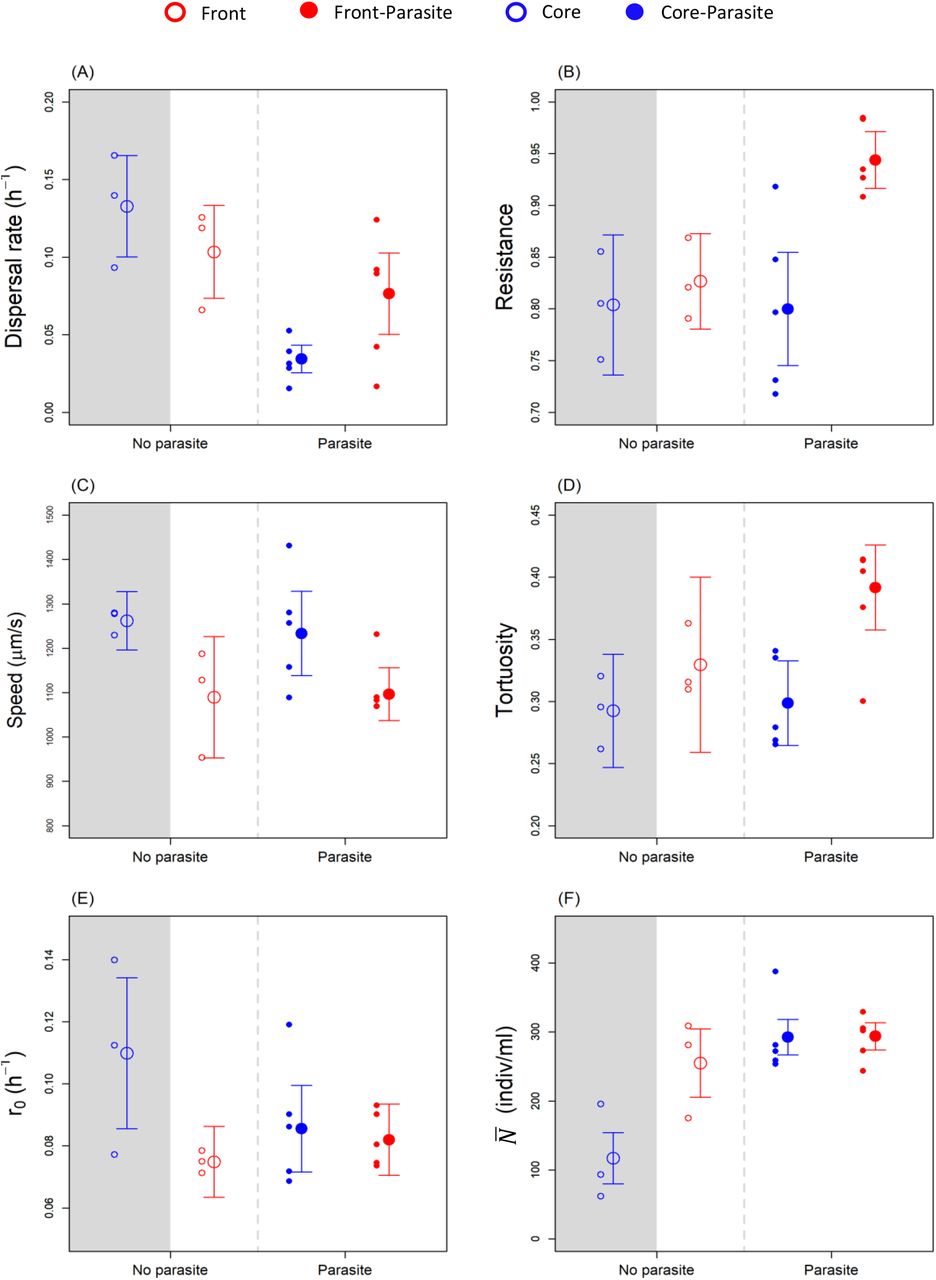
Univariate response for the six traits, the grey area can be considered as the original condition of the trait. The small dots represent the mean values for the replicate lines, the big dots with the bars are the overall mean of the trait and the associated standard error. (A) Dispersal rate as the number of individuals dispersing per hour, (B) resistance as the proportion of uninfected individuals, (C) speed as µm per second, (D) tortuosity as the standard deviation of the turning angle distribution, (E) r0 as the intrinsic rate of increase per hour, and (F)  as the individuals per mL.
Discussion
Natural populations are currently forced to climate and human-induced range-shifting during which they encounter new selective pressures as parasitism. We observed fundamental phenotypic divergence in the core and front populations during range expansions, suggesting an integrated evolutionary response of the host to spatial dynamics. Parasitism altered and reshaped such divergence, adding selection for resistance and moving host populations towards different phenotypic patterns. All host traits showed evolved differences to range expansion or parasitism, confirming the emergence of dispersal syndromes and rapid evolutionary responses to strong abiotic and biotic selective pressures.
Understanding how ecological dynamics such as range expansion affect the evolution and the trajectory of phenotypic traits is of major interest and relevance for conservation, control infectious disease and epidemic outbreaks, and to establish proper species invasion management. Range expansions are mainly driven by dispersal, a complex and multidimensional trait (Saastamoinen et al., 2018), determined by several characters; physiological, morphological and behavioural (Clobert et al., 2012). In line with theoretical and empirical results on range expansion dynamics, we found evidence for dispersal syndromes with increased dispersal in the range front compared to the ancestral populations, and modification in movement pattern (Cote et al., 2017; Fronhofer and Altermatt, 2015; Kubisch et al., 2014; Phillips et al., 2006; Stevens et al., 2014; Williams et al., 2019). Counterintuitively, the high dispersers evolved lower swimming speed. This a repeatable and known result observed in other experiments with this strain of P. caudatum (Kaltz et al. unpublished). Moreover, speed reduction was associated with increased tortuosity, i.e. the ability of the individuals to change directions while swimming, which could be considered as an exploratory behaviour that increase the probability to find a dispersal corridor.
The dispersal syndromes and phenotypic divergence observed in the host primarily emerged from our experimental design of simulated range expansion. However, the arrival of the parasite imposed an additional new strong selection on the host, involving resistance and dispersal as key traits. Resistance is major trait selected under parasitism, and it has often been observed to evolve in this, and during other host-parasite evolutionary experiments (Boots and Begon, 1993; Brockhurst et al., 2007; Haag and Ebert, 2004; Lennon et al., 2007; Lohse et al., 2006). In our work, increased resistance only evolved in the front under parasitism, even though we would have expected a similar higher level of resistance for core facing parasites compared to the ancestral stage. Additionally, we observed an overall reduced dispersal, but selection seemed to be strong enough to maintain higher level of dispersal in the front population under parasitism compared to the core, confirming parasitism to differently interact with front and core during the range expansion dynamic.
Results for a correlation of resistance and dispersal are limited and unclear (Taylor and Buckling, 2013). Our results may suggest that a trade-off between the costly dispersal and resistance (Bonte et al., 2012; Schmid-Hempel, 2003) may emerge in the front of a range expansion (Fig. 3). The response of Pseudomonas aeruginosa to phages similarly suggested the presence of a negative trade-off between the two traits (Whitchurch and Mattick, 1994). In contrast, the experimental evolution of the bacterial host Pseudomonas syringae with lytic phage showed no such clear link (Koskella et al., 2011). As systemic immunological in response to infection or recovery from infections are not known in the P. caudatum-H. undulata system, another possible explanation is that resistance is associated to a negative trade-off between dispersal and foraging. P. caudatum is a filter-feeder ciliate and get infected with the bacterial parasite H. undulata by ingesting spores. If the paramecia in the front have higher dispersal and lower foraging success as we found, they might have a reduced probability of ingesting the free infectious forms in the aquatic environment. Despite this remain speculation, the trade-off between dispersal and foraging efficiency further illustrates and well describes the evolved differences in  and r0. Interestingly, our findings (high r0 and low
  in the core vs low r0 and high
  in the front) match a microcosm range expansion experiment with the protist Tetrahymena pyriformis (Fronhofer and Altermatt, 2015). Using a consumer-resource framework, an eco-evolutionary feedback loop based on a trade-off between dispersal and foraging was disclosed; higher dispersal and lower foraging success in the front, lower dispersal and higher foraging success in the core.

Potential trad-off dispersal and resistance. The small and big dots are respectively the mean values for the replicate lines and the overall means, and bars show associated standard error. Colour codes refer to core (blue) and front (red) treatment during range expansion under parasitism (full dots) or not (empty dots). The blue empty dots represent the ancestral host populations.
Parasitism, by impeding dispersal, may affect and modify the pace of a range expansion. This may represent either the case of an expanding species spreading with a parasite already present in the population, or the establishment of a novel host-parasite association during the spatial shift. Considering how dispersal syndromes involve the divergence and constrain on many phenotypic traits as we detected, lower dispersal may not necessarily slow down range expansion. For example, depending on the spatio-temporal habitat variability (Poethke et al., 2003) or habitat niche width (Chaianunporn and Hovestadt, 2012b), many other traits, including life-history, may favour the colonisation and establishment of a new patch and accelerate the process of range expansion (Burton et al., 2010). The selective pressure due to range expansion and parasitism likely modifies the genetic correlation or the genetic architecture underlying host phenotypic traits. These pressures and their interaction will produce diverse patterns of divergence, leading to changes in the whole host phenotype with unexpected traits modification or the emergence of trade-offs. The phenotype will then move into the evolutionary space and respond to new ecological selective forces, which could create ecological feedbacks direct on other traits and finally influence back evolution. The phenotypic integration is therefore essential to shed light on how complex traits like dispersal and its relationships with other traits respond to eco-evolutionary pressure in natural populations.
Here, we showed rapid phenotypic divergence of core and front populations, which was also affected and mediated by parasitism. Since these dynamics are increasing in frequency and since parasites can i) alter the success and speed of range expansions, ii) highly affect the evolution of their hosts during these spatial dynamics leading to unexpected evolutionary trajectories and eco-evolutionary feedbacks, but also iii) impact community composition, more effort towards obtaining a better comprehension and identify general patterns to this important phenomenon.
Author contributions
OK, LN and GZ conceived the study. GZ, LN, CGB and OK performed the experimental work. GZ, LN, OK and EAF performed the statistical analysis. All authors interpreted the results. GZ and OK wrote the first draft of the manuscript and all authors commented on the final version.
Supplementary Information
Extraction protocol
Inocula were prepared concentrating by centrifugation infected paramecia (35000 RPM for 20 minutes) in Falcon tubes filled with 15 mL of medium. After removing the supernatant, the concentrated individuals were transferred into 1.5 mL Eppendorf tubes containing 1 mm glass beads, and they were vortexed and crushed using a Qiagen TissuLyser (1.45 minutes at 30 oscillation frequency). The released infectious forms were then counted using a hemocytometer at 200 x magnification under a microscope (Leica DM LB2), and their concentration was adjusted with sterile water.
Dispersal arenas
We first filled the two-patch system with 9.5 mL of fresh growth medium and we then closed the corridor with a clamp. Secondly, we filled to 12 mL one of the two tubes, the core patch, using the paramecia and medium from an experimental selection line. The second tube, the front patch, was filled to 12 mL with fresh growth medium, and thus resulted empty at this stage. Thirdly, we removed the clamp and opened the corridor allowing the paramecia to actively disperse and swim from core to front patch or to stay in the core. After three hours, we closed the corridor tube and we estimated the population density by taking a 200 µL sample from core and front patch and counting the number of individuals under a dissecting microscope.

Dispersal arenas used for the range expansion dynamics with representation of how the front treatment was propagated. The arenas were composed from two patches (core and front) interconnected by 5-cm silicon tubing serving as a corridor. The paramecia could displace from core to front patch through active dispersal once we removed the clamp blocking the corridor. In the long-term experiment, we alternated short episodes of dispersal (3h) with periods of population growth and maintenance (1 week = 1 cycle).
Dispersal rate
We followed a similar procedure to what was previously described for thedispersal arenas. In short, we filled the 3-patch systems with 40 mL of fresh growth medium, we closed the two corridors with clamps, and then added the entire 25 mL of the final tube to the central compartment. Left and right tubes were filled with fresh growth medium to have the same amount of volume of the central tube, then the corridors were opened. We allowed the paramecia to actively disperse in both directions for three hours before closing the dispersal corridors again. We sampled 500 µL from the core patch, 3 mL from both front patches and we estimated population densities.

Linear 3-patch arena used to measure dispersal rate after evolution (3 interconnected 50 mL Falcon tubes). The Paramecium dispersed from the middle to the two outer tubes (arrows). Similarly to the protocol used during the long-term experiment, we opened the corridors for 3 h. Dispersal rates were estimated by sampling and counting the Paramecium from the central tube (500 µl) and from the combined two outer tubes (3 mL). We did not control for the density of Paramecium placed in the middle tube of the dispersal arena. However, preliminary analysis showed no significant effect of density on dispersal rate (F1,54= 0.69, n.s.), and the covariate was therefore omitted from further analyses.

Experimental design of the adaptation assays (16 x 4 x 3 tubes). Some technical replicates were lost during the manipulation, and the final number was 180. This corresponded to the total of 60 monoclonal lines that were used in the analysis.
Eigenvalues, variance explained.
Loading values of the PCA.
Acknowledgements
This work was funded by the Swiss National Science Foundation (grant no. P2NEP3_184489) to GZ and by the 2019 Godfrey Hewitt Mobility Award granted to LN by ESEB.
This is publication ISEM-YYYY-XXX of the Institut des Sciences de l’Evolution - Montpellier.
References


