

Abstract
Breast cancer is a disease of genomic alterations, of which the complete panorama of somatic mutations and how these relate to molecular subtypes and therapy response is incompletely understood. Within the Sweden Cancerome Analysis Network–Breast project (SCAN-B; ClinicalTrials.gov NCT02306096), an ongoing study elucidating the tumor transcriptomic profiles for thousands of breast cancers prospectively, we developed an optimized pipeline for detection of single nucleotide variants and small insertions and deletions from RNA sequencing (RNA-seq) data, and profiled a large real-world population-based cohort of 3,217 breast tumors. We use it to describe the mutational landscape of primary breast cancer viewed through the transcriptome of a large population-based cohort of patients, and relate it to patient overall survival. We demonstrate that RNA-seq can be used to call mutations in important breast cancer genes such as PIK3CA, TP53, and ERBB2, as well as the status of key molecular pathways and tumor mutational burden, and identify potentially druggable genes in 86.8% percent of tumors. To make this rich and growing mutational portraiture of breast cancer available for the wider research community, we developed an open source web-based application, the SCAN-B MutationExplorer, accessible at http://oncogenomics.bmc.lu.se/MutationExplorer. These results add another dimension to the use of RNA-seq as a potential clinical tool, where both gene expression-based and gene mutation-based biomarkers can be interrogated simultaneously and in real-time within one week of tumor sampling.
Introduction
Mutations in the cancer genome, including single nucleotide variants (SNVs) and small insertions and deletions (indels), can shed light on cancer biology, tumor evolution and susceptibility or resistance to therapeutic agents [1, 2, 3]. Mutations can now even be used to track circulating tumor DNA in the blood of patients [4, 5]. In recent years, the characterization of the mutational landscape of breast cancer has been performed primarily on the DNA level [1, 6, 7]. Adoption of massively parallel RNA sequencing (RNA-seq) as a clinical tool has been slower, despite a number of complementary advantages over DNA-seq. In addition to gene and isoform expression profiling and detection of de novo transcripts such as fusion genes, RNA-seq can approximate classical DNA-seq capabilities in the detection of SNVs, indels, as well as structural variants [8] and coarse copy number [9]. This makes RNA-seq an excellent tool for biomarker development [10] and potential clinical deployment [11, 12].
For these reasons, among others, in 2010 the Sweden Cancerome Analysis Network–Breast (SCAN-B) initiative (ClinicalTrials.gov ID NCT02306096) selected RNA-seq as the primary tool [13, 14]. SCAN-B is a prospective real-world and population-based multicenter study with the aim of developing, validating, and clinically-implementing novel biomarkers. To this end, SCAN-B collects tumor tissue and blood samples from enrolled patients with a diagnosis of primary breast cancer (BC). To date over 14,000 patients have been enrolled, and messenger RNA (mRNA) sequencing is performed on patient tumors within one week of surgery. All patients are treated uniformly according to the Swedish national standard of care regimen.
Expression profiling is an excellent tool to develop gene signatures for established and novel biomarkers [10, 15, 16], and many such signatures can be applied to a single RNA-seq dataset. However, for the detection of SNVs and indels from RNA-seq data there are a number of challenges. Unlike DNA-seq, where whole-genome or targeted sequencing reads are distributed approximately uniformly and in proportion to DNA copy number, the abundance of reads in RNA-seq is proportional to the expression of each gene or locus. Consequently, only variants in expressed transcripts of sufficient level can be detected. In cancer, this means that variants in oncogenes can likely be detected, whereas those in tumor suppressor genes, e.g. TP53, BRCA1, or BRCA2, are more likely to be missed. For example, mutations inducing premature stop codons can lead to nonsense-mediated decay, causing loss of expression and subsequently false-negative calls. The transcriptome is also more complex and challenging than the genome. RNA structures, such as alternative splicing, add computational challenges to alignment, and RNA editing can contribute to false-positive variant calls. Finally, there is the lack of benchmark datasets for RNA-seq, as are available for DNA from the Genome in a Bottle consortium and others [17, 18].
The aim of this study was to optimize RNA-seq somatic mutation calling through comparison to matched targeted DNA-seq, discern the mutational landscape of the early breast cancer transcriptome across a large cohort of 3,217 treatment-naïve SCAN-B cases with sufficient follow-up time, and to make the resulting vast dataset available for exploration by the wider research community. To demonstrate the power of the methodology and dataset, we assessed the impact of mutations in important breast cancer driver genes and pathways, as well as tumor mutational burden (TMB) on patient overall survival (OS).
Materials and Methods
Patients
The study was approved by the Regional Ethics Review Board of Lund at Lund University (diary numbers 2007/155, 2009/658, 2009/659, 2010/383, 2012/58, 2013/459). We analyzed data from two previously described cohorts. For 273 patients, including two patients with bilateral disease (thus 275 tumors), enrolled in the All Breast Cancer in Malmö (ABiM) study from 2007-2009, matched snap-frozen primary breast tumor tissue and blood samples were collected as previously described [19]. A cohort of 3,273 SCAN-B primary breast tumors described previously [10] was reduced to 3,217 samples following additional quality controls. Tissue collection, preservation in RNAlater, sequencing, expression estimation, and molecular subtyping using the PAM50 gene list were performed as previously reported [10, 13]. Clinical records were retrieved from the Swedish National Cancer Registry (NKBC). Estrogen receptor (ER) and Progesterone receptor (PgR) status was categorized using an immunohistochemical staining cutoff of 1%. Patients in the SCAN-B cohort had median 74.5 months follow-up, and patient demographics for both cohorts are detailed in Table 1.
Library Preparation and Sequencing
For the 275 sample ABiM cohort, tumor and normal DNA was sequenced using a custom targeted capture panel of 1,697 genes and 1,047 miRNAs as described [19]. For the same tumors RNA-seq was performed as described [10] (a subset of the 405 sample cohort therein). In short, strand-specific dUTP libraries were prepared and sequenced on an Illumina HiSeq 2000 sequencer to an average of 50 million 101bp reads per sample [13, 20].
For the 3,217 sample SCAN-B cohort, RNA-seq data was generated as previously described [10]. In short, strand-specific dUTP mRNA-seq libraries were prepared [13, 20], and an average 38 million 75bp reads were sequenced on an Illumina HiSeq 2000 or NextSeq 500 instrument (Supplementary Table S1).
Sequence Data Processing
For tumor and normal DNA, reads were aligned to the hg19 reference genome using Novoalign 2.07.18 (Novocraft Technologies, Malaysia). Using a modified version of the variant workflow of the bcbio-nextgen NGS framework (https://github.com/bcbio/bcbio-nextgen, modified version https://github.com/cbrueffer/bcbio-nextgen/tree/v1.0.2-scanb-calling) utilizing Bioconda for software management [21], duplicate reads were marked using biobambam v2.0.62 [22] and variants were called from paired tumor/normal samples using VarDict-Java 1.5.0 [23] (with default options except -f 0.02 -N ${SAMPLE} -b ${BAM_FILE} -c 1 -S 2 -E 3 -g 4 -Q 10 -r 2 -q 20), which internally performs local realignment around indels. Variant coordinates were converted to the GRCh38 reference genome using CrossMap 2.5 [24].
Raw RNA-seq reads were trimmed and filtered as described previously [10], and then processed using the modified bcbio-nextgen 1.0.2 variant workflow. Reads were aligned to a version of the GRCh38.p8 reference genome that included alternative sequences and decoys, and was patched with dbSNP Build 147 common SNPs, and the GENCODE 25 transcriptome model using HISAT2 2.0.5 [25] (with default options except --rna-strandness RF --rg-id ${ID_NAME} --rg PL:illumina --rg PU:${UNIT} --rg SM:${SAMPLE}). BAM index files were generated using Sambamba 0.6.6 [26] and duplicate reads were marked using SAMBLASTER 0.1.24 [27]. Variants were called using VarDict-Java 1.5.0 with default options except -f 0.02 -N ${SAMPLE} -b ${BAM_FILE} -c 1 -S 2 -E 3 -g 4 -Q 10 -r 2 -q 20 callable_bed, where callable_bed was a sample-specific BED file containing all regions of depth ≥ 4.
All variants were annotated using a Snakemake [28] workflow around vcfanno 0.3.1 [29] and the data sources dbSNP v151 [30], Genome Aggregation Database (gnomAD) [31], Catalogue of Somatic Mutations in Cancer (COSMIC) v87 [32, 33], CIViC [34], MyCancerGenome (release March 2016, http://www.mycancergenome.org), SweGen version 20171025 [35], the Danish Genome Project population reference [36], RNA editing databases [37, 38, 39, 40], UCSC low complexity regions, IntOGen breast cancer driver gene status [41] (accessed 2018-08-02), and the drug gene interaction database (DGIdb) v3.0.2 [42]. We used SnpEff v4.3.1t (with default parameters except hg38 -t -canon) [43] to predict functional variant impact on canonical transcripts as defined by SnpEff.
To filter out recurrent artifacts introduced during library preparation or sequencing, we constructed a panel of “normal” tissues consisting of all variants enumerated from RNA-seq analysis of adjacent non-tumoral breast tissues sampled from ten SCAN-B patients.
Gene expression data in fragments per kilobase of transcript per million mapped reads (FPKM) for the ABiM cohort was generated as previously reported [10] and is available from the NCBI Gene Expression Omnibus (accession number GSE96058).
Variant Filtering
The strategy we applied for developing DNA-seq-informed filters is outlined in Figure 1. Due to the lenient settings used for sensitive initial variant calling, we developed and applied rigid filters to reduce false positive calls resulting from either sequencing or PCR artifacts, RNA editing, or germline variants. To this end, variants called from 275 matched tumor/normal targeted capture DNA datasets were filtered, among other parameters, for low complexity regions, SNP status (dbSNP “common”, SweGen and COSMIC SNPs, high gnomAD allele frequency), allele frequency ≥ 0.05, depth ≥ 8, homopolymer environments, and RNA editing sites. Using the resulting DNA variants as reference we developed filters for the 275 sample RNA-seq variants by permuting values of the sequencing, variant calling, and annotation variables, and for each permutation calculating the concordance to the DNA mutations. Following these “negative” filters we applied a range of “positive” filters to rescue filtered variants, e.g. to retain a variant if it is present in the curated MyCancerGenome database of clinically important mutations. Finally, we selected the combination of “negative” and “positive” filter settings with the best balance of sensitivity and specificity. Using SnpSift [44] we applied the filters to RNA-seq mutation calls from the 3,217 patient cohort. A complete list of final filter variables and values for both the tumor/normal DNA variant calls, as well as the RNA-seq variant calls can be found in Supplementary Table S2.
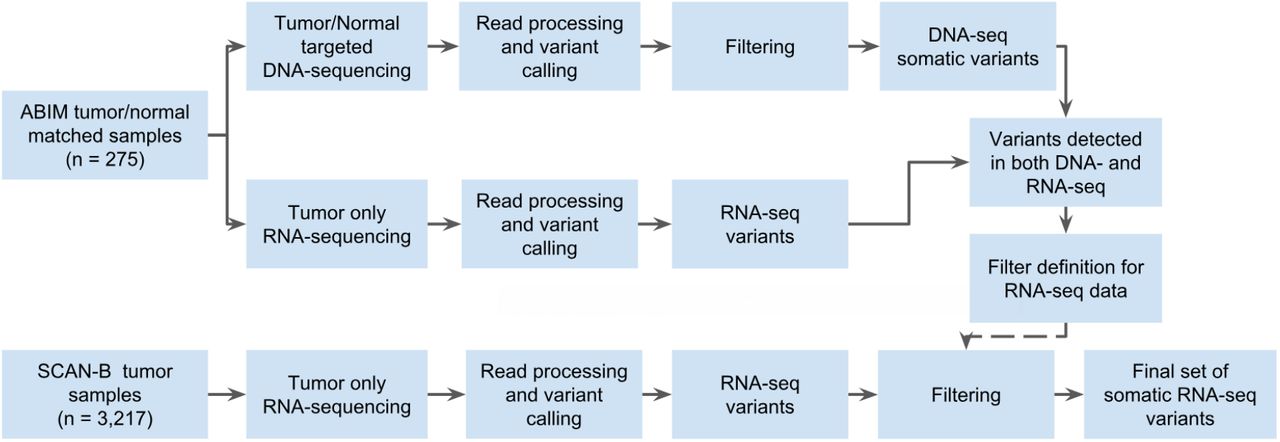
Study design flow diagram for DNA-seq-informed optimization of RNA-seq variant calling.
Data Analysis
All analyses were performed using R 3.5.1. Waterfall and lollipop plots were made using the GenVisR 1.14.2 [45] and RTrackLayer 1.42.1 packages. Substitution signatures were analyzed using the MutationalPatterns 1.8.0 package [46]. Survival analysis was conducted using OS as endpoint. Overall survival was analyzed using the Kaplan-Meier (KM) method and two-sided log-rank tests implemented in the survival 2.44-1.1 package. Associations were tested using Fisher’s exact test. P-values < 0.05 were considered significant. The web application SCAN-B MutationExplorer was written in R using the Shiny, GenVisR and SurvMiner packages.
Results
Variant Filter Performance
Mutation calling in the 275 sample cohort resulted in 3,478 somatic post-filter mutations from the matched tumor/normal targeted capture DNA, and 1,459 variants from tumor RNA-seq in the DNA capture regions (Table 2 and Supplementary Figure S1). Comparing these DNA and RNA variants resulted in 1,132 mutations that were present both in DNA and RNA in the capture regions and whose frequencies were generally in line with previous studies such as The Cancer Genome Atlas (TCGA) [1] (Supplementary Figure S2). Of the 1,459 RNA-seq variants, 884 (60.6%) were identified as somatic in DNA, 248 (17.0%) as germline in DNA, and 327 (22.4%) as unique to RNA. These RNA-unique variants are a mix of somatic mutations missed in DNA-seq, e.g. due to regional higher sequencing coverage in RNA-seq or tumor heterogeneity, unfiltered RNA-editing sites, or artifacts caused by PCR, sequencing, or alignment and variant calling.
Landscape of Somatic Mutations in the Breast Cancer Transcriptome
We applied the filters derived from the 275 sample set to the entire RNA-seq SCAN-B 3,217 sample set, resulting in 144,593 total variants comprised of 141,095 SNVs, 1,112 insertions, and 2,386 deletions (Table 2). The number of per-sample mutations in the SCAN-B set was lower compared to the ABiM set, likely due to the ABiM set being sequenced to a higher depth (Supplementary Table S1). The SNVs comprised 50,270 missense, 2,311 nonsense, 1,042 splicing, 68,819 affecting 3’/5’ untranslated regions (UTRs), 17,057 synonymous mutations, as well as 1,596 mutations predicted otherwise. The majority of indels were predicted to cause frame-shifts, or affect 3’/5’ UTRs (Supplementary Table S3). After removing synonymous mutations the number of mutations was reduced to 127,536 variants in the SCAN-B set, i.e. an average of 40 mutations per tumor.
We analyzed the contribution of the six nucleotide substitution types (C>A, C>G, C>T, T>A, T>C, and T>G) to SNVs in the ABiM and SCAN-B sets (Figure 3B). Compared to DNA, RNA-seq based variant calls showed a relative under-representation of C>T substitutions, and an over-representation of T>C substitutions.

A) Number of non-synonymous mutations per sample. Bars are colors by PAM50 subtypes Luminal A (dark blue), Luminal B (light blue), HER2-enriched (pink), basal-like (red), Normal-like (green) and Unclassified (gray). B) Contribution of base change types to the overall SNV composition in the ABiM cohort for captured DNA regions and mRNA in the captured DNA regions, as well as SCAN-B whole mRNA. C-F) Lollipop plots showing the abundance, location, and type of SNVs in the genes C) TP53, D) PIK3CA, E) PTEN, and F) ERBB2. Protein change labels are shown for the most mutated amino acid positions, with residues ordered left to right by mutation frequency.
In accordance with published studies of primary BC, the most frequently mutated genes were the known BC drivers PIK3CA (34% of samples), TP53 (23%), MAP3K1 (7%), CDH1 (7%), GATA3 (7%), and AKT1 (5%) (Figure 2). As reported before [6], disruptive alterations in CDH1 were a hallmark of lobular carcinomas (135/386 [35.0%] of samples), while alterations in TP53, MAP3K1, and GATA3 were more common in the ductal type. 86.8% of SCAN-B samples had at least one mutation in a gene targeted by an approved or experimental drug, based on the Database of Genedrug Interactions (DGI).

Waterfall plot of the 20 most frequent post-filter RNA variants across 3,217 SCAN-B samples. Genes are ranked by variant frequency in RNA-seq. Samples are sorted by histological subtype and alteration occurrence.
Somatic Mutations in Important BC Genes
We looked closer into known driver BC genes and found our RNA-seq based mutation calls to recapitulate known mutation rates and hotspots, summarized in Table 3, Supplementary Table S3, and Figure 3C-F. Associations of mutated genes and clinical and molecular biomarkers are summarized in Table 4, and we highlight several examples below.
PIK3CA was the most frequently mutated gene, with 1,163 non-synonymous mutations in 1,095 patient samples (34% of patients). As expected and in line with previous studies [1, 47] the majority of alterations were the known hotspot mutations H1047R/L, E545K, and E542K (Table 3, Figure 3D). All of these hotspot mutations and the vast majority of other PIK3CA alterations were missense mutations. Mutations were associated with lobular, ER+, PgR+, HER2-, and Luminal A (LumA) BC (Table 4).
TP53 is frequently disrupted by somatic SNVs, however a few hotspot mutations exist [48]. The mutation frequency in BC estimated to be 35.4%-37% [1, 47], which we could confirm in our DNA-seq ABiM filter definition cohort (37%). Likely due to nonsense-mediated decay, loss of heterozygosity, and/or decreased mRNA transcription, in the 3,217 cases the frequency of TP53 mutations was lower at 23% (782 mutations in 733 samples). Nevertheless, as anticipated TP53 mutations were associated with ductal, ER-, PgR-, HER2+, triple-negative BC (TNBC), and the basal-like and HER2-enriched PAM50 subtypes (Table 4). The most often mutated amino acids we observed were R273, R248, R175 (50, 49, and 24 mutations respectively, total 123/782 [15.7%]), followed by positions Y220 (21/782 [2.7%]), R280 (19/782 [2.4%]) and R342 (17/782 [2.2%]), in line with the IARC TP53 database (release R19) [49] (Table 3, Figure 3C).
PTEN is a crucial tumor suppressor gene and regulator of PI3K activity, and PTEN protein expression is associated with poor outcome [50]. In our dataset we found 124 non-synonymous mutations in 116/3,217 (3.6%) samples, and mutations were significantly associated with HER2-disease (Table 4).
We identified 117 non-synonymous ERBB2 mutations in 103 patients (3.2%), higher than the previously reported incidence rates of 1.6%-2.4% [2, 51, 52], but lower than in metastatic BC where rates as high as ~7% have been reported [53]. Two hotspots, L755S (28/117) and V777L (24/117) that cause constituent HER2 signaling (Figure 3F) [2, 51], accounted for 44.4% of total ERBB2 mutations. Co-occurrence of ERBB2 mutation and amplification has been reported before, however mainly in the metastatic setting and after treatment [53]. In our untreated, early BC cohort we observed ERBB2 mutation and amplification in 12 tumors, and generally mutation and amplification were not mutually exclusive (P=0.88), and ERBB2 mutations were predominantly in tumors classified as PAM50 HER2-enriched subtype (P=0.001). Moreover, ERBB2 mutation was significantly associated with PgR-, and lobular BC (Table 4)
Loss of E-cadherin (CDH1) protein expression is a hallmark of the lobular BC phenotype [6]. With 12% of our cohort being of lobular type, we observed 137 of total 233 CDH1 mutations in lobular BCs (58.8%, P<0.001). The mutations were mostly comprised of nonsense mutations (37.2%) and frameshift indels (35.4%), suggesting they lead to CDH1 expression loss and drive the lobular phenotype. We observed one nonsense mutation hotspot (Q23*, n=18), and this residue was also hit by a rare missense mutation (Q23K, n=1). In addition to lobular BC, CDH1 mutations were associated with ER+/HER2-status, and the LumA subtype (Table 4).
Other notable mutated genes in our set were MAP3K1, AKT1, ESR1, GATA3, FOXA1, SF3B1, and CBFB. MAP3K1 is a regulator of signaling pathways, and regularly implicated in various cancer types. We observed a high rate of frame-shift indels, and missense mutations mostly clustered in the kinase domain. Co-mutation of MAP3K1 and PIK3CA occurred in 108 tumors (3.4%). AKT1 is a common oncogene with 156 (4.8%) mutated samples, and featured the fourth most mutated hotspot (E17K, 121 mutations) in the SCAN-B cohort. These mutations are predictive of sensitivity to AKT inhibitors [54]. ESR1 encodes the ERα receptor, perhaps the most important clinical BC biomarker, and 77 tumors harbored 81 ESR1 variants. Relatedly, GATA3 and FOXA1 are frequently mutated transcription factors involved in ER signalling. We identified 246 GATA3 mutations, including known recurrent frame-shift mutations (P409fs, n=30 and D336fs, n=10) and the M294K/R missense mutation (n=15), as well as 10 splice site variants. In FOXA1 we detected 146 total mutations, including known recurrent S250F (n=23) and F266L/C (n=12) missense mutations. Most mutations occurred in the forkhead DNA binding domain. In line with their involvement in ER signalling, mutations in GATA3, FOXA1, MAP3K1, and ESR1 were associated with ER+ and PgR+ disease. Further, GATA3 and MAP3K1 were associated with ER2+/HER2- and ductal BC, while ESR1 and FOXA1 were more common in lobular BC. With the exception of GATA3 (Luminal B [LumB]), all of these genes were associated with the LumA subtype (Table 4). In SF3B1 we identified 81 mutations in 79 tumors, 60 of which were K700E hotspot mutations. Alterations in this gene are associated with ER+ disease [55] and affect alternative splicing patterns [56]. The cohort frequency of 1.9% K700E mutations matches up with previously reported 1.8% in an unselected breast cancer cohort [55]. We could confirm the reported prevalence of SF3B1 mutations in ER+ tumors (76/79 mutations in ER+ tumors, P=0.021), as well as the association with non-ductal, and non-lobular subtypes (P=0.003). CBFB has been shown to be commonly mutated in ER+/HER2-disease, however the significance of these mutations is unknown [57]. We could confirm this finding showing 107 mutations (3.3% cohort frequency), 95 of which were in ER+/HER2-samples (4% of ER+/HER2-samples, P<0.01). We also found them to be associated with the LumA subtype (Table 4).
Mutations in Molecular Pathways
We were interested whether the mutational data, when considered from the perspective of mutated pathways, could reveal new biological correlates. To test this, we mapped mutation status to important BC pathways as defined in the Reactome database [58, 59]. We called a pathway mutated when at least one of the member genes had a non-synonymous mutation, and clustered samples by pathway mutation status using Ward linkage. Notable clusters that emerged were co-mutated hedgehog signaling, p53-independent DNA repair, and hypoxia response pathways, as well as a cluster of NOTCH1/2/3 signaling mutated tumors, both in mostly basal-like and HER2-enriched tumors, and PI3K/AKT, MET, RET, EGFR, ERBB2, and ERBB4 signaling pathways co-mutated in a subset of tumors of Luminal A and B subtype (Figure 4, see Supplementary Table S4 for Reactome pathway IDs).

Binary heatmap of mutation status of important BC pathways in 3,217 samples. Samples with wild-type (wt) pathway status (all member genes wt) are colored blue, those with mutated pathways (at least one member gene mutated) are colored red. Reactome IDs for the pathways can be found in Supplementary Table S4.
Tumor Mutational Burden
Tumor mutational burden is increasingly of interest due to its association to neoantigen burden and response to immunotherapies. We used the median number of non-synonymous mutations per transcriptome megabase (rnaMB), 0.082 mutations/rnaMB, to stratify all SCAN-B samples into TMB-high and TMB-low groups. Samples with HER2-enriched and basal-like PAM50 subtypes were enriched in the top 10% of samples with the highest TMB compared to the lowest 90% (P<0.001, Figure 3A), supporting previous results and indicating that immunotherapy may have higher activity in these two PAM50 subtypes [1].
Mutational Landscape and Patient Outcomes
Next, we were interested in the association between mutations in important BC genes and patient outcome under various treatments. Below we show the results for TP53, PIK3CA, ERBB2, and PTEN with OS of SCAN-B patients in clinical biomarker and treatment groups (Figure 5, Supplementary Figure S4), as well as selected pathways (Figure 6, Supplementary Figure S5). The web tool SCAN-B MutationExplorer may be used to query any gene(s) of interest.

Overall survival of patients with tumors containing mutations in the genes A) TP53, B) PIK3CA, C) ERBB2, D) PTEN, and E) mutated PTEN or PTEN expression in the lower quartile across the cohort, stratified by groups receiving no systemic treatment, endocrine therapy only (Endo only), endocrine and chemo therapy (Endo+Chemo), as well as HER2 treatment with any other treatment or none (HER2+any).

Overall survival of patients with tumors containing mutations in pathways A) WNT signaling, B) Hedgehog signaling, C) NOTCH2 signaling, D) p53 independent DNA damage repair, E) TGFβ signaling, stratified by groups receiving no systemic treatment, endocrine therapy only (Endo only), endocrine and chemo therapy (Endo+Chemo), as well as HER2 treatment with any other treatment or none (HER2+any). See Supplementary Table S4 for Reactome pathway IDs.
In line with expectations, TP53 mutation predicted poor survival in untreated patients (P<0.001), patients treated with endocrine and chemo therapy (P=0.02), as well as the HR+/HER2-biomarker subgroup (P=0.019).
In early-stage breast cancer PIK3CA mutations have been shown to be associated with benefits in disease-free survival [60]. In our hands these mutations signaled worse OS in TNBC patients (P=0.049), and those who did not receive systemic treatment (P=0.018).
ERBB2 mutations were indicators of poor prognosis in endocrine therapy only (P=0.023) and endocrine and chemo therapy treated (P=0.004) patients, as well as in the ER+/HER2-subgroup (P=0.013).
PTEN mutations alone were associated with poor survival in the patient group not receiving systemic treatment (P=0.036), but not in any of the other tested clinical biomarker or treatment groups (Figure 5). While loss of PTEN protein expression or non-functional PTEN protein can be caused by SNVs and indels, it can also be caused by other mechanisms such as large structural variants [61] and promoter methylation [62] that have not been investigated in this study. To account for this we defined a new subgroup PTEN-MutExp, where a status of “low” identifies cases with either PTEN mutation or gene expression in the lower quartile within the cohort, and “normal” otherwise. The PTEN-MutExp low group, incorporating gene expression, showed improved stratification in the no systemic treatment group (P=0.005), and significantly lower OS in patients receiving only endocrine treatment (P<0.001), as well as ER+/HER2-patients (P=0.001). Most of the prognostic value is provided by the gene expression, however mutation data improved stratification (Supplementary Figure S3).
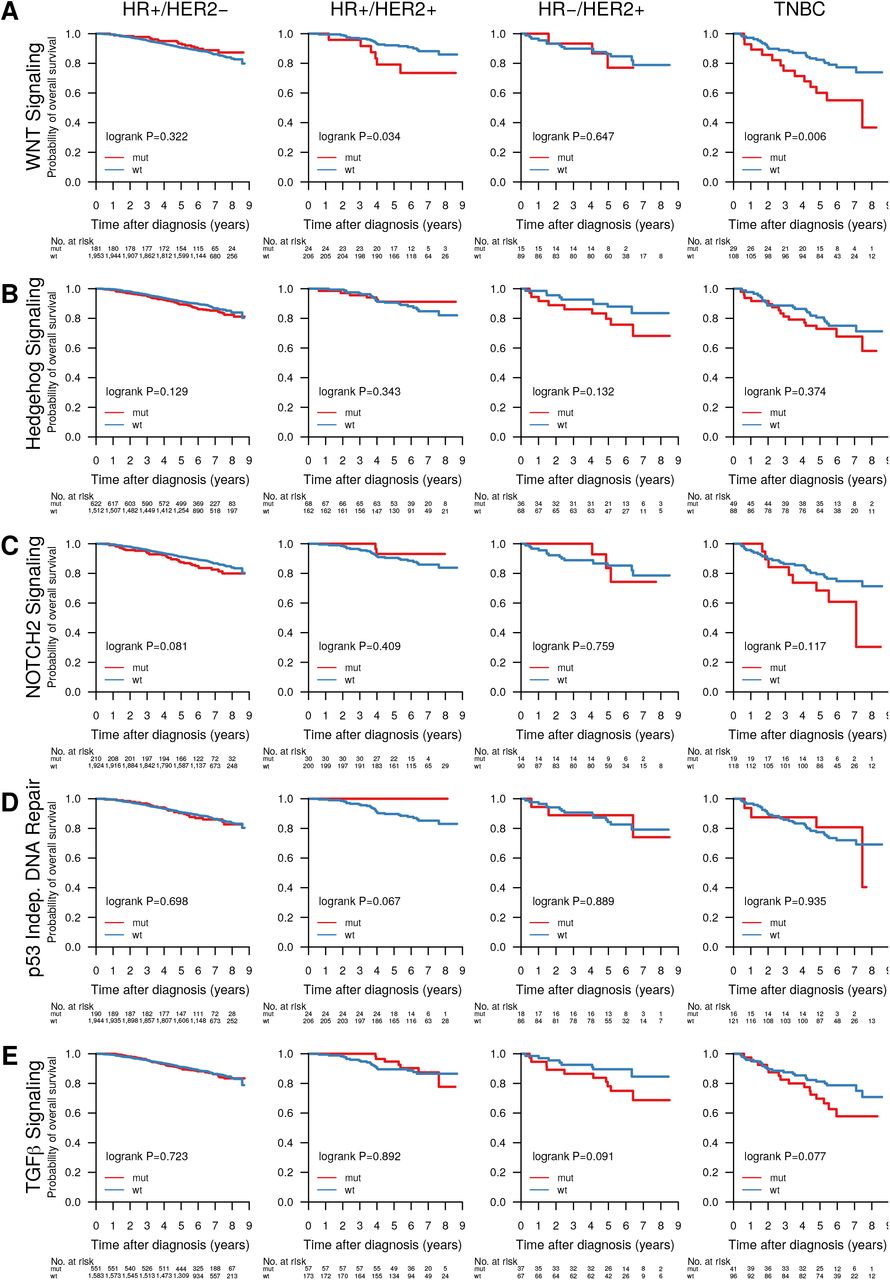
Abstracting from mutations in individual genes we investigated the effect of mutated pathways on OS in patient subgroups stratified by treatment (Figure 6) and clinical subgroup (Supplementary Figure S5). Mutated WNT (Figure 6A, P=0.01), Hedgehog (Figure 6B, P=0.026) and NOTCH2 (Figure 6C, P=0.005) signaling, as well as the p53-independent DNA damage repair (Figure 6D, P=0.002) pathway were associated with worse survival in patients not receiving systemic treatment. Additionally, NOTCH2 signaling (Figure 6C, P=0.003) was associated with worse OS in patients receiving only endocrine treatment, and TGFβ signaling (Figure 6E, P=0.021) with worse OS in patients treated with endocrine and chemo therapy. Further, WNT signaling was associated with worse OS in HR+/HER2+ (P=0.034) and TNBC patients (P=0.006) (Supplementary Figure S5).
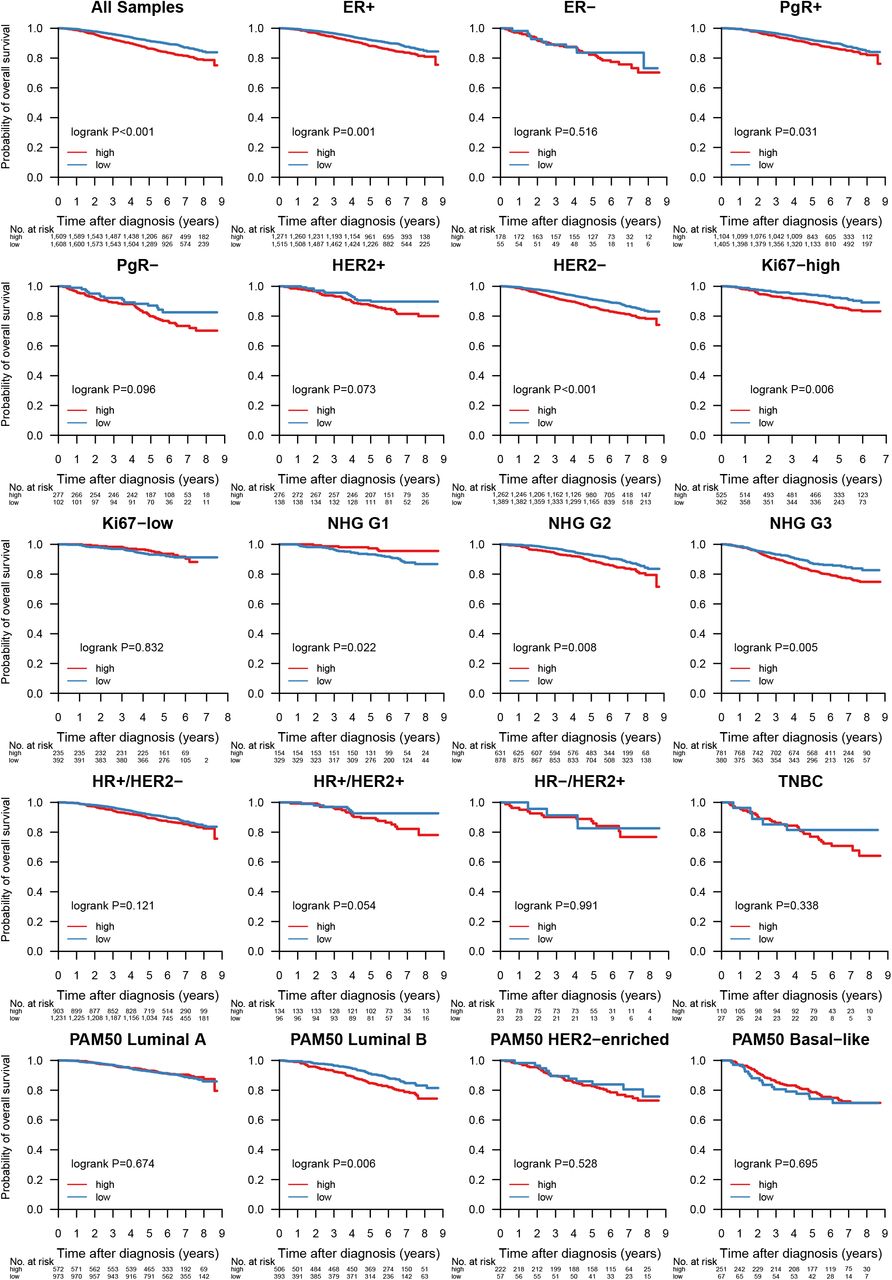
Given its importance as an emerging biomarker for response to immune checkpoint therapy [63], we investigated whether TMB could also provide response information with respect to conventional treatment regimens (Figure 7). When stratified into TMB-high and TMB-low by the SCAN-B cohort median TMB per MB of expressed transcriptome, low TMB was favourable to OS independent of treatment across the cohort (P<0.001), as well as in patients not systemically treated (P<0.001), treated with endocrine therapy only (P<0.001), endocrine ± chemo or HER2 therapy (P=0.003), and chemotherapy ± endocrine or HER2 therapy (P=0.011). High TMB is typically associated with improved survival in TNBC, possibly due to increased neoantigen load enabling a stronger immune response. However, we observed no such effect in TNBC patients within the SCAN-B cohort (P=0.338, Supplementary Figure S6). Mutational load was also a significant survival stratifier across the NHG grading scheme (G1, P=0.022, G2, P=0.008, G3, P=0.005), and within the ER+ (P=0.001), PgR+ (P=0.031), HER2-(P<0.001), and Ki67-high (P=0.006) patient subgroups (Supplementary Figure S6). Interestingly, LumB patients with high TMB showed worse survival (P=0.006), whereas TMB was not a significant stratifier for any other molecular subtype (Supplementary Figure S6).

Overall survival stratified by tumor mutational burden (TMB) across different treatment groups. Samples were classified as TMB-high if the amount of non-synonymous mutations per expressed MB (rnaMB) was ≥ the median number of non-synonymous mutations per rnaMB across the whole SCAN-B cohort (0.082 mutations) and TMB-low otherwise.
SCAN-B MutationExplorer
To enable public exploration and re-use of our rich mutational dataset we developed the web-based application SCAN-B MutationExplorer (available at http://oncogenomics.bmc.lu.se/MutationExplorer) (Figure 8). With this interactive application a user can filter the 3,217 SCAN-B samples based on biomarker combinations (ER, PgR, HER2, Ki67, NHG, histological type, and PAM50 subtype), and mutations based on mutation type (e.g. nonsense or missense) and COSMIC occurrence. From the filtered data the user can create mutational landscape waterfall plots, conduct survival analysis using KM analysis and log-rank tests based on mutations in single genes, pathways as defined in the Reactome database or custom, as well as TMB, either using the absolute number of mutations, or mutations per expressed MB of genome, using a user-defined threshold. Mutations can also be plotted from a protein point of view using user-defined occurrence cutoffs for showing and annotating mutations. The overall set of 3,217 SCAN-B patients can be filtered based on combinations of clinicopathological and molecular markers (histological type, ER, PgR, HER2, Ki67, NHG, and PAM50 subtype) and treatments (endocrine, chemotherapy, and HER2 treatment). Plots in PDF format as well as the mutation set underlying the currently active plot in tab-separated values (TSV) format can be downloaded for further analysis. The application is based on R Shiny and the source code is available under the BSD 2-clause open source license at http://github.com/cbrueffer/MutationExplorer.

The SCAN-B MutationExplorer web-based application for interactive exploration of mutations, and their association with clinicopathological subgroups and overall survival.
Discussion
Tumor somatic mutation status is a crucial piece of information for the future of precision medicine to guide treatment selection, and give insight into tumor evolution. For example the PI3K inhibitor alpelisib (Novartis) was recently FDA-approved for use in PIK3CA-mutated metastatic BC [64], and the anti-PD1 immunotherapy pembrolizumab was the first drug approved across multiple tumor types based on biomarker status alone [65]. Analysis of DNA is the gold standard for detecting SNVs, indels and larger structural variants. However, many interesting tumor properties are only accessible on the transcriptome level and cannot be interrogated using DNA; most prominently gene expression at the isoform and gene level, as well as de novo transcripts originating from gene fusions. The SCAN-B initiative [13] decided early on to perform RNA-seq on the tumors of all enrolled patients. Based on this we have developed, refined, and benchmarked gene expression signatures [10, 66, 67, 68, 69], and detected recurring fusions affecting miRNAs [70]. Detection of somatic mutations from RNA-seq data adds another layer to information that can now be obtained from a single sequencing analysis within one week of surgery [13]. Mutation calling from RNA-seq is not as well refined as that from DNA, although calling from DNA cannot be considered a solved problem given that false positive calls are still prevalent and significant discordance between mutation detection algorithms exists [71, 72, 73]. Compared to DNA, RNA-seq mutation calling is complicated by several factors: additional steps in the library preparation protocols [74, 75], the inherent complexity of the transcriptome resulting in noise, and more complex read alignment accounting for splice sites. This results in potential false positive variant calls due to cDNA synthesis, RNA editing (e.g., A>I editing resulting in A>G variant calls) [76] and other RNA modifications, as well as read mis-alignment. An inherent limitation is that only mutations in sufficiently expressed regions can be detected.
To date several approaches for RNA-seq mutation calling, mostly in combination with matched DNA, have been developed [77, 78, 79, 80, 81, 82], however calling from RNA-seq alone, particularly from tumor-only samples, is still a challenge. With the advance of targeted and whole exome sequencing into the clinics, and efforts such as TCGA, MSK-Impact, and others, variant calling from DNA-seq has improved in recent years. Part of this improvement is the availability of validation resources such as the Genome in a Bottle datasets [17]. With clinical interest in RNA-seq only recently picking up, e.g. as shown by two recent review articles [11, 12], comparably well-characterized RNA-seq datasets for validation do not yet exist to our knowledge.
The strategy for mutation calling herein was to perform initial variant calling with low requirements on coverage and base quality in order to increase sensitivity while allowing false-positives. To increase specificity we then applied stringent post-hoc filtering that can be easily amended as further annotation data becomes available, or as existing sources receive updates. The advantage of this two-step strategy is the possibility to accommodate different research and clinical questions in the future that may have different filtering needs.
Two major contributors of false-positive mutation calls are germline SNPs/indels and RNA editing. Common approaches for dealing with germline events are calling mutations from matched tumor/normal samples, or filtering SNPs present in databases such as dbSNP. The latter is problematic, since some dbSNP entries with a low variant allele frequency (VAF) may be legitimate somatic mutations that should not be filtered away. On the other hand, filtering on the dbSNP “common” flag (at least 1% VAF in any of the 1000 genomes populations) can lead to many low-VAF germline SNPs remaining. We tried to address this issue by combining the dbSNP and COSMIC databases, and only filtering variants present in dbSNP if they were not present in COSMIC. We filtered out known RNA editing sites using publicly available databases, however there is still an overabundance of T>C substitutions in our RNA-based calls compared to DNA-based calls, suggesting many unknown editing sites and insufficient filtering (Figure 3B). Approaches have been developed to identify RNA editing sites using DNA/RNA-trained machine learning models [39] or RNA-seq data alone [83], which may provide ways to improve filtering in the future by creating a SCAN-B RNA editing database.
The two most frequently mutated genes in our study were PIK3CA (34% of samples) and TP53 (23%) in line with previous studies such as TCGA [1], followed by other known drivers MAP3K1 (7%), CDH1 (7%), GATA3 (7%), and AKT1 (5%) (Figure 2). Other frequently mutated genes in our set such as RNF213 have been implicated in breast cancer, and for PLEC mutations have been reported [78, 84]. While mutation frequencies in oncogenes such as PIK3CA are generally in line with previous studies, frequencies in tumor suppressor genes were generally lower in RNA-seq than would be expected from our study population. For example our TP53 RNA-seq somatic mutation frequency of 23% (reference: 36%, cBioPortal.org) suggests we may be missing a significant fraction of TP53 mutations present in DNA. Similar trends can be seen in PTEN (observed: 3.6%, reference: 4.6%), BRCA1 (observed: 0.2%, reference: 1.6%), BRCA2 (observed: 0.03%, reference: 2.2%). This is not surprising since only mutations in sufficiently highly expressed genomic regions can be detected by RNA-seq, and loss of expression of tumor suppressor genes is a hallmark of oncogenesis. Furthermore, truncated mRNAs caused by nonsense mutations are typically removed by nonsense-mediated decay before they can be captured for sequencing. Thus, our findings do not reflect the true mutational spectrum of tumor suppressor genes. Despite these limitations, we could identify a putative mutation in at least one gene targeted by an existing drug in the majority of patient tumors (86.8%), demonstrating that it should be feasible to match most patients to targeted treatments using RNA-seq analyses.
PI3K/AKT/mTOR is a key oncogenic pathway in BC that is frequently activated by alterations in genes such as PIK3CA, MAP3K1, AKT1, or PTEN, leading to increased growth signaling. Missense mutations in the PIK3CA hotspot residues 1047, 545, and 542 (Figure 3D) have been shown to lead to constituent pathway activation [85]. In a pooled analysis of PIK3CA mutation impact on different survival endpoints Zardavas et al [60] showed that PIK3CA mutant tumors were associated with slightly better 5-year OS than PIK3CA-wt tumors in univariable analysis (hazard ratio, 0.89), but not when correcting for clinicopathological and treatment variables. This survival benefit is not reflected in our data, where the only genotype-dependent survival difference for PIK3CA is within the TNBC patient group (P=0.049, Figure S4). This difference could be an effect of the treatment regimes, study population, and/or population-based nature of our cohort. Various agents targeting PI3K are in clinical trials, for which PIK3CA mutations are predictive biomarkers. Importantly the drug alpelisib (Novartis) [86] has been shown to confer beneficial progression-free survival in HR+/HER2-PIK3CA mutant tumors in combination with fulvestrant [64]. This survival benefit may be dependent on co-mutation status of PIK3CA and MAP3K1; the latter is a tumor suppressor gene in the PI3K/AKT/mTOR pathway whose loss of expression activates the pathway and desensitizes the tumor to PI3K inhibition [87]. In fact we frequently observed inactivating (frameshift/nonsense) MAP3K1 alterations in PIK3CA mutant tumors (77/1,095, 7%). AKT1 is a known oncogene in this pathway, and had one of the most mutated hotspots (E17K) in the cohort. This mutation leads to constitutive AKT1 signaling and PI3K pathway activation, and sensitizes tumors to the ATP-competitive AKT1 inhibitor AZD5363 (AstraZeneca), but not allosteric inhibitors [54, 88]. Yi et al suggest that other, rarer, mutations in AKT1 are non-sensitizing passenger mutations [88].
Another potential biomarker for PI3K inhibitor efficacy is PTEN, the key negative regulator of the PI3K/AKT/mTOR pathway. PTEN protein expression is frequently lost in BC, e.g. caused by gross rearrangements of the gene [61]. The hotspot mutations we identified are of unknown significance (Figure 3E). PTEN mutation status alone only significantly stratified patients receiving no systemic treatment into OS low/high risk groups, however when combined with low gene expression in the PTEN-MutExp low group mutational information contributed to better stratification (Supplementary Figure S3) than achieved by PTEN expression alone, particularly in patients receiving endocrine treatment only (Figure 5), and the HR+/HER2-subgroup (Supplementary Figure S4). This suggests that SNVs and indels are a minor mechanism of PTEN loss in early BC compared to larger deletions, structural rearrangements, and other means of PTEN expression loss. Taken together, we detected mutations in multiple PI3K/AKT/mTOR signaling nodes (1,872/3,217 [58.2%] mutated samples) that lead to increased pathway activation and have emerging clinical utility in luminal BC, e.g. through combination with EGFR inhibition as demonstrated in basal-like BC [89].
Loss of p53 activity, either through loss of function (LoF) mutations, dominant-negative mutations, or low expression, is a major contributor to tumorigenesis. While we generally underdetect TP53 mutations, the identified hotspot residues remain the same as reported in the IARC TP53 database. The vast majority of detected mutations are located in the DNA-binding domain, and 77.6% of overall mutations are missense mutations, likely leading to protein LoF. TP53 mutations correlated with triple-negative biomarker status (P<0.001) and basal-like PAM50 subtype (P<0.001), as reported before [1]. Clinically these mutations could already be actionable, as TP53 mutations are a sign of DNA damage-repair deficiency and may be prognostic for sensitivity to PARP inhibition [90, 91]. Recent simulations suggest that a subset of mutations could lead to the formation of a druggable binding pocket, potentially opening therapeutic options to restore p53 function [92]. TP53 mutant patients had significantly worse OS in the patient subgroups treated only with endocrine therapy, or no systemic treatment at all (Figure 5). This finding was corroborated by worse survival of TP53 mutant patients in the HR+/HER2-clinical subgroup (Supplementary Figure S4), suggesting that TP53 mutations identify a subgroup of patients that are spared chemotherapy or systemic therapy overall by appearing low-risk, but are in fact high-risk patients that should be treated accordingly.
ER receptor protein expression is arguably the most important biomarker in BC, with 2,786 (86.6%) tumors of our cohort being ER+. ER positivity is a strong prognostic and treatment predictive biomarker for endocrine treatment efficacy. Several tumors in our cohort harbored ESR1 mutations, including known endocrine treatment resistance mutations, that are discussed elsewhere in detail (Dahlgren et al, submitted). Transcription factors encoded by GATA3 and FOXA1 are directly involved in modulating ESR1 signaling, and their expression is independently associated with beneficial survival in ER+ tumors [93]. While the role of mutations in these genes has not been thoroughly characterized, Takaku et al suggest that GATA3 can function as either oncogene or tumor suppressor depending on the mutations the gene accumulated, and which part of the protein product is impacted [94]. According to their classification the most frequent mutation in our cohort, the P409fs frameshift mutation, results in an elongated protein product compared to GATA3-wt that has favourable survival compared to mutations of the second Zinc finger domain.
ERBB2 (HER2) mutations have emerged as a novel biomarker and occur by the majority in patients without HER2 amplification [2], but also in HER2-amplified cases [53]. Evidence is mounting that recurrent ERBB2 mutations lead to increased activation of the HER2 receptor in tumors classified as HER2-normal [2, 51, 95]. Activating ERBB2 mutations have been shown to confer therapy resistance against standard of care drugs such as trastuzumab and lapatinib [53], but can be overcome using pan-HER tyrosine kinase inhibitors such as neratinib [2, 96, 97, 53]. ERBB2 mutations have also been shown to confer resistance to endocrine therapy in the metastatic setting [98], where HER2-directed drugs are effective [99]. In our study patients with ERBB2 mutant tumors had markedly worse prognosis than ERBB2-wt patients, particularly in ER+/HER2-BC (Figure 5C, Supplementary Figure S4C). Detecting these patients early could open up additional treatment options to patients, especially when they show signs of resistance to endocrine therapy. Our results also demonstrate that mutation and amplification can already co-occur in early, treatment-naïve BC. In the metastatic setting Neratinib monotherapy has been found effective in these patients, suggesting it may be a useful part of the treatment arsenal for early BC as well.
The role of alternative splicing in tumorigenesis has recently garnered increased attention, and the extend of isoform switching in several cancer types, including BC, has been characterized [100]. SF3B1 encodes a subunit of the spliceosome and mutations in this gene have been identified as potentially interesting treatment targets after having been observed in myelodysplastic syndromes and chronic lymphocytic leukemia. The K700E hotspot mutation deregulates splicing and results in differential splicing patterns in BC [55]. The clinical effect of these mutations is unclear, however we did not detect significant survival stratification in important biomarker or treatment groups.
Mutations in CBFB were recently identified as recurrent in ER+/HER2-BC [57]. CBFB is a transcriptional co-activator of Runx2, an expression regulator of several genes involved in metastatic processes such as cell migration. Increased CBFB expression has been identified as essential for cell invasion in BC [101]. While we could confirm occurrence and mutation frequency in ER+ BC, we did not observe the splice site mutation described by Griffith et al [57], perhaps due to degradation of the spliced mRNA by nonsense-mediated decay.
Pathways
Individual mutations, particularly in infrequently mutated genes, affect a smaller number of molecular pathways to achieve the classical hallmarks of cancer such as sustained proliferative signaling. The two most eminent co-mutation clusters we observed in a subset of tumors enriched for basal-like and HER2-enriched molecular subtypes were one made up of hedgehog signaling, p53-independent DNA repair, and hypoxia response, the other of co-mutated NOTCH1/2/3 signaling pathways (Figure 4). Both clusters are linked in their relation to cancer stem cell development [102, 103], which, in addition to the NOTCH and Hedgehog pathways themselves, has emerged as a novel treatment target, particularly in TNBC. A dominant cluster of luminal tumors was co-mutated in the PI3K/AKT, MET, RET, EGFR, ERBB2, and ERBB4 signaling pathways. Activation of these pathways is involved in the development of ER+ BC through proliferation-inducing signaling, or endocrine therapy resistance, e.g. via activating ERBB2 mutations [98].
Mutation status of several individual pathways was associated with reduced OS in different treatment and clinical biomarker subgroups. In patients not systemically treated or only treated with endocrine therapy WNT, NOTCH2, p53-independent DNA repair pathway mutation status, and Hedgehog signaling mutation status may identify patients diagnosed as low risk who may benefit from more adjuvant treatment (Figure 6). While these stratification profiles were visible in treatment subgroups, they mostly did not yield significant results in clinical biomarker subgroups (Supplementary Figure 6). This may indicate that current risk stratification in histopathological biomarker subgroups is inadequate and should take molecular information into account – something we and others have also shown on the level of gene expression [10].
Identifying the mutation status of pathways and pathway clusters may aid in future clinical trials and treatment, e.g. by aiding selection of treatments that exploit synthetic lethality [104].
Tumor Mutational Burden
High TMB has been identified as a predictive biomarker for response to immune checkpoint therapy in diverse solid tumors [63, 105, 106, 107, 108]. Using RNA-seq to assess mutational burden may be a useful capability for clinical trials and eventual clinical implementation in BC [109]. Questions remain however, as TMB is influenced by many biological and technical factors such as ploidy, tumor heterogeneity and clonality (ASCO SITC 2019, Abstract 27), sample tumor cell content, sequencing depth, and variant filtering. Which cutoff to use for stratifying patients into TMB groups is also still emerging [109, 110], and specifically in RNA-seq has to our knowledge not been addressed. Due to this, and to account for different expression profiles per tumor, we decided to use the median amount of non-synonymous mutations per MB of transcriptome across the cohort (0.08 mutations) to stratify patients into TMB high and low groups and use it to study OS in different conventional treatment and biomarker subgroups. In several of these groups high TMB was significantly associated with worse survival, confirming previous reports [111], however interestingly not in TNBC. These tumors typically show higher TMB than other clinical BC subtypes, likely because many of them have impaired DNA damage repair mechanisms. Shah et al [112] showed that only approximately 36% of mutations in TNBCs are expressed; we speculate that due to this we may underestimate TMB in several of our TMB-low patients. Additionally, RNA-seq underdetects truncating mutations such as frame-shift indels that are a major source of neoantigens. Immune checkpoint therapy is a particularly attractive treatment approach in patients with TNBC and basal-like tumors for which currently no targeted therapy exists. For these patients, determination of TMB using DNA-seq may be a better option than relying on RNA-seq.
SCAN-B MutationExplorer
Large scale projects such as TCGA have generated vast amounts of data, but bioinformatics skills are required to make efficient use of them. Web portals such as cBioPortal [113] have emerged to make these huge datasets explorable without specialized skills. In this spirit we developed the open source web application SCAN-B MutationExplorer to make our mutation dataset easily accessible for other researchers. We hope that SCAN-B MutationExplorer will aid knowledge generation and the development of better BC biomarkers in the future. The open source nature of the portal allows developers to adopt the code for their own purposes, and we welcome contributions of any kind.
Limitations
The mutation calling we have performed herein tries to achieve sensitive variant calling by using lenient parameters, and heavy filtering of the resulting variants based on stringent quality factors, annotations, and curated databases. This approach has several limitations. While our 275 patient cohort for filter development had matched tumor and normal DNA sequencing data, the SCAN-B cohort only consisted of tumor RNA-seq data. This made accounting for PCR and sequencing artifacts more challenging. Further while many germline events can be filtered by comparing to general databases such as dbSNP, and population-specific ones such as SweGen, these databases are incomplete and it is thus not possible to remove all germline events this way. As these databases improve, our filters can be upgraded to increase performance. Herein we also applied filters developed in a matched DNA/RNA set of targeted capture sequencing of 1,697 genes and 1,047 miRNAs (275 sample ABiM cohort) to whole mRNA-seq (3,217 sample SCAN-B cohort). This assumes the transcriptional characteristics of the captured regions are representative for the whole mRNA.
Conclusions
We presented a tumor-only RNA-seq variant calling strategy and resulting mutation dataset from a large population-based early breast cancer cohort. Although variant calling from RNA-seq data is limited to expressed regions of the genome, mutations in important BC genes such as PIK3CA, TP53, and ERBB2, as well as pathways can be reliably detected, allowing to inform clinical trials and eventual reporting to the clinic. Mutations in TP53, PIK3CA, ERBB2, and PTEN provided prognostic information in several treatment and biomarker patient subgroups, demonstrating the utility of the dataset for research. We make this dataset available for analysis and download via the open source web application SCAN-B MutationExplorer, accessible at http://oncogenomics.bmc.lu.se/MutationExplorer.
Data Availability
Clinical data for all samples, as well as mutation calls can be downloaded from the SCAN-B MutationExplorer website. For access to the full dataset, please contact the corresponding author. Gene expression data in FPKM is available from the NCBI Gene Expression Omnibus (accession number GSE96058).
Author Contributions
CB, CW, and LHS conceived the study. CB, SG, CW, JV-C, JH, AMG, YC, NL, and LHS analyzed data. JV-C, CH, JH, AE, CL, NL, MM, LR, ÅB, and LHS established the SCAN-B initiative. CB, CW, and LHS established the DNA-seq analyses. CB, SG, and LHS established the RNA-seq mutation calling pipeline and filters. JV-C, CH, JH, AE, CL, NL, MM, LR, ÅB, and LHS provided clinical information. LHS supervised the project, and CB and LHS wrote the report with assistance from all authors. All authors discussed, critically revised, and approved the final version of the report for publication.
Conflict of Interest
CB, SG, AMG, YC, and LHS are shareholders and/or employees of SAGA Diagnostics AB. LHS has received honorarium from Novartis and Boehringer-Ingelheim. All remaining authors have declared no conflicts of interest.

Waterfall plot of the 20 most mutated genes in the targeted DNA-seq ABiM cohort data.

Waterfall plot of the 20 most mutated genes in RNA-seq ABiM cohort data.
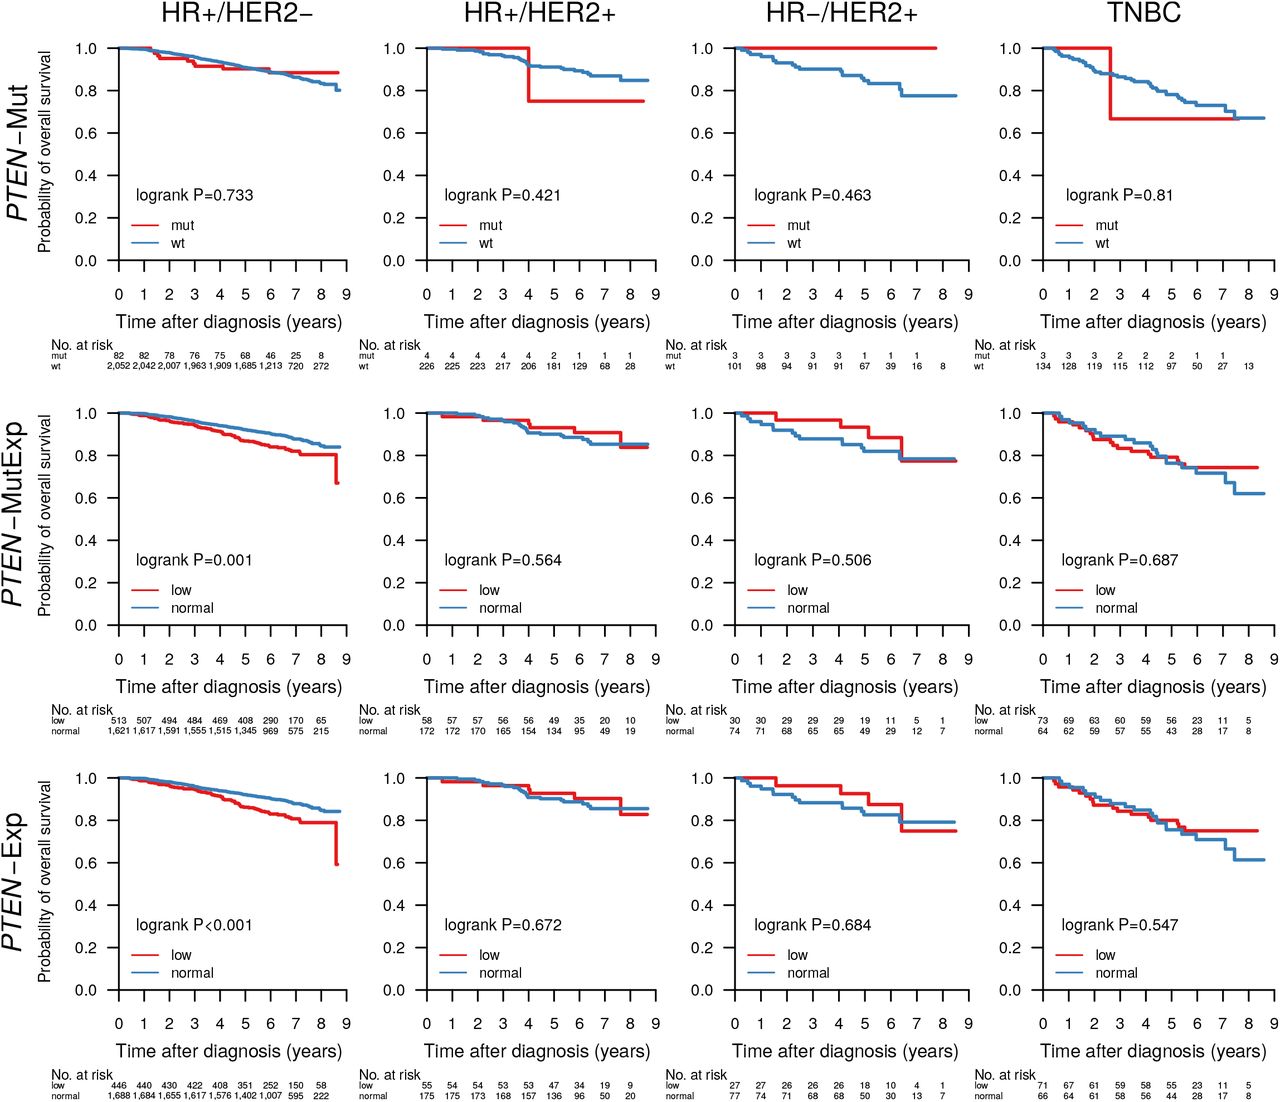
Overall survival of patients with tumors containing a PTEN mutation (PTEN-Mut), a PTEN mutation and/or PTEN expression in the lower cohort-quartile (PTEN-MutExp), or PTEN expression in the lower cohort-quartile (PTEN-Exp) in the clinical patient subgroups HR+/HER2-(HR+ when ER+ and PgR+, HR-otherwise), HR+/HER2+, HR-/HER2+, and TNBC.

Overall survival of patients with tumors containing mutations in the genes A) TP53, B) PIK3CA, C) ERBB2, D) PTEN, E) PTEN or PTEN expression in the lower quartile across the cohort, stratified by the clinical patient subgroups HR+/HER2-(HR+ when ER+ and PgR+, HR-otherwise), HR+/HER2+, HR-/HER2+, and TNBC.

Overall survival of patients with tumors containing mutations in pathways WNT signaling, Hedgehog signaling, cell cycle, p53 independent DNA damage repair, and TGFβ signaling, stratified by the clinical patient subgroups HR+/HER2-(HR+ when ER+ and PgR+, HR-otherwise), HR+/HER2+, HR-/HER2+, and TNBC.
Association of TMB with OS in all samples, and within the biomarker patient subgroups ER+, ER-, PgR+, PgR-, HER2 amplified, HER2 normal, Ki67-high, Ki67-low, NHG 1-3, HR+/HER2-, HR+/HER2+, HR-/HER2+, TNBC, and PAM50 Luminal A and B, HER2-enriched, and basal-like.
Table 1: Patient demographics and clinicopathological variables in the ABiM and SCAN-B cohorts.
Table 2: Number of Mutations in the ABiM (DNA-seq and RNA-seq) and SCAN-B (RNA-seq) cohorts. Sample numbers differ from total cohort sizes due to filtering resulting in samples with no remaining post-filter mutations.
Table 3: The most occurring non-synonymous mutations in the genes PIK3CA, AKT1, SF3B1, GATA3, ERBB2, TP53, FOXA1, and CDH1 in 3,217 SCAN-B samples. Shown are the total number of mutations, the frequency of the mutations in the SCAN-B cohort (Mut. Samples), and the frequency of a particular mutation within all mutations in the gene (Mut in Gene).
Table 4: One-sided Fisher’s exact test P-values for association of gene mutation status and clinical/molecular biomarker status. Associations with P-values below the significance threshold of 0.05 are highlighted in green.
Supplementary Table S1: RNA-seq statistics for the ABiM and SCAN-B cohorts.
Supplementary Table S2: RNA-seq variant filters and descriptions.
Supplementary Table S3: Number of alterations by type in the post-filter SCAN-B RNA-seq mutation set stratified by single nucleotide variants (SNVs), insertions, and deletions.
Supplementary Table S4: Reactome pathway name to pathway ID mapping.
Acknowledgements
We thank the patients who were part of this study and the SCAN-B study, the employees of the SCAN-B laboratory, the South Sweden Breast Cancer Group, and all SCAN-B collaborators at Hallands Hospital Halmstad, Helsingborg Hospital, Blekinge County Hospital, Central Hospital Kristianstad, Skåne University Hospital Lund/Malmö, Central Hospital Växjö, for inclusion of patients and sampling of tissue for this study. We also thank the Swedish National Breast Cancer Registry and Regional Cancer Center South for clinical data. The SweGen allele frequency data was generated by Science for Life Laboratory.
This work was supported by the Mrs. Berta Kamprad Foundation and funded in part by the Swedish Research Council, Swedish Cancer Society, Swedish Foundation for Strategic Research, Knut and Alice Wallenberg Foundation, VINNOVA, Governmental Funding of Clinical Research within National Health Service (ALF), Scientific Committee of Blekinge County Council, Crafoord Foundation, Lund University Medical Faculty, Gunnar Nilsson Cancer Foundation, Skåne University Hospital Foundation, BioCARE Research Program, King Gustav Vth Jubilee Foundation, and the Krapperup Foundation.
References
- [1].↵
- [2].↵
- [3].↵
- [4].↵
- [5].↵
- [6].↵
- [7].↵
- [8].↵
- [9].↵
- [10].↵
- [11].↵
- [12].↵
- [13].↵
- [14].↵
- [15].↵
- [16].↵
- [17].↵
- [18].↵
- [19].↵
- [20].↵
- [21].↵
- [22].↵
- [23].↵
- [24].↵
- [25].↵
- [26].↵
- [27].↵
- [28].↵
- [29].↵
- [30].↵
- [31].↵
- [32].↵
- [33].↵
- [34].↵
- [35].↵
- [36].↵
- [37].↵
- [38].↵
- [39].↵
- [40].↵
- [41].↵
- [42].↵
- [43].↵
- [44].↵
- [45].↵
- [46].↵
- [47].↵
- [48].↵
- [49].↵
- [50].↵
- [51].↵
- [52].↵
- [53].↵
- [54].↵
- [55].↵
- [56].↵
- [57].↵
- [58].↵
- [59].↵
- [60].↵
- [61].↵
- [62].↵
- [63].↵
- [64].↵
- [65].↵
- [66].↵
- [67].↵
- [68].↵
- [69].↵
- [70].↵
- [71].↵
- [72].↵
- [73].↵
- [74].↵
- [75].↵
- [76].↵
- [77].↵
- [78].↵
- [79].↵
- [80].↵
- [81].↵
- [82].↵
- [83].↵
- [84].↵
- [85].↵
- [86].↵
- [87].↵
- [88].↵
- [89].↵
- [90].↵
- [91].↵
- [92].↵
- [93].↵
- [94].↵
- [95].↵
- [96].↵
- [97].↵
- [98].↵
- [99].↵
- [100].↵
- [101].↵
- [102].↵
- [103].↵
- [104].↵
- [105].↵
- [106].↵
- [107].↵
- [108].↵
- [109].↵
- [110].↵
- [111].↵
- [112].↵
- [113].↵


