

Abstract
Whole genome duplication (WGD) occurs across kingdoms and can promote adaptation. However, the sudden increase in chromosome number, as well as immediate changes in cellular physiology, are traumatic to conserved cellular processes. Previous work in Arabidopsis arenosa revealed a clearly coordinated genomic response to WGD, involving a set of functionally and physically interacting proteins mediating crossover number and distribution during prophase I of meiosis. Here we ask: is this highly coordinated coevolutionary shift repeated in other species? We also test globally for convergence for all processes under selection in independent cases of adaptation to WGD, as other processes were under selection in A. arenosa and may be common to other independent adaptation events following WGD. Taking advantage of a well-characterised diploid/autopolyploid system, Cardamine amara, we test our hypothesis that convergence will be detected in the form of directional selection. We also investigate at what level convergence may be evident: identical genes, networks, or analogous processes. To do this we performed a genome scan between diploid and autotetraploid populations, while utilising a quartet-based sampling design to minimise false positives. Among the genes exhibiting the strongest signatures of selection in C. amara autotetraploids we detect an enrichment for DNA maintenance, chromosome organisation, and meiosis, as well as stress signalling. We find that gene-level convergence between the independent WGD adaptation events in C. amara and A. arenosa is negligible, with no more orthologous genes in common than would be expected by chance. In contrast to this, however, we observe very strong convergence at the level of functional processes and homologous (but not orthologous) genes. Taken together, our results indicate that these two autopolyploids survived the challenges attendant to WGD by modifying similar or identical processes through different molecular players and gives the first insight into the salient adaptations required to cope with a genome-doubled state.
Introduction
Whole genome duplication (WGD) is both a massive mutation and a key force in evolution1. The opportunities (and challenges) presented by WGD occur in an instant, realised in a single generation. As such, WGD comes as a shock to the system. Autopolyploids, formed by WGD within-species (without hybridization), emerge from the chance encounter of two sets of unreduced gametes (diploid rather than haploid). Thus, they typically harbour four full genomes that are similar in all pairwise combinations2, resulting in a lack of pairing partner preferences at meiosis. This, combined with multiple crossover events per chromosome pair, can result in entanglements among three or more homologs at anaphase and mis-segregation or chromosome breakage, leading to aneuploidy2–4. Beyond this obvious challenge, WGD presents a suddenly transformed intracellular landscape to the conserved workings of the cell, such as altered ion homeostasis and a host of ‘nucleotypic’ factors revolving around cell size, volume, and cell cycle duration 4–6. Occasionally however, a lineage survives this early trauma and graduates to runaway evolutionary success. Indeed there is some direct empirical evidence of the increased adaptability of polypoid lineages from in vitro evolutionary competition experiments7. In fact, with increased ploidy, genetic variability can be maintained in a masked state, with evidence of lineages acting as allelic sponges recruiting diverse alleles by gene flow across ploidies, and indeed, species8,9. Thus, while substantial opportunities may present for lineages that can adapt to a WGD state, clear challenges must be overcome to function as a polyploid4,10,11.
The genomic basis for adaptation to WGD has been assayed in high resolution in wild, outcrossing Arabidopsis arenosa12, which exists as both diploid and autotetraploid in central Europe13. In that case a remarkably clear signal emerged in genome scans for selective sweep following WGD: among the most extreme signals of genome-wide selection, a concerted set of highly discrete, gene-sized selective sweeps was obvious among a suite of loci that cooperatively govern meiotic chromosome crossover number and distribution during prophase I of meiosis12,14. The products of these genes, ASY1, ASY3, SYN1, PDS5, PRD3, ZYP1a, ZYP1b, and SMC3, physically and/or functionally interact in this tightly coordinated, conserved process, and thus represent an unusually strong candidate complex for mediating this major evolutionary transition. In the evolved autotetraploids harbouring these selected alleles, we observed a reduction in the quantity of meiotic crossovers per chromosome, relative to the rate in diploid sister lineages, and a dramatic reduction in chromosome entanglements and aneuploidy relative to synthetic autopolyploids with the diploid alleles12.
Recent works have probed the origin of these alleles and found that in the sister species Arabidopsis lyrata, the autotetraploid indeed harbours the selected alleles discovered in A. arenosa, which again present the strongest signs of selection in A. lyrata9. Moreover, from a joint population genomic analysis of both species across a hybrid zone, clear signals of bidirectional adaptive gene flow emerge exactly at these adaptive alleles between A. arenosa and A. lyrata.9,15 A panel of segregating populations across the hybrid zone was carefully phenotyped cytologically for meiotic chromosome configurations and the presence of each of the selected alleles was surveyed15. Highly contrasting single gene associations were picked up between the stability of meiosis and the presence of each of these alleles, including a reduction in crossover number and a change in crossover distribution15. In seeking the origin of these adaptive alleles, both studies found that in A. arenosa and in A. lyrata there is clear signal that complementary, interacting subsets of the adaptive alleles originated in the opposite diploid species, indicating bidirectional adaptive gene flow between them. This gene flow is potentiated by the WGD itself, and thus there is an interdependence in the stabilisation of each young WGD9,15. Therefore, A. lyrata and A. arenosa WGD stabilisation events are not independent.
Here we use an independent system, ~17 million years diverged from both A. arenosa and A. lyrata16, to test the hypothesis that this solution of nimble prophase I gene evolution is repeated, and if not, whether changes at other meiosis proteins are associated with adaptation to WGD. Given the clear results in the case of A. arenosa and A. lyrata, we hypothesised that the rapid changes observed in these species might be repeated, offering a striking case of repeated evolution in a core cellular process. To do this, we take advantage of a divergent16, well-characterised diploid/autopolyploid species, Cardamine amara (Brassicaceae, tribe Cardamineae). A large-scale cytotyping survey and genetic structure analysis demonstrated an autopolyploid origin of the tetraploid cytotype found in the Eastern and Central Alps17–20. Importantly, C. amara occupies similar territory as both A. arenosa and A. lyrata and similar life history (perennial herb) and evolutionary history (likely single origin in the target study area, followed by tetraploid expansion associated with glacial oscillations)18,19.
To test our hypothesis that the evolution of meiosis genes is repeated in C. amara, we performed a genome scan for divergent selection, contrasting natural C. amara tetraploid and diploid populations. We found a clear set of selection signals at genes predicted to be involved in cellular functions central to adaptation to WGD: meiosis, chromosome remodelling, cell cycle regulation, and ion transport. However, we found that C. amara responds to WGD very differently to A. arenosa and A. lyrata, with highly contrasting signals of selection following WGD: none of the same prophase I loci emerged as the most strongly selected genomic loci, although some homologs of those found in A. arenosa do exhibit signals of positive selection. Thus, we detect minimal gene-level convergence in the loci mediating prophase I meiosis adaptation. However, we find a very strong signal of process-level convergence between these two WGD adaptation events in species ~17myr diverged, indicating substantial convergence in the adaptation of core processes controlling DNA management, chromosome organisation, stress signalling, and ion homeostasis.
Results and Discussion
Population selection, sampling and genetic structure
To assess the genetic basis of adaptation to WGD in C. amara, we re-sequenced pools of individuals from four populations of contrasting ploidy: two diploid (LUZ, VRK) and two autotetraploid (CEZ, PIC; Fig. 1A; Table S1). We chose these populations based on a comprehensive cytological survey of over 3,000 C. amara samples throughout the Czech Republic18. The populations we sampled represent core areas of each cytotype, away from potential hybrid zones and distant from any triploid-containing populations. Further, we performed flow cytometry on all samples sequenced to verify expected ploidy.

A, Locations of C. amara populations sampled in the Czech Republic (red, diploids LUZ and VKR; blue, tetraploids CEZ and PIC; measure corresponds to 200 km; shaded area represents each cytotype range from 18, with evident tetraploid range expansion southward). B, Population structure represented by Principal Component Analysis (PCA) of ~124,000 fourfold degenerate SNPs. C, Rank Sum design used to minimise any influence of population-specific divergence in tests for directional selection. ‘p1’ to ‘p4’ represent the between-ploidy contrasts used for the rank sum calculations. ‘dd’ and ‘tt’ represent within-ploidy contrasts used to subtract signal of local adaptation.
To obtain robust population allele frequency estimates across the genomes, we performed a pooled sequencing approach. From each population we pooled DNA from 25 individuals in triplicate and generated on average 31 million reads per pooled sample. We mapped the reads onto our newly generated de novo C. amara synthetic long read assembly (n50=1.82 MB, 95% complete BUSCOs; see Methods). After read mapping, variant calling and quality filtration, we obtained a final dataset of 2,477,517 SNPs (mean coverage depth per population = 86, Table S2).
Population structure of C. amara represented by Principal Component Analysis (PCA) based on ~124,000 nearly neutral 4-fold degenerate (4-dg) SNPs showed primary differentiation by ploidy (first axis explained 43% of all variability) while the second axis (28% of variability explained) differentiated the two diploid populations from each other (Fig. 1B). Similarly, the two tetraploid populations had the lowest differentiation of all contrasts (Fst = 0.04, mean allele frequency difference = 0.06) and showed a complete absence of fixed differences (Table 1). Close genetic similarity together with spatial arrangement (the populations represent part of a continuous range of tetraploid cytotype spanning to Eastern Alps) suggest that both tetraploid populations represent the outcome of a single polyploidization event, in line with previous population genetic inference based on large-scale sampling18. The similar level of interploidy divergence within both C. amara and A. arenosa (average Fst between diploids and tetraploids = 0.10 and 0.11, respectively) suggest that the polyploidization events in both species happened at roughly comparable time points in the past (Table 1).
Measures of genome-wide differentiation between C. amara and A. arenosa populations
Directional selection specifically associated with WGD in C. amara
To minimise false positives due to local population history we leveraged a quartet-based sampling design21, consisting of two diploid and two tetraploid populations (Fig. 1C). We calculated Fst for 1 kb windows with a minimum 20 SNPs for all six possible population contrasts, and ranked windows based on Fst values. The mean number of SNPs per population contrast was 2,270,868 (Table 1). To focus on WGD-associated adaptation, we firstly assigned ranks to each window based on the Fst values in each of four possible pairwise diploid-tetraploid contrasts and identified windows in the top 1% outliers of the resultant combined rank sum (Fig. 1C, contrasts p1-p4). We then excluded any window which was also present in the top 1% Fst outliers in diploid-diploid or tetraploid-tetraploid population contrasts to avoid misattribution caused by local population history (Fig. 1C, contrasts ‘tt’ and ‘dd’). By this conservative approach, we identified 440 windows that intersected 229 gene coding loci (Table S3; ‘candidate genes’ below). Among these 229 gene coding loci, a Gene Ontology (GO) term enrichment analysis yielded 22 significantly enriched biological processes (conservative ‘elim’ p < 0.05, Table S4). To further refine the gene list to putatively functional candidates we complemented these differentiation measures with a quantitative estimate following the fineMAV method22 (see Methods). SNPs were assigned a fineMAV score based on the predicted functional consequences of amino acid substitutions, using Grantham scores, amplified by the allele frequency difference between the two amino acids22. From our 229 Fst outliers, 120 contained at least one 1% fineMAV outlier amino acid substitution (Table S3, S5).
DNA maintenance (repair, chromosome organisation) and meiosis under selection in C. amara
Of the 22 significantly enriched GO processes, the most enriched by far was ‘DNA metabolic process’ (p-value = 6.50E-08, vs 0.00021 for the next most confident enrichment), although there was also enrichment for ‘chromosome organization’ and ‘meiotic cell cycle.’ The 40 genes contributing to these categories have localised peaks of differentiation (Fig. 2), as well as 1% fineMAV outlier SNPs in their gene coding regions (Table S3), indicating specifically localised selective sweeps. These genes cluster in STRING interaction networks, suggesting coevolutionary dynamics driving these selection signatures (Fig. S1; see Methods, and Results below). The largest cluster comprises of MSH6, PDS5e, SMC2, MS5, PKL, HDA18, CRC, and homologs of two uncharacterised, but putative DNA repair related loci AT1G52950 and AT3G02820 (containing SWI3 domain). MUTS HOMOLOG 6 (MSH6) is a component of the post-replicative DNA mismatch repair system. It forms a heterodimer with MSH2 which binds to DNA mismatches23,24, enhancing mismatch recognition. MutS homologs have also been shown to control crossover number in A.thaliana25. The C. amara ortholog of AT1G15940 is a close homolog of PDS5, a protein required in fungi and animals for formation of the synaptonemal complex and sister chromatid cohesion26. STRUCTURAL MAINTENANCE OF CHROMOSOMES 2 (SMC2/TTN3) is a central component of the condensin complex, which is required for segregation of homologous chromosomes at meiosis27 and stable mitosis28. PICKLE (PKL) is a SWI/SWF nuclear-localized chromatin remodelling factor29,30 that also has highly pleiotropic roles in osmotic stress response31, stomatal aperture32, root meristem activity33, and flowering time34. Beyond this cluster, other related DNA metabolism genes among our top outliers include DAYSLEEPER, a domesticated transposase that is essential for plant development, first isolated as binding the Kubox1 motif upstream of the DNA repair gene Ku7035. The complex Ku70/Ku80 regulate non-homologous end joining (NHEJ) double-strand break repair36. Consistent with this, DAYSLEEPER mutants accumulate DNA damage37, but the exact role of DAYSLEEPER in normal DNA maintenance is not understood. Interesting also is the identification of MALE-STERILE 5 (MS5/TDM1), which is required for cell cycle exit after meiosis II. As the name implies, MS5 mutants are male sterile, with pollen tetrads undergoing an extra round of division after meiosis II without chromosome replication38. MS5/TDM1 may be an APC/C component whose function is to ensure meiosis termination at the end of meiosis II39. Together, this set of DNA management loci exhibiting the strongest signals of selection points to a widespread modulation of DNA repair and chromosome management following WGD in C. amara.

Examples of selective sweep signatures among eight loci (red) among Fst candidate genes, here chosen for illustration due to inferred function or clarity of signature. X-axis gives scaffold position in base pairs. Y-axis gives Fst values at single-nucleotide polymorphisms (dots) between diploid and tetraploid C. amara. Red arrows indicate gene models overlapping top 1% Fst windows and grey lines indicate neighbouring gene coding loci.
Evolution of stress signalling, and ion homeostasis genes
The remainder of the enriched GO categories in C. amara revolved around a diversity of intracellular processes, including abiotic and biotic stress response, protein phosphorylation, root development, ABA signalling, and ion homeostasis. The intersection of these processes was often represented by several genes. For example, two of the top 20 highest-scoring SNPs in the genome-wide fineMAV analysis reside in SNF1-RELATED PROTEIN KINASE SnRK2.9 (Table S5). SnRKs have been implicated in osmotic stress and root development40,41, and their activity also mediates the prominent roles of Clade A protein phosphatase 2C proteins in ABA and stress signalling42. Interesting in this respect is a strong signature of selection in HIGHLY ABA-INDUCED PP2C GENE 1, a clade A PP2C protein (Table S3). Stress-related phosphoinositide phosphatases are represented by SAC9, mutants of which exhibit constitutive stress responses43.
Given the observed increase in potassium and dehydration stress tolerance in first generation autotetraploids5, it is interesting that our window-based outliers include an especially dramatic selective sweep at K+ EFFLUX ANTIPORTER 2 (KEA2, Fig. 2), a K+ antiporter that modulates osmoregulation, ion, and pH homeostasis44. Recent evidence indicates that KEA2 is important for eliciting a rapid hyperosmotic-induced Ca2+ response to water limitation imposed by osmotic stress45. The KEA2 locus in autotetraploid C. amara features an exceptional ten fineMAV-outlier SNPs (Table S3, S5), indicating that the sweep contains a run of radical amino acid changes at high allele frequency difference between the ploidies, strongly suggesting a ploidy-selected functional change. We also detect CATION-CHLORIDE CO-TRANSPORTER 1, HAP 5, a Na+, K+, Cl− co-transporter, involved in diverse developmental processes and Cl− homeostasis46.
Gene ortholog-level convergence between C. amara and A. arenosa
We hypothesized that WGD imposed strong, specific selection pressures leading to convergent directional selection on the same genes or at least on different genes playing a role in the same process (gene- or function-level convergence, respectively) between C. amara and A. arenosa. To test for this, we complemented our C. amara genome scan with an expanded analysis of A. arenosa divergence outliers based on an expanded sampling relative to the original A. arenosa genome scan studies12,14. We selected the 80 diploid and 40 tetraploid individuals sequenced most deeply in a recent range-wide survey of genomic variation in A. arenosa (mean coverage depth per individual = 18; 160 haploid genomes sampled of each ploidy), and scanned for Fst outliers in 1-kb-windows, as we did for C. amara. We identified 696 windows among 1% Fst outliers, overlapping 452 gene-coding loci (Table S6), recovering results similar to 12, including the interacting set of prophase I meiosis loci. However, from this entire list of 452 gene coding loci exhibiting signs of selective sweep following WGD in A. arenosa, only six orthologous loci were shared with our 229 C. amara Fst divergence outlier loci (Table 2). This degree of overlap is not significant (p = 0.42, Fisher’s exact test), indicating no excess convergence at the level of orthologous genes. While this lack of convergence at the orthologous gene level is not a great surprise given the divergence between these two species, we note that it may at least in part be caused by the radically contrasting differences in relatedness of C. amara and A. arenosa from A. thaliana, the molecular model system in which the vast majority of gene function information is generated. Accordingly, C. amara annotations, being ~17 million years diverged from the Arabidopsis genus, are less certain than those for A. arenosa, which is three times more closely related to A. thaliana. This distance may obscure the true orthology between genes, making overlap at the level of functional category a stronger reflection of convergence.
Genes under selection in both A. arenosa and C. amara following WGD
Convergence by function
While we found no excess convergence at the level of orthologous genes under selection, we speculated that convergence may occur nevertheless at the level of functional pathways. To test this, we overlapped the GO terms that were significantly enriched in each species. Of the 73 enriched GO terms in A. arenosa (Table S7), five were identical with those enriched in the C. amara candidate gene list (significant overlap; p = 5.2e-06, Fisher’s exact test; Table 3). In addition to this, processes related to meiosis were found in both species, but were represented by slightly different GO terms ("meiotic cell cycle" in C. amara, "meiotic cell cycle process" in A. arenosa).
Convergent processes under selection in both C. amara and A. arenosa following WGD
Remarkably, the relative ranking of enrichments of all four convergent terms was identical in both C. amara and A. arenosa (Table 3). This stands in strong contrast to the fact that A. arenosa presented an obvious set of physically and functionally interacting genes in the top two categories (‘DNA metabolic process’ and ‘chromosome organisation’), namely prophase I meiosis genes focussing on synaptonemal complex construction and function. The genes in these categories in C. amara appear to function in more diverse DNA management roles.
To determine whether there were other loci potentially involved in prophase I processes selected in C. amara that were not orthogrouped as such, we performed a search for other meiosis-related genes in C. amara, focussing on close homologs or gene family members that may not have been orthogrouped jointly in both species (see Methods). Several loci stand out: for example, a close homolog of the C. amara PDS5e exhibits the very strongest signal of selection in A. arenosa, PDS5b12 (see Yant et al, 2013, Fig. 3). In addition, we note that the C. amara ortholog PDS5b harbours an unusually high three fineMAV outlier SNPs, though it is not included on the window-based candidate list. ASY3, which is a component of the synaptonemal complex (SC), controlling crossover distribution at meiosis, has one fineMAV outlier polymorphism. Among the other interacting prophase I genes identified under selection in A. arenosa, there is some evidence of selective sweep just upstream of the coding regions of PRD3, SDS, and SYN1 (Table S8) in C. amara. Likewise, in C. amara we observe SMC2-1 and in A. arenosa, homolog SMC3. Other connections across meiotic processes include the C. amara candidate MS5, regulating cell cycle number in meiosis II, which is also a functional interactor with SMG747, a top candidate in A. arenosa (Table S6). We note also that SMG7 exhibits elevated Fst in C. amara, though not as a 1% outlier (Table S8). Both act together in a pathway to facilitate exit from meiosis47. The key regulator of ploidy levels in Arabidopsis endoreduplication, CYCA2;3, is under selection in A. arenosa and is also is a 1% outlier in our C. amara fineMAV analysis, although it was not included in the Fst window analysis (number of SNPs < 10). However, upon inspection of Fst values of the SNPs in this gene, a window intersecting CYCA2;3 would rank among the top 20 windows genome-wide. We note too that PKL (above) is also on two of the three outlier lists in A. arenosa (‘DD’ and ‘CLR’ outliers in Yant 2013).
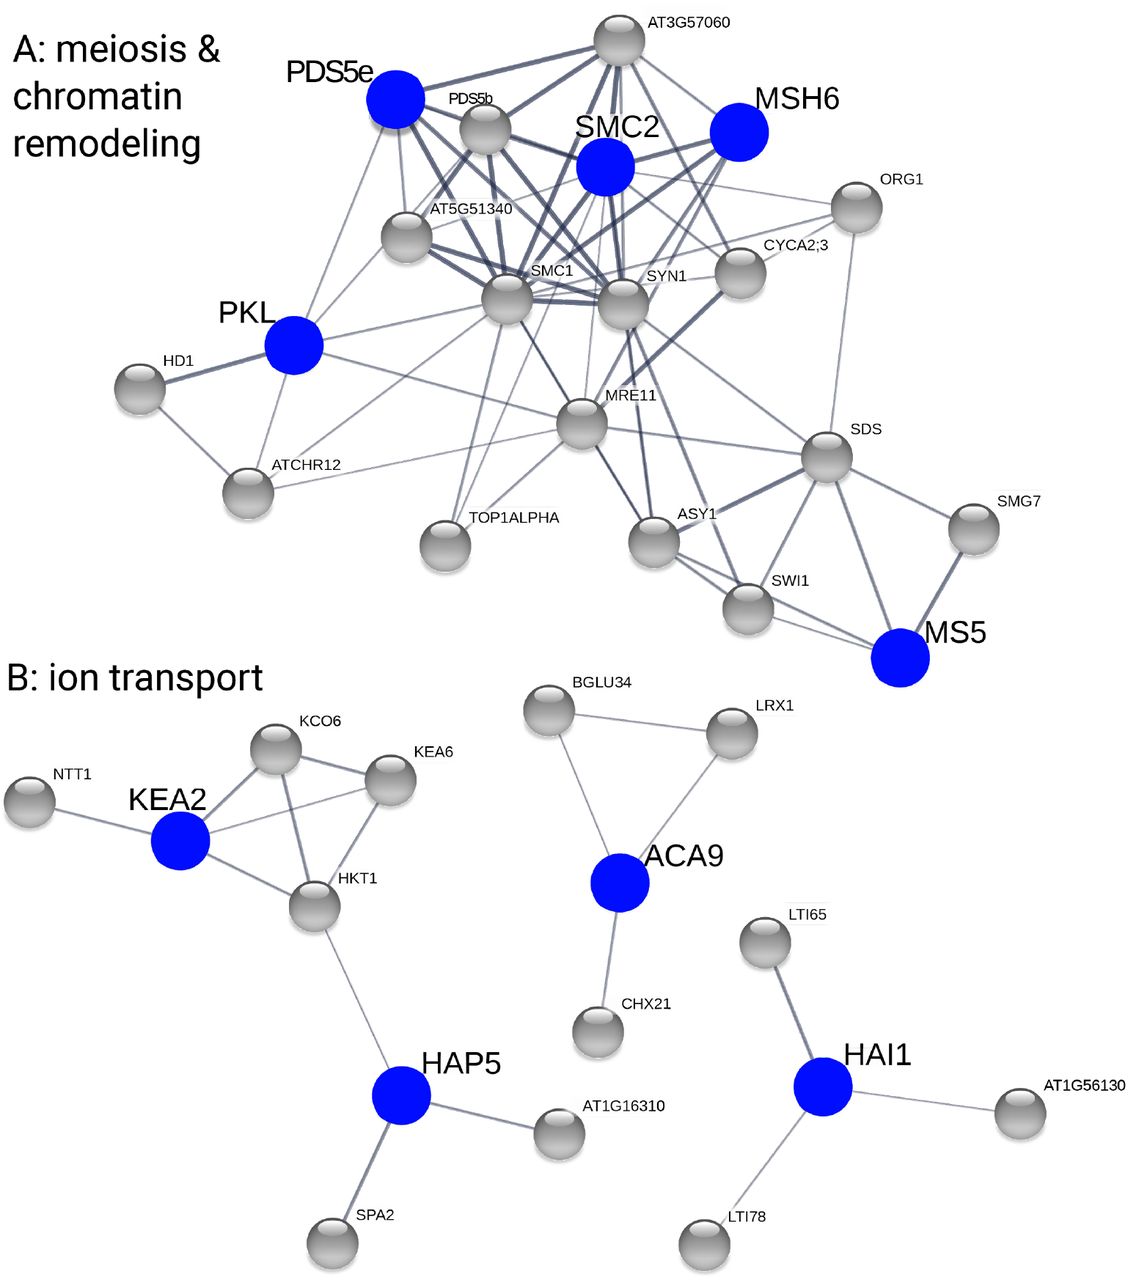
Plots show C. amara candidate genes in blue and STRING-associated A. arenosa candidate genes in grey. We used only medium confidence associations and higher (increasing thickness of lines connecting genes indicates greater confidence). A, meiosis- and chromatin remodelling-related genes. B, ion transport- and stress-related genes.
Evidence for convergent protein associations
Given the tight set of physically and functionally interacting meiosis I proteins under selection in A. arenosa12, we sought for evidence of such interactions in C. amara. Additionally, we sought for evidence that genes under selection in C. amara might interact with those found under selection in A. arenosa, which would confirm functional convergence. Thus we took advantage of protein association information from the STRING database48. STRING associations are estimates of proteins’ joint contributions to a shared function. While a STRING interaction does not necessarily mean that the orthologous proteins physically interact, an overabundance of such interactions among a set of proteins points to potential shared function and suggests interactions in novel systems. For each C. amara Fst outlier therefore we searched for the presence of STRING interactors among the A. arenosa Fst outliers, reasoning also that finding such associated partners under selection in two species may suggest that directional selection targeted similar functions in both species through different genes. Following this approach, we found that out of the 229 C. amara candidates, 90 had an associated protein among the 452 candidate genes in A. arenosa. In fact, 57 had more than one associated protein among A. arenosa candidates (Fig. 3 and Table S9). This level of overlap was greater than expected by chance (p=0.001 for both “any association” and “more-than-one association”, as determined by permutation tests with the same database with 1000 randomly generated candidate lists), suggesting convergent evolution of these processes following WGD in C. amara and A. arenosa.
Several large STRING clusters were evident among Fst outliers in C. amara and A. arenosa (Fig. 3). The largest of these clusters centre on genome maintenance, specifically meiosis and chromatin remodelling (Fig. 3A), and ion homeostasis (especially K+ and Ca2+), along with stress (ABA) signalling (Fig. 3B), consistent with the results of GO analysis. Taken together, both STRING and GO analyses support our hypothesis of functional convergence of these processes following WGD in C. amara and A. arenosa.
Conclusion
Given the shared challenges attendant to WGD in C. amara and A. arenosa4,10,11, we hypothesised at least partially convergent responses in these species. While we found obvious convergent recruitment at the level of inferred functional processes, we could detect no excess convergence at orthologous genes with our genome scanning approach. This is consistent with the absence of shared standing variation between these species, being 17 million years diverged. The convergent functions (meiosis, chromosome organisation, ABA signalling, and cellular response to ABA and alcohol) provide first insights into the salient challenges associated with WGD, given that these two species are divergent evolutionary replicates. Our results detail obvious differences between the candidate solutions evolved in response to each independent WGD. Most prominent is the lack of prophase I meiosis loci under selection in C. amara, relative to the striking, coordinated selection of physically and functionally interacting proteins regulating crossover number and distribution in A. arenosa. In contrast, WGD adaptation in C. amara features a shift in focus to factors governing timing during later meiosis, especially the exit from meiotic divisions as evidenced by the interacting trio of SMG7, SDS and MS5, along with other chromatin remodelling factors and DNA repair-related proteins, such as MSH6 and DAYSLEEPER. The biological importance of this contrast is not yet clear. It may be that C. amara is relatively preadapted to the challenges presented by autotetraploid crossover dynamics. Therefore, substantial reductions in crossover number mediated during prophase I may not be necessary. This could allow decoupling of the crossover reduction that dominated A. arenosa, from broader changes across meiosis and other processes revealed here.
Methods
Reference Genome Assembly and Alignment
We generated a de novo assembly using the 10x Genomics Chromium approach. In brief, a single diploid individual from pop LUZ (Table S10) was used to generate a single Chromium library, sequenced using 250PE mode on an Illumina sequencer, and assembled with Supernova version 2.0.0. This assembly had an overall scaffold N50 of 1.82mb. An assessment of genome completeness using BUSCO (version 3.0.2)49 for the 2,251 contigs >=10kb was estimated at 94.8% (1365/1440 BUSCO groups; Table S11).
BioNano Plant Extraction protocol
Fresh young leaves of the C. amara accession LUZ were collected after 48-hour treatment in the dark. DNA was extracted by the Earlham Institute’s Platforms and Pipelines group following an IrysPrep “Fix’n’Blend” Plant DNA extraction protocol supplied by BioNano Genomics. 2.5 g of fresh young leaves were fixed with 2% formaldehyde. After washing, leaves were disrupted and homogenized in the presence of an isolation buffer containing PVP10 and BME to prevent oxidation of polyphenols. Triton X-100 was added to facilitate the release of nuclei from the broken cells. The nuclei were then purified on a Percoll cushion. A nuclei phase was taken and washed several times in isolation buffer before embedding into low melting point agarose. Two plugs of 90 μl were cast using the CHEF Mammalian Genomic DNA Plug Kit (Bio-Rad 170-3591). Once set at 4C the plugs were added to a lysis solution containing 200 μl proteinase K (QIAGEN 158920) and 2.5 ml of BioNano lysis buffer in a 50 ml conical tube. These were put at 50C for 2 hours on a thermomixer, making a fresh proteinase K solution to incubate overnight. The 50 ml tubes were then removed from the thermomixer for 5 minutes before 50 μl RNAse A (Qiagen158924) was added and the tubes returned to the thermomixer for a further hour at 37C.The plugs were then washed 7 times in Wash Buffer supplied in Chef kit and 7 times in 1xTE. One plug was removed and melted for 2 minutes at 70C followed by 5 minutes at 43C before adding 10 μl of 0.2 U /μl of GELase (Cambio Ltd G31200). After 45 minutes at 43C the melted plug was dialysed on a 0.1 μM membrane (Millipore VCWP04700) sitting on 15 ml of 1xTE in a small petri dish. After 2 hours the sample was removed with a wide bore tip and mixed gently 5 times and left overnight at 4C.
10X library construction
DNA material was diluted to 0.5ng/ul with EB (Qiagen) and checked with a QuBit Flourometer 2.0 (Invitrogen) using the QuBit dsDNA HS Assay kit (Table S10). The Chromium User Guide was followed as per the manufacturer’s instructions (10X Genomics, CG00043, Rev A). The final library was quantified using qPCR (KAPA Library Quant kit [Illumina] and ABI Prism qPCR Mix, Kapa Biosystems). Sizing of the library fragments was checked using a Bioanalyzer (High Sensitivity DNA Reagents, Agilent). Samples were pooled based on the molarities calculated using the two QC measurements. The library was clustered at 8pM with a 1% spike in of PhiX library (Illumina). The pool was run on a HiSeq2500 150bp Rapid Run V2 mode (Illumina). The following run metrics were applied: Read 1: 250 cycles, Index 1: 8 cycles, Index 2: 0 cycles and Read 2: 250 cycles.
Sequencing and assembly and assembly QC
Raw reads were subsampled to 90 M reads and assembled with Supernova 2.0.0 (10x Genomics), giving a raw coverage of 60.30x and an effective coverage of 47.43x. The estimated molecule length was 44.15 kb. The assembly size, counting only scaffolds longer than 10kb was 159.53 Mb and the Scaffold N50 was 1.82MB. The k-mer estimate for the genome size was 225.39 MB, hence we are missing 16.61% from the assembly by retaining only contigs longer than 10Kb. We further scaffolded the assembly using the published Cardamine hirsuta genome using graphAlign50 and Nucmer51.
Gene Calling and Annotation
The "plants set" database ‘embryophyta_odb9.tar.gz’ was downloaded from http://busco.ezlab.org/ and used to assess orthologue presence/absence in our C. amara genome annotation. Running BUSCO gave Augustus52 results via BUSCO HMMs to infer where genes lie in the assembly and returning their protein sequences. A blast (v. 2.2.4) database was built for Brassicales (taxid: 3699) by downloading ~ 1.26M protein sequences from https://www.ncbi.nlm.nih.gov/taxonomy/ and the Augustus-predicted proteins were annotated via Interproscan53 and blast2go54.
Orthogrouping and Reciprocal Best Blast Hits
We performed an orthogroup analysis using Orthofinder version 2.3.355. to infer orthologous groups (OGs) from four species (C. amara, A. lyrata, A. thaliana, C. pyrenaica). A total of 21,618 OGs were found. Best reciprocal blast hits (RBHs) for C. amara and A. thaliana genes were found using BLAST version 2.9.0. C. amara genes were then assigned an A. thaliana gene ID for GO enrichment analysis via the following protocol: First, if the genes’ OG contained only one A. thaliana gene ID, that gene ID was used. If the OG contained more than one A. thaliana gene, then the RBH was taken. If there was no RBH the A. thaliana gene ID, then the OG gene with the lowest E-value in a BLAST versus the TAIR10 database was taken. If no OG contained the C. amara gene, then the RBH was taken. Finally, if there was no OG or RBH then the gene with the lowest E-value in a BLAST versus the TAIR10 database was taken. BLASTs versus the TAIR10 database were performed during December 2019.
Population resequencing and genome scans
Sampling design
To isolate genomic regions subjected to directional selection acting specifically between diploids and tetraploids, we sampled a set of two diploid and two tetraploid populations (Fig. 1C). We used comparisons between populations of the same ploidy to constitute a null model for shared heterogeneity in genetic differentiation arising through processes unrelated to WGD (following an approach successfully applied in 21).
Library preparation and sequencing
We extracted DNA in triplicate from 25 individuals for each of the following populations: CEZ (4x), PIC (4x), VKR (2x), and LUZ (2x). All plants used for DNA extraction were verified for expected ploidy by flow cytometry. We then pooled samples of each population, constructed Illumina Truseq libraries (Illumina), and sequenced them on Illumina’s NextSeq platform at a 150 base pair, paired-end specification.
Data preparation, alignment, and genotyping
Fastq files from the two runs were combined and concatenated to give an average of 30.5 million reads per sample (see ‘sample_read_counts.xlsx’). Adapter sequences were removed via the cutadapt software (version 1.9.1)56 and quality trimmed via Sickle (version 33)57 to generate only high-quality reads (Phred score >=30) of 30bp or more, resulting in an average of 27.9 million reads per sample. Using samtools (v. 1.7)58 and bwa (v. 0.7.12)59 software, the quality-filtered reads were aligned against two references: 89.3% of reads mapped to our C. amara assembly, while only 74.5% to C. hirsuta. We retained only the alignment to C. amara for all analysis. Using the picard software tool (v. 1.134)60, first duplicate reads were removed via ‘MarkDuplicates’ followed by the addition of read group IDs to the bam files via ‘AddOrReplaceReadGroups’. Finally, to handle the presence of indels, GATK (v. 3.6.0)61 was used to realign reads to the C. amara assembly via ‘RealignerTargetCreator’ and ‘IndelRealigner’.
Variant Calling
Text files describing sample populations and ploidy were prepared, and variants called for the 12 bam files using Freebayes (v. 1.1.0.46)62 to generate a single VCF output. Due to working with pooled (high ploidy) samples, Freebayes was run with ‘--pooled-discrete’ (assumes samples result from pooled sequencing). In addition, the software was restricted to biallelic sites (‘--use-best-n-alleles 2’) and indel sites were excluded (‘--no-indels’). The VCF was filtered via bcftools (v 1.8)63 to remove sites where the read depth was < 10 or greater than 1.6x the second mode (determined as 1.6 x 31 = 50, Fig. S2).
Population genetic structure
We first calculated genome-wide between-population metrics (Nei’s Fst64 and allele frequency difference). We calculated allele frequencies (AF) as the average AF of all the pools. The AF in individual pools has been calculated as the fraction of the total number of reads supporting the alternative allele65. We used the python3 PoolSeqBPM pipeline, designed to input pooled data (https://github.com/mbohutinska/PoolSeqBPM). Then we inferred relationships between populations as genetic distances using principal component analysis (PCA) implemented in adegenet66.
Window-based selection scan using a quartet design
We performed a window-based Fst (Nei) scan for directional selection in C. amara, taking advantage of quartet of two diploid and two tetraploid populations (Fig. 1C). Using such quartet design, we identified top candidate windows for selective sweeps associated with ploidy differentiation, while excluding differentiation patterns private to a single population or ploidy-uninformative selective sweeps. To do so, we calculated Fst for 1 kb windows with minimum 20 SNPs for all six population pairs in the quartet (Fig. 1C) and ranked windows based on their Fst value. We excluded windows which were top 1% outliers in diploid-diploid (dd in Fig. 1C) or tetraploid-tetraploid (tt) populations contrasts, as they represent variation inconsistent with diploid-tetraploid divergence but rather signal local differentiation within a cytotype. Next, we assigned ranks to each window based on the Fst values in four diploid-tetraploid contrasts and identified windows being top 1% outliers of minimum rank sum.
To account for possible confounding effect of comparing windows from genic and non-genic regions, we calculated the number of base pairs overlapping with any gene within each window. There was not any relationship between the proportion of genic space within a window and Fst (Fig. S3), indicating that our analyses were unaffected by unequal proportion of genic space in a window. In A. arenosa, we performed window-based Fst scan for directional selection using the same criteria as for C. amara (1kb windows, min 20 SNPs per window). We did not use the quartet design as the range-wide dataset of 80 diploid and 40 tetraploid individuals drawn from many popultions assured power to detect genomic regions with WGD-associated differentiation.
fineMAV
We downloaded coding sequences from the C. hirsuta genomic resources web site http://chi.mpipz.mpg.de/download/annotations/carhr38.cds.fa and mapped to C. amara using gmap. The resulting sam file was converted to bam-format, sorted and indexed via samtools (v. 1.7)58, and then converted to GTF-format via the ‘convert’ script in Mikado (v1.2.3)67 which was subsequently used to build a snpEFF (v. 4.3)68 database. We overlapped the candidate minimum rank sum SNPs with candidate SNPs from fineMAV analysis and annotated each SNP identified by both methods with gene to which it belongs. The top candidate gene was annotated to the corresponding molecular network using the software SIFT68.
GO enrichment analysis
To infer functions significantly associated with directional selection following WGD, we performed gene ontology enrichment of gene list using the R package topGO69, using A. thaliana orthologs of C. amara/A. lyrata genes, obtained using biomaRt70. We used Fisher’s exact test with conservative ‘elim’ method, which tests for enrichment of terms from the bottom of the GO hierarchy to the top and discards any genes that are significantly enriched in a descendant GO terms71. We used ‘biological process’ ontology with minimum node size 150 genes.
Protein associations from STRING database
We searched for association among C. amara and A. arenosa candidate genes using STRING48 database. We used multiple proteins search in A. thaliana, with text mining, experiments, databases, co-expression, neighbourhood, gene fusion and co-occurrence as information sources. We used minimum confidence 0.4 and retained only 1st shell associations.
Quantifying convergence
We considered convergent candidates all candidate genes or significantly enriched GO categories that overlapped across both species. Convergent candidate genes had to be members of the same orthogroups55. To test for higher than random number of overlapping items we used Fisher’s Exact Test for Count Data in R72.
Data Availability
All sequence data are freely available in the European Nucleotide Archive (ENA; https://www.ebi.ac.uk/ena) and will be available upon publication.
Acknowledgements
The authors thank Veronika Konečná for assistance with the map figure. This work was supported by the European Research Council (ERC) under the European Union’s Horizon 2020 research and innovation programme [grant number ERC-StG 679056 HOTSPOT], via a grant to LY. Additional support was provided by Czech Science Foundation (project 20-22783S to FK).
Author Contributions
LY conceived the study. MB, MA, PP, SB and PM performed analyses. PM performed laboratory experiments. FK, SB, and PM performed field collections. LY and MB wrote the manuscript with input from all authors. All authors approved of the final manuscript.
Competing Interests statement
The authors declare no competing interests.
Materials & Correspondence
All requests should be addressed to Levi Yant at levi.yant{at}nottingham.ac.uk
Supplemental Information
Table S1. GPS coordinates of population localities.
Table S2. Mean depth of coverage (MDOC) per pool of individuals from each population.
Table S3. Genes in the top 1% of Fst scores (1000 bp windows) in C. amara. Note: red lines denote six genes which are candidates also in A. arenosa.
Table S4. GO terms enriched in C. amara WGD candidate genes. Annotated: # genes in the GO category, Significant: # candidate genes in each category, p-values crom Fisher’s exact test (‘elim’ method).
Table S5. Top 1% of amino acid substitutions with the highest fineMAV score.
Table S6. Genes in the top 1% of Fst scores (1000 bp windows) in A. arenosa.
Table S7. GO terms enriched in A. arenosa WGD candidate genes. Annotated: # genes in the GO category, Significant: # candidate genes in each category, p-values crom Fisher’s exact test (‘elim’ method).
Table S8. Targeted search for patterns suggesting directional selection in C. amara ortologs of candidate A. arenosa meiosis genes.
Table S9. C. amara candidate genes that have more than one associated protein among A. arenosa candidates.
Table S10. Quality checks of DNA isolated from LUZ.
Table S11. An assessment of genome completeness using BUSCO.

C. amara candidate meiosis gene associations as identified by STRING. We used only medium confidence associations and higher (shown as thickness of lines connecting genes).

Distribution of read depth over all sequenced samples

Relationship between the proportion of genic space within a window and Fst
References


