

Summary
Aging, for virtually all life, is inescapable. However, within species and populations, rates of biological aging (i.e., physical decline with age) vary across individuals. Understanding sources of variation in biological aging is therefore central to understanding the biodemography of natural populations. Here, we constructed a DNA methylation-based predictor of chronological age for a population of wild baboons in which behavioral, ecological, and life history data have been collected for almost 50 years (N = 277 blood samples from 245 individuals, including 30 who were longitudinally sampled). Consistent with findings in humans and model organisms [1–4], DNA methylation patterns exhibit a strong, clock-like association with chronological age, but individuals are often predicted to be somewhat older or younger than their known age. However, the two most robust predictors of lifespan described for this population—cumulative early adversity and social bond strength—do not explain this deviation. Instead, the single most predictive factor is male dominance rank: high-ranking males are predicted to be biologically older than their true chronological age, such that alpha males appear to be nearly a year older than their known age. Longitudinal sampling indicates that males who climb the social hierarchy subsequently look epigenetically “older,” likely reflecting the high energetic costs of rank attainment and maintenance in male baboons. Together, our results indicate that environmental effects on survival and epigenetic age can be disjunct, and that achieving high rank for male baboons—the best predictor of reproductive success—imposes physiological costs consistent with a “live fast, die young” life history strategy.
Results and discussion
We used a combination of previously published [5] and newly generated reduced-representation bisulfite sequencing (RRBS) data from 245 wild baboons (N = 277 blood samples) living in the Amboseli ecosystem of Kenya [6] to generate a DNA methylation-based age predictor (an “epigenetic clock:” [1, 2]). Starting with a data set of methylation levels for 458,504 CpG sites genome-wide (Figure S1; Table S1), we used elastic net regression to identify a set of 593 CpG sites that accurately predict baboon age to within a median absolute difference (MAD) of 1.1 years (Pearson’s r = 0.762, p < 10−53; Table S2; median adult life expectancy in this population is 10.3 years for females and 7.94 for males [7]). Because the clock was significantly more accurate in males (N = 135; MAD = 0.9 years; Pearson’s r = 0.86, p < 10−40) than in females (N = 142; MAD = 1.6 years; r = 0.78, p < 10−29; two-sided Wilcoxon test for differences in absolute error by sex: p = 4.35 × 10⁻⁹), we separated males and females for all subsequent analyses (Figure 1A and 1B).

Predicted ages are shown relative to true chronological ages for (A) females (Pearson’s r = 0.78, p < 10−29, N = 142 samples) and (B) males (r = 0.86, p < 10−40, N = 135 samples). Solid lines represent the best fit line; dashed lines show the line for y = x. (C) and (D) show predictions for individuals with at least two samples in the data set (14 females and 16 males, respectively). In 26 of 30 cases (87%), samples collected later were correctly predicted to be from an older animal.
Overall, the clock performed favorably relative to other morphological or biomarker predictors of age in this population. The epigenetic clock generally explained more variance in true chronological age, resulted in lower median error, and exhibited less bias than predictions based on body mass index (BMI) or blood cell composition data from flow cytometry or blood smears (traits found to change with age in baboons [8, 9]). Its performance was comparable to molar dentine exposure, a classical marker of age [10] (Figure S2). For 16 males and 14 females, we had two samples collected at different points in time. The predicted ages from these longitudinally collected samples were older for the later-collected samples, as expected (Figure 1C-D; binomial test p = 5.95 × 10⁻⁵). Furthermore, the change in epigenetic clock predictions between successive longitudinal samples positively predicted the actual change in age between sample dates (β = 0.312, p = 0.027).
In addition to differences in overall accuracy, sex differences were also apparent in the slope of the relationship between predicted age and chronological age. Males show a 2.2-fold higher rate of change in predicted age, as a function of chronological age, compared to females (Figure 1A-B; chronological age by sex interaction in a linear model for predicted age: β = 0.448, p < 10−18, N = 277). This result agrees with previous findings showing that male baboons senesce more rapidly than females—a pattern shared with most other primates investigated thus far, including humans [11]. Interestingly, sex differences are not apparent in animals < 8 years, which roughly corresponds to the age at which the majority of males have achieved adult dominance rank and dispersed from their natal group [12–14] (N = 158, chronological age by sex interaction β = −0.038, p = 0.808). Rather, sex difference becomes apparent after baboons have reached full physiological and social adulthood (N = 119, chronological age by sex interaction β = 0.459, p < 10−6 in animals ≥ 8 years), when divergence between male and female life history strategies is most marked [12–14] and when aging rates between the sexes are predicted to diverge [15–17]. This pattern suggests that within each sex, deviations between predicted age and chronological age—commonly interpreted as a measure of “biological age” or accelerated aging—may also be affected by environmental or life history variation, as has been suggested in humans, lab mice, and captive rhesus macaques [3, 4, 18, 19].
To test this hypothesis, we focused on four factors of known importance to fertility and/or survival components of fitness in the Amboseli baboon population. First, we investigated the effects of cumulative early adversity, which is a strong predictor of shortened lifespan in female baboons: females who experience three or more major sources of early adversity have expected adult lifespans that are a decade shorter than those who experience none [20]. Additionally, those females are less capable of raising their own juvenile offspring later in life, suggesting that early adversity compromises their physical condition over the long-term [21]. Following [20, 21], we measured cumulative adversity as a count of major adverse experiences suffered in early life, including low maternal social status, early life drought, a competing younger sibling, maternal loss, and high experienced population density. To maximize our sample size, we omitted early life social connectedness (included in [20] but omitted for the same reason in [21]), because social connectedness data were missing for mothers born relatively early in the long-term study. We predicted that high cumulative early adversity, which is linked to reduced lifespan, would predict increased biological age.
Second, we considered social bond strength in adulthood, which is positively associated with longer adult lifespan in female Amboseli baboons, human populations, and several other wild social mammals [22–24]. We predicted that low social bond strength, due to its relationship with decreased lifespan, would be associated with increased biological age.
Third, we investigated the effects of dominance rank, which is a major determinant of resource access in baboons. High-ranking males sire the most offspring, and high-ranking females experience shorter interbirth intervals, retain higher fertility during droughts, and form stronger social bonds with males [22, 25–27].
Finally, we assessed the effect of BMI, which captures dimensions of both body condition and competitive advantage [8]. In this case, we calculated BMI relative to the expected value for each male’s age, which eliminates the correlation between BMI and age and BMI and rank. The predictions for dominance rank and body mass index associations were less clear: improved resource access could conceivably slow biological aging, but increased investment in growth and reproduction (either through higher fertility in females or physical competition for rank in males) could also be energetically costly.
We tested these predictions by modeling the deviation between predicted age and known chronological age (Δage) as a function of cumulative early adversity, ordinal dominance rank, body mass index (controlling for age), and for females, social bond strength to other females. Social bond strength was not included in the model for males, as this measure was unavailable for a large proportion of males in this data set (53.8%). We also included chronological age as a predictor in the model, as epigenetic age tends to be systematically overpredicted for young individuals and underpredicted for old individuals (Figure 1A-B); including chronological age in the model controls for this compression effect. No predictor variables were strongly linearly correlated (all R2 < 0.10; Table S3).
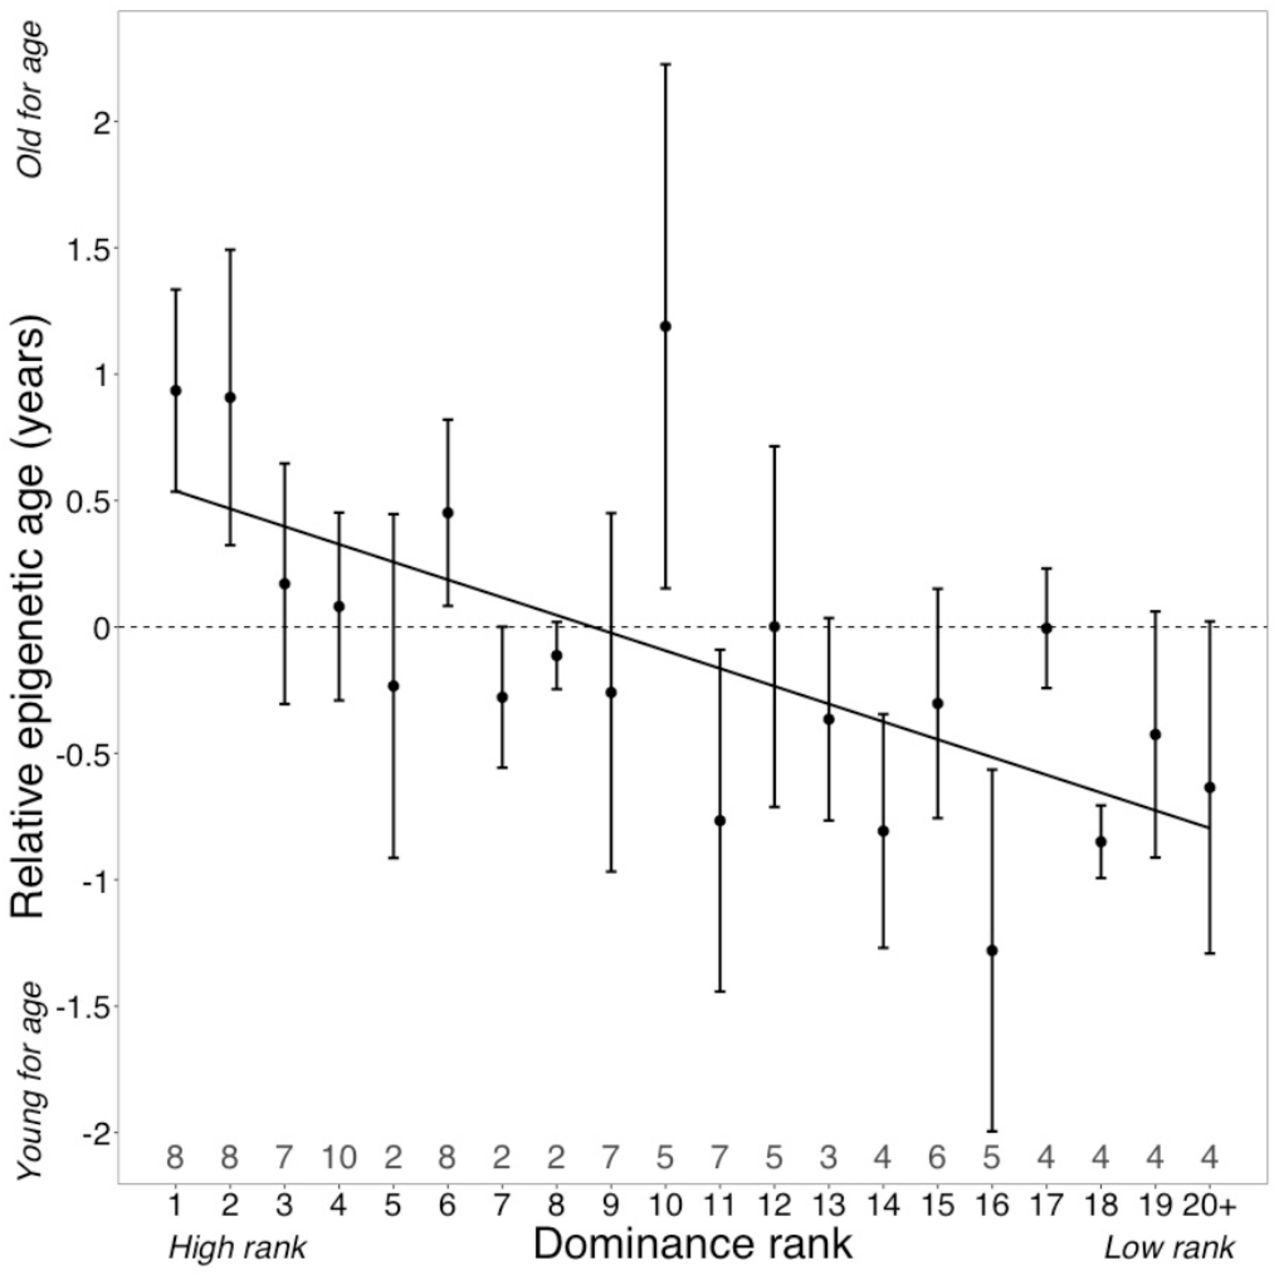
Surprisingly, despite being two of the strongest known predictors of lifespan in wild baboons, neither cumulative early life adversity nor social bond strength explain variation in Δage (Table 1). In contrast, high male dominance rank is strongly and significantly associated with larger values of Δage (β = −0.785, p = 7.0 × 10⁻⁴; Figure 2; Table 1). Alpha males are predicted to be an average of 10.95 months older than their true chronological age—a difference that translates to 11.5% of a male baboon’s expected adult lifespan [7].
Predictors of Δage1

High rank is associated with elevated values of Δage (β = −0.0785, p = 7.39 × 10⁻⁴, N = 105). The y-axis shows relative epigenetic age, a measure of epigenetic aging similar to Δage that is based on the sample-specific residuals from the relationship between predicted age and true chronological age. Positive (negative) values correspond to predicted ages that are older (younger) than expected for that chronological age. Dominance rank is measured using ordinal values, such that smaller values indicate higher rank. Dots and error bars represent the means and standard errors, respectively. Gray values above the x-axis indicate sample sizes for each rank.
Dominance rank is strongly age structured in male baboons: males tend to attain their highest rank between 7 and 12 years of age and fall in rank thereafter. Thus, nearly all males in the top four rank positions in our data set were between 7 and 12 years of age at the time they were sampled (however, because not all 7 – 12 year-olds are high-ranking, low rank positions include males of all age groups; Table S1, Figure S3). Our finding that high rank predicts accelerated epigenetic aging therefore implies that males incur the costs of high rank primarily in early to mid-adulthood, and only if they succeed in attaining high rank. Accelerated epigenetic aging is thus a function of absolute rank values, regardless of age, not deviations from the mean rank expected given a male’s age (i.e., “rank-for-age,” which can be quantified as the residuals of male dominance rank modeled as a quadratic function of chronological age: Figure S3). In support of this interpretation, a model that includes rank-for-age as an additional covariate recapitulates the significant effect of ordinal male rank (p=0.045), but finds no effect of rank-for-age (p=0.819; Table S4). In contrast, we observed no evidence for rank effects on Δage in females, consistent with overall sex differences in patterns of aging in primates and other mammals [15] and marked sex differences in the effects of rank on other molecular phenotypes in the Amboseli baboons specifically [11, 28].
Previous work has shown that high-ranking male baboons, but not high-ranking female baboons, up-regulate gene expression in inflammation-related and immune response pathways [28]. Elevated or chronic inflammation is thought to be one of the hallmarks of aging, and, in human populations, is one of the strongest predictors of mortality risk [29–31]. Consistent with these observations, CpG sites in the epigenetic clock that increase in DNA methylation with age (N = 459 sites) are enriched in or near genes that are up-regulated in the Amboseli baboons in response to the bacterial endotoxin lipopolysaccharide (LPS), which is a strong driver of inflammation (Figure S3; Fisher’s exact test: log2(odds ratio) = 1.88, p = 0.001; gene expression data from [28]). In contrast, clock sites that decrease in DNA methylation with age (N = 134) are significantly enriched in or near genes that are down-regulated after LPS exposure (Fisher’s exact test: log2(OR) = 3.28, p = 0.002). Clock sites, especially those for which DNA methylation is positively correlated with age, are also enriched in genes, CpG islands, promoter regions, and putative enhancers, compared to the background set of sites we initially considered as candidates for inclusion in the clock (Figure S4; Fisher’s exact tests, all p < 0.005; similar functional enrichment has been found in a human epigenetic clock [2]). Moreover, clock sites are enriched in regions previously found to change in methylation levels with age [32] and in regions showing regulatory activity in high-throughput reporter assays [33]. Together, these results suggest that accelerated epigenetic aging in males reflects functionally important changes in DNA methylation levels, concentrated in immune response and inflammation-related pathways.
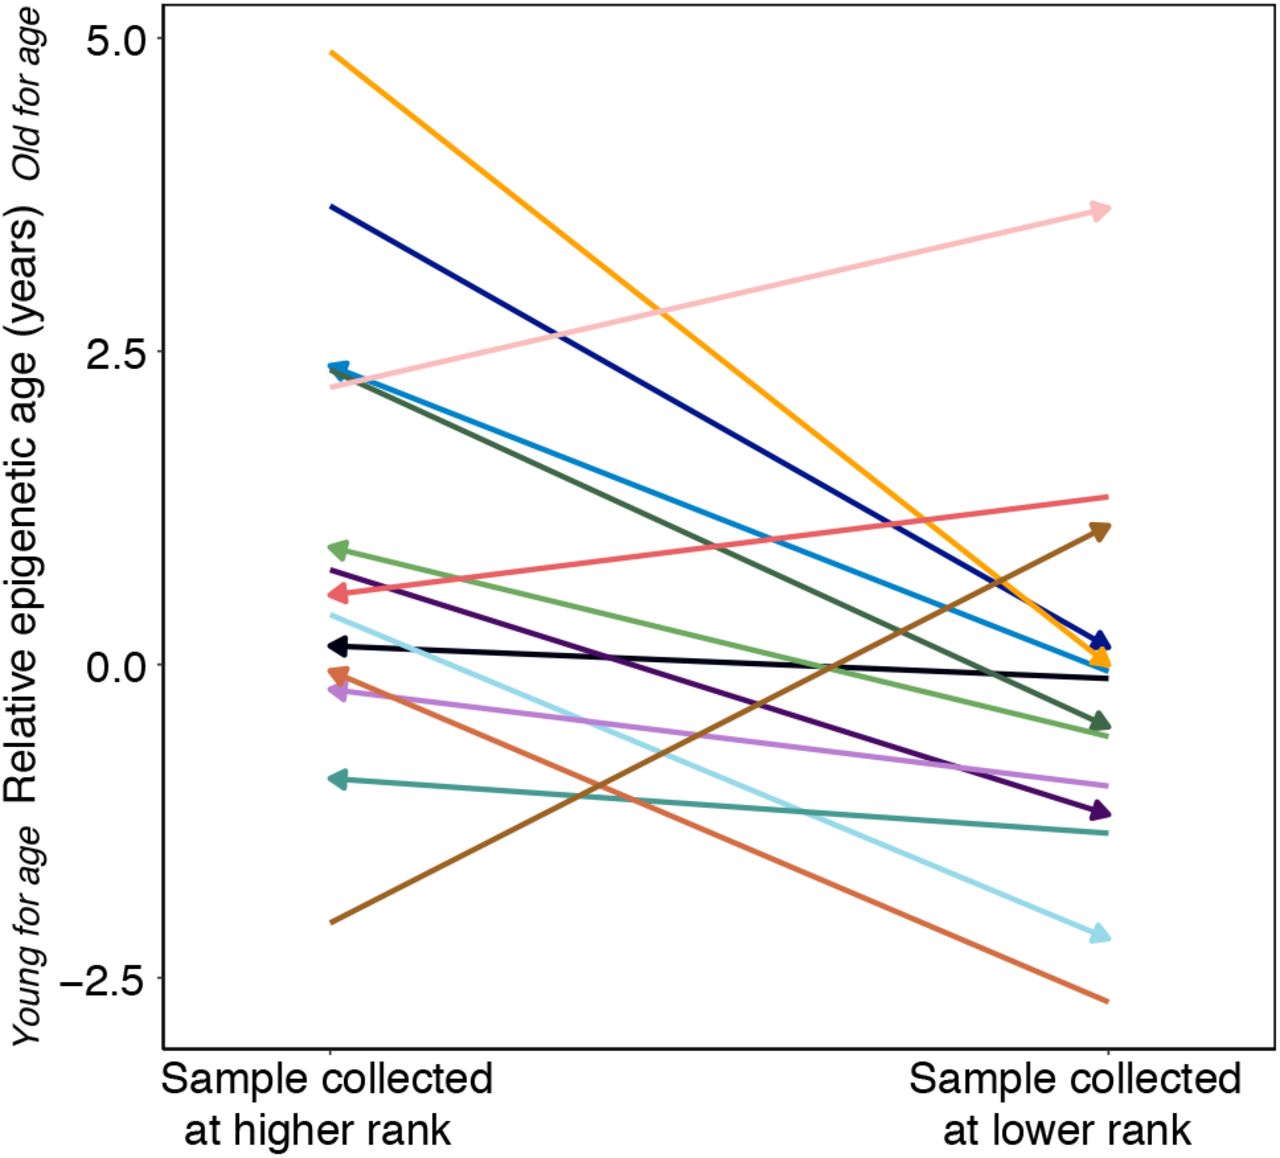
In baboon males, dominance rank reflects physical condition and fighting ability. Rank is therefore dynamic across the life course, such that males in their prime (ages 7 – 12) are most likely to be high-ranking, and the same male is likely to occupy multiple positions in the social hierarchy during his lifetime [14]. If accelerations in epigenetic age are tightly coupled to rank, our results predict that across longitudinally collected samples, a male who becomes higher ranking should look older for age in his second sample relative to first, whereas a male who loses status should look younger for age in his second sample relative to first. To assess this possibility, we calculated the residuals of the best fit line relating chronological age and predicted age (“relative epigenetic age”) for 14 males for whom we had repeated samples collected when they occupied different dominance rank positions (N = 28 samples, 2 per male). In this data set, the sample collected when males were higher status typically predicted higher values of relative epigenetic age compared to the sample collected when they were lower status, consistent with high rank-associated accelerated biological aging (Figure 3; paired t-test, t = −2.31, p = 0.038). For example, in the case of one young adult male who we sampled at rank 18 and then rank 1, as he was first climbing the social hierarchy, the actual time that elapsed between samples was 0.79 years but he exhibited an increase in predicted age of 2.6 years. Moreover, the two males that showed a decrease in predicted age, despite increasing in chronological age (Figure 1D), were among those that experienced the greatest drop in social status between samples. Thus, change in rank between samples for the same male predicted change in Δage, controlling for chronological age (R2 = 0.24, p=0.044). Consistent with our cross-sectional results, we did not observe evidence for a relationship between change in Δage and rank-for-age (R2 = 0.14, p = 0.135).
Relative epigenetic age for males in which multiple samples were collected when they occupied different ordinal rank values. Arrow indicates the temporal direction of rank changes: left-facing arrows represent cases in which the later sample was collected when males were higher-ranking, and right-facing arrows represent cases in the later sample was collected when males were lower-ranking.
Together, our findings indicate that major environmental predictors of lifespan and mortality risk (e.g., social bond strength and early life adversity in this population) do not necessarily predict epigenetic measures of biological age. Although this assumption is widespread in the literature, including for epigenetic clock analyses [34, 35], our results are broadly consistent with empirical results in humans. Specifically, while studies of early life adversity, which also predicts lifespan in human populations, find relatively consistent support for a relationship between early adversity and accelerated epigenetic aging in children and adolescents [36–41], there is little evidence for the long-term effects of early adversity on epigenetic age in adulthood [42–47]. Thus, while DNA methylation may make an important contribution to the biological embedding of early adversity into adulthood [48, 49], it does not seem to do so through affecting the epigenetic clock itself. Social and environmental effects on the clock instead seem to be most influenced by concurrent conditions, lending support to “recency” models for environmental effects on aging that posit that health is more affected by the current environment than past experience [50–52]. Additional longitudinal sampling will be necessary to evaluate whether current conditions alone can explain accelerated epigenetic aging, or whether it also requires integrating the effects of exposures across the life course (the “accumulation” model: [50, 52]). Repeated samples could also help exclude an alternative explanation for our findings: that viability selection against individuals who experienced high early adversity attenuates the true effect of cumulative early adversity on relative epigenetic age.
Finally, our analyses reveal that males who achieve high rank appear epigenetically older than expected given their known chronological age. Although high ranking males also tend to be larger due to increased muscle mass (Pearson’s r between rank and BMI = 0.56, p = 6.38 × 10⁻⁹), we observed an additional, independent effect of age-adjusted BMI: males who had high BMI relative to their age also looked older for age, controlling for rank and age (β = 0.1107, p = 0.006) (Table 1). These two effects suggest that investment in body condition, which is a crucial factor in male competitive ability, incurs other physiological costs that compound to influence biological age. Indeed, previous research on the Amboseli baboons also points to costs of high rank, including high levels of glucocorticoids in alpha males [53], increased expression of genes involved in innate immunity and inflammation [28], and a trend towards elevated mortality risk [54]. These associations may arise because high-ranking males are both more likely to engage in physical conflict with other males, and more likely to spend long periods of time in energetically costly mate-guarding [55, 56]. Alternatively, males who are able to make significant investments in body condition, while tolerating their accompanying costs, may be able to successfully maintain high rank. Importantly, since doing so is likely to contribute to higher lifetime reproductive success for male baboons, the fitness-associated benefits of high rank can exceed the costs, even if accelerated biological aging increases the risk of mortality.
Author Contributions
Conceptualization, R.A.J., J.A.A., J.T., E.A.A., A.J.L.; Investigation, J.A.A., R.A.J., A.J.L., F.A.C., M.Y.A., T.N.V., and J.T.; Formal Analysis, J.A.A. and R.A.J.; Writing—Original Draft, R.A.J., J.A.A., and J.T.; Writing—Reviewing & Editing, R.A.J., J.A.A., A.J.L., T.N.V., M.Y.A., F.A.C., S.C.A., E.A.A., and J.T. Funding Acquisition, J.T., S.C.A., and E.A.A. Supervision, J.T.
Declaration of Interests
The authors declare no competing interests.
STAR Methods
Study population and biological sample collection
This study focused on a longitudinally monitored population of wild baboons (Papio cynocephalus, the yellow baboon, with some admixture from the closely related anubis baboon P. anubis [57, 58]) in the Amboseli ecosystem of Kenya. This population has been continuously monitored by the Amboseli Baboon Research Project (ABRP) since 1971 [6]. For the majority of study subjects (N = 242 of 245 individuals), birth dates were therefore known to within a few days’ error; for the remainder, birth dates were known within 3 months’ error (Table S1).
All DNA methylation data were generated from blood-derived DNA obtained during periodic darting efforts, as detailed in [28, 59, 60]. Samples were obtained under approval from the Institutional Animal Care and Use Committee (IACUC) of Duke University and adhered to all the laws and guidelines of Kenya. In brief, individually recognized study subjects were temporarily anesthetized using a Telazol-loaded dart delivered through a blow gun. Baboons were then safely moved to a new location where blood samples and morphometric data, including body mass and crown-rump length, were collected. Baboons were then allowed to recover from anesthesia in a covered holding cage and released to their group within 2 – 4 hours. Blood samples were stored at −20 C in Kenya until export to the United States.
DNA methylation data
DNA methylation data were generated from blood-extracted DNA collected from known individuals in the Amboseli study population (N = 277 samples from 245 animals; 14 females and 14 males were each sampled twice, and 1 female and 1 male were each sampled three times). Here, we analyzed a combined data set that included previously published reduced representation bisulfite sequencing [61] (RRBS) data from the same population (N = 36) [5] and new RRBS data from 241 additional individuals.
RRBS libraries were constructed following [62], using ~200 ng baboon DNA plus 0.2 ng unmethylated lambda phage DNA per sample as input. Samples were sequenced to a mean depth of 17.8 (± 10.5 s.d.) million reads on either the Illumina HiSeq 2000 or HiSeq 4000 platform (Table S1), with an estimated mean bisulfite conversion efficiency (based on the conversion rate of lambda phage DNA) of 99.8% (minimum = 98.1%). Sequence reads were trimmed with Trim Galore! [63] to remove adapters and low quality sequence (Phred score < 20). Trimmed reads were mapped with BSMAP [64] to the baboon genome (Panu2.0) allowing a 10% mismatch rate to account for the degenerate composition of bisulfite-converted DNA. We used the mapped reads to count the number of methylated and total reads per CpG site, per sample [64, 65]. Following [5, 32], CpG sites were filtered to retain sites with a mean methylation level between 0.1 and 0.9 (i.e., to exclude constitutively hyper- or hypo-methylated sites) and mean coverage ≥5x. We also excluded any CpG sites with missing data for ≥15% of individuals in the sample. After filtering, we retained N = 458,504 CpG sites for downstream analysis. For the remaining missing data (mean number of missing sites per sample = 1.4% ± 3.5% s.d., equivalent to 6,409 ± 16,024 sites), we imputed methylation levels using a k-nearest neighbors approach in the R package impute, using default parameters [66].
Building the epigenetic clock
We used the R package glmnet [67] to build a DNA methylation clock for baboons. Specifically, we fit a linear model in which the predictor variables were normalized levels of DNA methylation at 458,504 candidate clock CpG sites across the genome and the response variable was chronological age. To account for the excess of CpG sites relative to samples, glmnet uses an elastic net penalty to shrink predictor coefficients toward 0 [68]. Optimal alpha parameters were identified by grid searching across a range of alphas from 0 (equivalent to ridge regression) to 1 (equivalent to LASSO) by increments of 0.1. We defined the optimal alpha as the value that maximized R2 between predicted and true chronological age across all samples. We set the regularization parameter lambda to the value that minimized mean-squared error during n-fold internal cross-validation.
To generate predicted age estimates for a given sample, we used a leave-one-out cross-validation approach in which all samples but the “test” sample were included for model training, and the resulting model was used to predict age for the left-out test sample. Importantly, training samples were scaled independently of the test sample in each leave-one-out model to avoid bleed-through of information from the test data into the training data. To do so, we first quantile normalized methylation ratios (the proportion of methylated counts to total counts for each CpG site) within each sample to a standard normal distribution. Training samples were then separated from the test sample and the methylation levels for each CpG site in the training set were quantile normalized across samples to a standard normal distribution. For predicting age in the test sample, we compared the methylation value for each site in the test sample to the empirical cumulative distribution function for the training samples (at the same site) to estimate the quantile in which the training sample methylation ratio fell. The training sample was then assigned the same quantile value from the standard normal distribution using the function qnorm in R.
Comparisons to alternative predictors of aging
To assess the utility of the DNA methylation clock relative to other data types, we compared its predictive accuracy to clocks based on three other age-related phenotypes: tooth wear (percent molar dentine exposure [10]), body condition (body mass index: BMI [8]), and blood cell type composition (blood smear counts and lymphocyte/monocyte proportions from flow cytometry performed on peripheral blood mononuclear cells, as in [28, 69]). Leave-one-out model training and prediction were performed for each data type using linear modeling (i.e., not glmnet, since the number of features was much less than the number of samples in this case). To compare the relative predictive accuracy of each data type, we calculated the R2 between predicted and chronological age, the median absolute difference between predicted and chronological age, and the bias in age predictions (the absolute value of 1-slope of the best fit line between predicted and chronological age) (Figure S2).
Tooth wear
Molar enamel in baboons wears away with age to expose the underlying dentine layer. Percent dentine exposure (PDE) on the molar occlusal surface has been shown to be strongly age-correlated in previous work [10]. To assess its predictive power, we obtained PDE data from tooth casts reported by Galbany and colleagues [10] for the left upper molars (tooth positions M1, M2, M3) and left lower molars (tooth positions M1, M2, M3) for 39 males and 34 females in our data set. For each molar position (M1, M2, M3) within each individual, we calculated PDE as the mean for the upper and lower molars. Because dentine exposure scales quadratically with respect to age [10], we fit age as a function of PDE using the following model:  .
.
Body mass index
For both male and female baboons in Amboseli, body mass increases with age until individuals reach peak size, and then tends to decrease with age as animals lose fat and/or muscle mass [8]. To quantify body condition using body mass, we calculated body mass index (BMI) values for 139 males and 154 females for whom body mass and crown-rump length data were available from periodic darting efforts. We retained only measures taken from animals born into and sampled in wild-feeding study groups, when sex-skin swellings (in females only) that could affect crown-rump length measures were absent. BMI was calculated as mass (kilograms) divided by crown-rump length (meters squared), following [70]. To assess the predictive power of BMI for age, we built sex-specific piecewise-regression models. Breakpoints for the piecewise-regression models (to separate “youthful” versus “aged” animals) were set at 8 years old for males and 10 years old for females, following findings from previous work on body mass in the Amboseli population [8].
Blood cell type composition
The proportions of different cell types in blood change across the life course, including in baboons [9]. We assessed the predictive power of blood cell composition for age using two data sets. First, we used data collected from blood smear counts (N = 134) for five major white blood cell types: basophils, eosinophils, monocytes, lymphocytes, and neutrophils. Second, we used data on the proportional representation of five peripheral blood mononuclear cell (PBMC) subsets: cytotoxic T cells, helper T cells, B cells, monocytes, and natural killer cells, measured using flow cytometry as reported by Lea and colleagues [28] (N = 53). Cell types were included as individual covariates for leave-one-out model training.
Sources of variance in predicted age
We asked whether factors known to be associated with inter-individual variation in fertility or survival also predict inter-individual variation in Δage (predicted age from the epigenetic clock minus known chronological age). To do so, we fit linear models separately for males and females, with Δage as the dependent variable and dominance rank at the time of sampling, cumulative early adversity, relative BMI (corrected for age), and chronological age as predictor variables [20]). For females, we also included a measure of social bond strength to other females as a predictor variable, based on findings that show that socially isolated females experience higher mortality rates in adulthood [22, 71]. Samples with missing values for any of the predictor variables were excluded in the model, resulting in a final analysis set of 66 female samples (from 59 females) and 93 male samples (from 84 males). The chronological ages of samples with complete data relative to samples with missing data were equivalent for females (t-test, t = 1.95, p = 0.053) but were slighly lower for males (t-test, t = −3.04, p = 0.003; mean chronological ages are 7.98 and 9.65 years for complete and missing samples, respectively). Predictor variables were measured as follows.
Dominance rank
Sex-specific dominance hierarchies were constructed monthly for every social group in the study population based on the outcomes of dyadic aggressive encounters. Ordinal dominance ranks were assigned to every adult based on these hierarchies, such that low numbers represent high rank/social status and high numbers represent low rank/social status [72]. Although most analyses of data from the Amboseli baboons have used ordinal ranks as the primary measure of social status, in some analyses proportional rank (i.e., the proportion of same-sex members of an individual’s social group that he or she dominates) has proven to be a stronger predictor of behavioral, life history, or physiological outcomes [73]. In this study, we chose to use ordinal ranks, but proportional and ordinal dominance rank were highly correlated in our dataset (r2=.70, p=1.13 × 10−58). Using proportional rank rather than ordinal rank did not qualitatively affect our analyses. Additionally, to investigate whether the patterns we observed are due to a consistent effect of rank across all ages, or instead an effect of being high or low rank relative to the expected (mean) value for a male’s age, we also calculated a “rank-for-age” value. Rank-for-age is defined as the residuals of a model with dominance rank as the response variable and age and age2 as the predictor variables (Fig S4).
Cumulative early adversity
Previous work in Amboseli defined a cumulative early adversity score as the sum of 6 different adverse conditions that a baboon could experience during early life [20]. This index strongly predicts adult lifespan in female baboons, and a modified version of this index also predicts offspring survival [21]. To maximize the sample size available for analysis, we excluded maternal social connectedness, the source of adversity with the highest frequency of missing data, leaving us with a cumulative early adversity score generated from 5 different binary-coded adverse experiences. These experiences were: (i) early life drought (defined as ≤ 200 mm of rainfall in the first year of life), which is linked to reduced fertility in females [27, 74]; (ii) having a low ranking mother (defined as falling within the lowest quartile of ranks for individuals in the dataset), which predicts rates of maturation [75–77]; (iii) having a close-in-age younger sibling (<1.5 years), which may redirect maternal investment to the sibling [78], (iv) being born into a large social group, which may increase within-group competition for shared resources [27, 77, 79], and (v) maternal death before the age of 4, which results in a loss of both social and nutritional resources [77, 80].
Body mass index
BMI was modeled as the residuals from sex-specific piecewise regression models relating BMI to age. By taking this approach, we asked whether having relatively high BMI for one’s age and sex predicted higher (or lower) Δage.
Social bond strength
For this analysis, we measured female social bond strength to other females using the dyadic sociality index (F-DSI) [54]. We did not include this parameter (male’s social bond strength to females) for the male model, because this measure is unavailable for young males in this dataset. F-DSI was calculated as an individual’s average bond strength with her top three female social partners, in the 365 days prior to the day of sampling, controlling for observer effort. This approach is based on representative interaction sampling of grooming interactions between females, in which observers record all grooming interactions in their line of sight while moving through the group conducting random-ordered, 10-minute long focal animal samples of pre-selected individuals. Because smaller groups receive more observer effort per individual and per dyad (and thus record more grooming interactions per individual or dyad), we estimated observer effort for dyad d in year y as:
 where cd is the number of days the two females in a dyad were coresident in the same social group, sd is the number of focal samples taken during the dyad’s coresidence, and fd is the average number of females in the group during the dyad’s coresidence.
F-DSI for each adult female dyad in each year is the z-scored residual, ε, from the model:
 where Rd,y is the number of grooming interactions for dyad d in year y divided by the number of days that the two individuals were coresident, and Ed,y is observer effort.
Analysis of longitudinal samples
To test whether changes in rank predict changes in relative epigenetic age within individuals, we used data from 5 males from the original dataset and generated additional RRBS data for 9 samples, resulting in a final set of 14 males who each were sampled at least twice in the data set, when they occupied different ordinal ranks (mean years elapsed between samples = 3.92 ± 1.94 s.d.; mean absolute difference in dominance ranks = 6.86 ± 5.07 s.d.). This effort increased our total sample size to N = 286 samples from 248 unique individuals. To incorporate the new samples into our analysis, we reperformed leave-one-out age prediction with N-fold internal cross validation at the optimal alpha selected for the original N = 277 samples (alpha = 0.1). For the 277 samples carried over from the original analysis, we verified that age predictions were nearly identical between the previous analysis and the expanded data set (R2 = 0.98, p = 2.21 × 10−239).
Based on the new age predictions for males in the data set (N = 144), we again calculated relative epigenetic age as the residual of the best fit line relating predicted age to chronological age. We then used the 14 males with repeated DNA methylation profiles and rank measures in this dataset to test whether, within individuals, changes in dominance rank or rank-for-age explained changes in relative epigenetic age between samples.
Epigenetic clock enrichment analyses
To evaluate whether CpG sites included in the epigenetic clock were enriched in functionally important regions of the baboon genome [32, 81], we used two-sided Fisher’s exact tests to investigate enrichment/depletion of the 593 epigenetic clock sites in (i) gene bodies and exons, based on the Ensembl annotation Panu2.0.90; (ii) CpG islands annotated in the UCSC Genome Browser; (iii) CpG shores, defined as the 2,000 basepairs flanking CpG islands (following [32, 81, 82]); and (iv) promoter regions, defined as the 2,000 basepairs upstream of the 5’-most annotated transcription start site for each protein-coding gene (following [32, 81]). We also considered (v) putative enhancer regions, which have not been annotated for the Panu2.0 assembly. We therefore used ENCODE H3K4me1 ChIP-seq data from humans [83] and the liftOver tool to define likely enhancer coordinates in Panu2.0.
We also tested for enrichment of clock sites in regions of the genome that have been identified by previous empirical studies to be of special interest. First, we considered regions that likely have regulatory activity in blood cells, defined as all 200 base-pair windows that showed evidence of enhancer activity in a recently performed massively parallel reporter assay [33]. We used liftOver to identify the inferred homologous Panu2.0 coordinates for these windows, which were originally defined in the human genome.
Second, we defined age-related differentially methylated regions (age DMRs) in the Amboseli baboons based on genomic intervals found, in previous analyses, to contain at least three closely spaced age-associated CpG sites (inter-CpG distance ≤ 1kb), as described in [32]. Third, we defined lipopolysaccharide (LPS) up-regulated and LPS down-regulated genes as those genes that were significantly differentially expressed (1% false discovery rate) between unstimulated Amboseli baboon white blood cells and LPS-stimulated cells from the same individual, following 10 hours of culture in parallel [28].
Data and code availabity
All sequencing data generated during this study are available in the NCBI Sequence Read Archive (project accession PRJNA607996).
Acknowledgements
We gratefully acknowledge the support provided by the National Science Foundation and the National Institutes of Health for the majority of the data represented here, currently through NSF IOS 1456832, NIH R01AG053308, R01AG053330, R01HD088558, and P01AG031719. R.A.J. is supported by NIH F32HD095616 and J.A.A. by NSF #2018264636. We thank the members of the Amboseli Baboon Research Project for collecting the data presented here, especially J. Altmann for her foundational role in establishing the study population and these data sets; J. Gordon, N. Learn, and K. Pinc for managing the database; R.S. Mututua, S. Sayialel, and J.K. Warutere for data collection in the field; and T. Wango and V. Oudu for their assistance in Nairobi. We also thank the Kenya Wildlife Service, University of Nairobi, the Institute of Primate Research, the National Museums of Kenya, the National Council for Science, Technology, and Innovation, members of the Amboseli-Longido pastoralist communities, the Enduimet Wildlife Management Area, Ker & Downey Safaris, Air Kenya, and Safarilink for their assistance in Kenya. Finally, we thank current and past members of the Tung, Alberts, Archie, and Altmann labs for their helpful feedback. This research was approved by IACUCs at Duke University, University of Notre Dame, and Princeton University and adhered to all the laws and guidelines of Kenya. For a complete set of acknowledgments of funding sources, logistical assistance, and data collection and management, please visit http://amboselibaboons.nd.edu/acknowledgements/.
References
- 1.↵
- 2.↵
- 3.↵
- 4.↵
- 5.↵
- 6.↵
- 7.↵
- 8.↵
- 9.↵
- 10.↵
- 11.↵
- 12.↵
- 13.
- 14.↵
- 15.↵
- 16.
- 17.↵
- 18.↵
- 19.↵
- 20.↵
- 21.↵
- 22.↵
- 23.
- 24.↵
- 25.↵
- 26.
- 27.↵
- 28.↵
- 29.↵
- 30.
- 31.↵
- 32.↵
- 33.↵
- 34.↵
- 35.↵
- 36.↵
- 37.
- 38.
- 39.
- 40.
- 41.↵
- 42.↵
- 43.
- 44.
- 45.
- 46.
- 47.↵
- 48.↵
- 49.↵
- 50.↵
- 51.
- 52.↵
- 53.↵
- 54.↵
- 55.↵
- 56.↵
- 57.↵
- 58.↵
- 59.↵
- 60.↵
- 61.↵
- 62.↵
- 63.↵
- 64.↵
- 65.↵
- 66.↵
- 67.↵
- 68.↵
- 69.↵
- 70.↵
- 71.↵
- 72.↵
- 73.↵
- 74.↵
- 75.↵
- 76.
- 77.↵
- 78.↵
- 79.↵
- 80.↵
- 81.↵
- 82.↵
- 83.↵


