

Abstract
Recent methods enable simultaneous measurement of protein expression with the transcriptome in single cells by combining protein labeling with DNA barcoded antibodies followed by droplet based single cell capture and sequencing (e.g. CITE-seq). While data normalization and denoising have received considerable attention for single cell RNA-seq data, such methods for protein data have been less explored. Here we showed that a major source of noise in CITE-seq data originated from unbound antibody encapsulated in droplets. We also found that the counts of isotype controls and those of the “negative” population inferred from all protein counts of each cell are significantly correlated, suggesting that their covariation likely reflects cell-to-cell differences due to technical factors such as non-specific antibody binding and droplet-to-droplet differences in capture efficiency of the DNA tags. Motivated by these observations, we developed a normalization method for CITE-seq protein expression data called Denoised and Scaled by Background (DSB). DSB corrects for 1) protein-specific background noise as reflected by empty droplets, 2) the technical cell-to-cell variation as captured by the latent noise component described above. DSB normalization improves separation between positive and negative populations for each protein, centers the negative-staining population around zero, and can improve unbiased protein expression-based clustering. DSB is available through the open source R package “DSB” via a single function call and can be readily integrated with existing single cell analysis workflows, including those in Bioconductor and Seurat.
Introduction
Cell surface proteins are often used to define the many heterogeneous cell types in multicellular organisms, especially those comprising the immune system. Developments in multi-parameter cytometry have made it possible to measure over 50 epitopes on the same cell1. More recently, two groups used DNA barcoded antibodies to simultaneous profile surface proteins with the transcriptome in single cells.2,3 We recently adopted this approach to profile 82 proteins and the transcriptome in single cells in a human cohort4, which is used here to assess and develop a method for protein data normalization. Sequencing based assessment of protein expression lacks spectral interference, thus allowing potential measurement of hundreds of protein epitopes on the same cells. This enhances our ability to define cell types and states and interpret single cell transcriptomic data. While data normalization and denoising have received considerable attention for single cell RNA-seq data, methods for processing and normalizing single cell protein droplet capture data are in their infancy. CITE-seq protein data are non-sparse (in contrast to mRNAs), discrete counts; this creates normalization challenges distinct from continuous fluorescence or time of flight cytometry data as well as single cell mRNA sequencing data.
In our analysis of CITE-seq data we noticed non-zero background noise for proteins expected to be negative in certain cell types, consistent with the observation reported in the original CITE-seq publication3. By comparing unstained control cells with empty droplets, we found that ambient, unbound antibody within droplets as a major source of this background. We further found that the counts of isotype controls and those of “negative” markers for each cell are significantly correlated, pointing to systematic technical differences in global antibody tag levels per droplet. These may reflect technical factors including per-droplet differences in oligo tag capture efficiency and cell-specific differences in non-specific antibody staining (together referred to as “technical component” hereafter for brevity). Motivated by these observations, we developed an easy-to-use open source R package specifically to normalize CITE-seq protein expression data in single cells by accounting for both the ambient antibody and technical component of per-cell variation in protein counts.
Results
I. Assessing unstained cells and empty droplets revealed that unbound antibodies are a major source of background noise
To investigate the origin of the background protein counts in CITE-seq data, we took advantage of the unstained cells we included in an experiment measuring, in total, more than 50,000 Peripheral Mononuclear Cells (PBMCs) from 20 human donors4. The PBMCs were stained with an 86 CITE-seq antibody cocktail (including four isotype controls; Totalseq-A reagents, Biolegend). We noticed positive counts for each antibody within droplets containing unstained control cells. Unlike flow cytometry, where cellular autofluorescence is a major source of background, potential sources of background in cells not expressing the target proteins in CITE-seq data may reflect both non-specific binding and unbound antibodies captured in droplets, reminiscent of cell-free RNA observed in droplet-based single cell RNAseq5. Droplet capture technologies use Poisson distributed cell loading that naturally results in thousands of empty droplets (those without cell barcodes) containing unbound antibodies that are then sequenced with the rest of the library. If a major contributor to background noise is ambient antibody, we reasoned that empty droplets would have similar background levels as droplets capturing unstained control cells. Indeed, we found that the median log count of proteins in empty droplets and unstained control cells are highly concordant (Fig 1A), thus protein counts in empty droplets provide a direct measurement of the ambient background for each protein without the need for unstained control cells, similar to methods that quantify noise with ERCC spike-ins6 or account for ambient mRNA in empty droplets5.
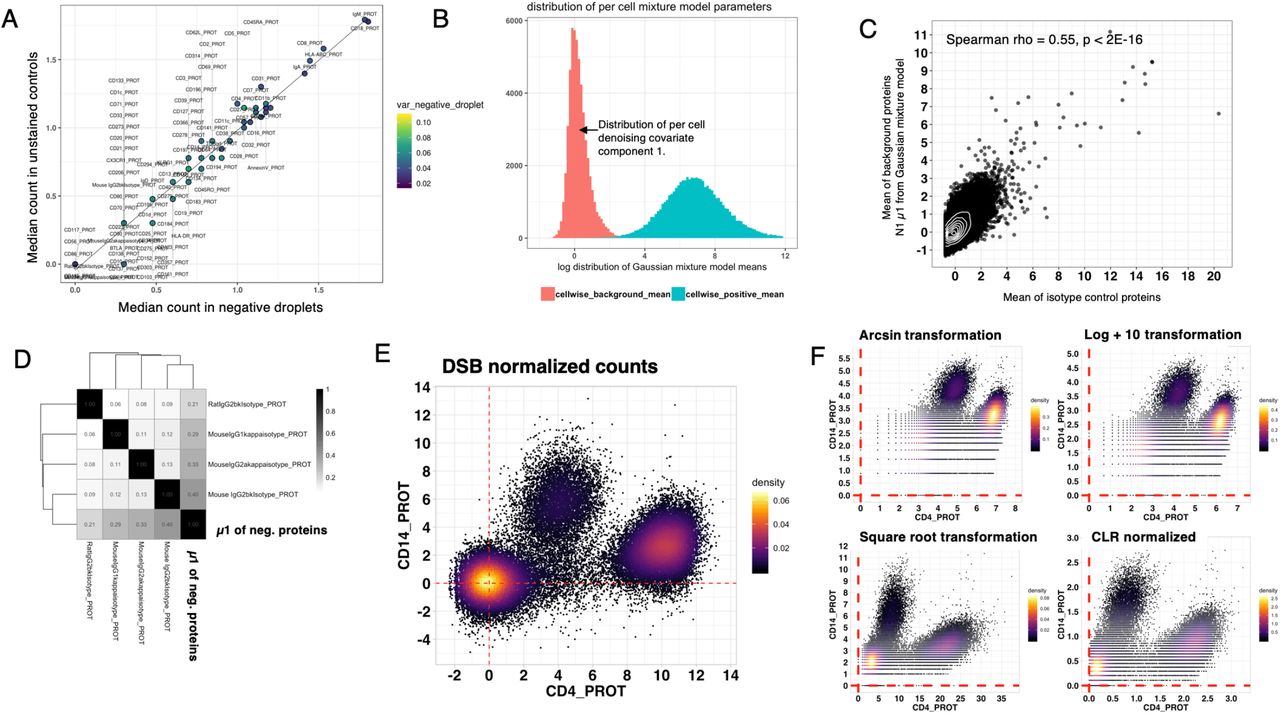
A. Concordance between two potential sources of experimental noise measurements: a scatter plot of the average protein count of unstained control cells spiked into the stained cell pool (y-axis) versus that of empty droplets (x-axis) without a cell. The counts were first transformed by ln(count+10) before the means shown are computed. The proteins are colored by their variance across negative droplets. B. A Gaussian mixture model with two subpopulations was fitted to the counts (inclusive of all proteins/antibodies) of each single cell and here the distribution of the two subpopulation means across single cells are shown. The first mean, for the distribution shown in red, can be used alone or combined with isotype controls to infer a latent variable (the first principle component) to form a per-cell denoising factor to normalize technical variations across single cells. C. A scatter density plot between the mean of the “negative” subpopulation from the per-cell Gaussian mixture model (red in Fig 1B) versus the mean of the four isotype controls across single cells. D. The correlation structure between the Gaussian mixture negative population mean and each of the isotype controls across single cells (Spearman correlation is shown.) E-F. biaxial plots of CD4 and CD14 in single cells normalized by the DSB transformation (E), or other transformations that have been used for single cell data (e.g., flow cytometry and CyTOF), including the CLR transformation reported in the original CITE-seq publication (F).
II. Assessing technical cell-to-cell variation: counts of isotype controls and those of ‘negative’ protein markers are correlated
Droplet based single-cell sequencing approaches generally yield a wide range of counts-per-cell due to both biological (e.g., cell size) and technical variation attributed to, for example, per-droplet differences in oligo tag capture, cell lysis, and reverse transcriptase efficiency. Single cell mRNA data are thus often normalized to account for these technical factors. However, these existing approaches designed for mRNA data may not be appropriate for protein data. For example, cells can differ substantially in physical size (e.g., naïve vs. activated lymphocytes) and thus the total protein counts across cells are expected to differ; the relative protein levels can also span more than six orders of magnitude7. Importantly, typically only a small fraction of unique proteins is measured compared to transcriptome wide sequencing and thus total read counts across proteins can depend on the protein panel and cannot be expected to be the same across cells. However, we reasoned that for each single cell, the protein counts for markers that are not expressed could serve as a readout of the technical component and thus be utilized in a more conservative correction for non-biological differences across cells. Unless all protein targets included in the experiment are ubiquitously expressed on all the cells, each cell should exhibit a bimodal count distribution across all proteins – while this may depend on the types of sample being profiled and the antibody panel used, it is a reasonable assumption for samples with heterogeneous cell types/populations (e.g., PBMCs) stained with an antibody panel targeting a reasonably large number of proteins. To test this idea using our data, we fitted a Gaussian mixture model with two subpopulations (representing the negative and positive protein counts) to each cell’s protein counts after correcting for the ambient noise we identified above (see also below). We found a clear separation between positive and negative/background means as well as variation in the background means across single cells (Fig 1B).
To assess the possibility that the inferred background might track each cell’s technical component of variation, we took advantage of the four isotype controls in our antibody panel and found that the per-cell isotype control counts are correlated with the mean of the per-cell background counts estimated above by the mixture model across single cells (Fig 1C, Spearman rho = 0.55, p < 2E-16). These observations suggest that the shared variation captured by the five per-cell variables (the four isotype control antibodies and fitted negative subpopulation mean) captured technical variability that should be normalized across single cells. The correlation among these variables (Fig 1D) motivated the approach below in which a single latent factor was derived from these five variables for cell-to-cell normalization.
III. The denoised scaled by background normalization
Based on the above observations, we developed a two-step normalization method for protein counts in CITE-seq data. We compute the Denoised Scaled by Background (DSB) normalized counts for each cell as follows:
First, we quantify the ambient noise level of each protein using the empty droplets and rescale the counts in each of the droplets containing single cells via:

Where xi is the count for protein Y in cell i (by default log denotes the natural log – other bases such as 2 can also be used for convenience), P is a pseudocount (set to 10 currently) added to prevent taking the log of zero and to stabilize the variance of small counts, and μn and σn are the mean and standard deviation of negative (empty) droplets for protein Y, respectively, and they are computed in the same way in natural log space with pseudocount P added. The above transformed expression estimate (Y) for each protein corresponds to the number of standard deviations from the mean of the negative control counts and is thus straightforward to interpret. This transformation can also help center the apparent background population of a protein around zero (Fig S1B, S1D). In addition, in ref. 4 we implemented this transformation on each staining batch separately to accommodate potential batch specific ambient noise-this helped mitigate batch-to-batch variation4 (Fig S1A). The value of P can be empirically chosen; we empirically found a value of 10 to provide good clustering performance and visualization of CITE-seq data.

A. UMAP plot as shown in Fig 2A labeled by experimental batch. B. distribution of DSB normalized CD4 counts across all cells. C. CLR transformed protein counts (without applying the human specific threshold set based on mouse cells) for cells in cluster 1 (see Figs 2A,C) D. Same as (C) but for DSB normalized counts.
Second, we denoise each cell to account for the technical component. In this optional but recommended step, we first fit a Gaussian mixture model to the transformed count of each cell from step 1 with k = 2 mixture components:

This model yields μ1, the mean of the background count population in each cell (red distribution in Fig 1B). Given the significant correlation we observed between the isotype controls and the inferred background counts (Fig 1C–D), we reasoned that the primary latent component (i.e., principle component 1) capturing the shared co-variation of these five variables can help quantify the technical component and overcome the noise in individual variables. We thus define the per-cell background technical noise as the eigenvector λi through μ1 and the isotype control counts in each cell i. If users do not include isotype controls in their experiment, the background for each cell inferred by the Gaussian mixture model can be used alone, with the assumption that each cell would be negative for a subset of proteins in the antibody panel. Thus, including isotype controls can mitigate noise and potential biases inherent in this assumption.
Based on empirical assessment of canonical human immune cell surface markers, the DSB method shows improved signal-to-noise compared to several standard transformations (Figs 1E–F, S1C–D, S2) and can increase the separation between negative and positive populations (Figs 1E and S1B).

A. Biaxial gating strategy for canonical monocyte subsets with the DSB normalized values. B. The corresponding plots with CLR transformed protein counts. Cells are not hexagonal binned or transformed except for using the normalization methods indicated. The color of the points represents density. No “jitter” was added to plots and the values shown on each axis are the same as those used in the unbiased protein-based clustering result shown in Fig 2.
IV. DSB normalization improves interpretation of high dimensional protein clusters
While increased separation in positive and negative populations after DSB normalization can facilitate more robust manual gating (Fig S2), a major motivation for using CITE-seq is to take advantage of all proteins to perform unbiased high-dimensional cell clustering. DSB normalized protein expression separated cells into clusters that were delineated by major lineage defining protein markers (Fig 2A–B). When examining individual clusters, we found it useful to compare the protein distribution of empty droplets to the cells in a given cluster to visually assess the relative contribution of the ambient counts. For example, with a log transformation alone, cells in cluster 1 from Fig 2A have relatively high values for proteins such as IgA, IgM, and CD57, yet these proteins have counts at similar levels in empty droplets (they have high values but small residuals along the diagonal identity line when plotting against empty droplets (Fig 2C)). After DSB normalization, by design, these proteins with high counts in the empty droplets were corrected to levels near or below zero (Fig 2D, red proteins), whereas certain lineage-defining markers, such as CD16, CD244, and CD56, have high DSB values (e.g., more than 8 standard deviations from the mean of empty droplets [+/− the small technical factor correction applied during denoising]). This cluster is thus consistent with the known surface protein expression phenotype of NK cells, which do not express typical B-cell markers such as IgM or IgA. Without accounting for the ambient background, these cells might be misannotated as CD57+ NK cells even though CD57 did not deviate significantly from the expected noise level according to DSB normalization (see CD57 in Fig 2C–D, Fig S1 C–D).

A. A UMAP visualization of clusters of single cells color labeled by the cluster number. Cells were clustered using a distance matrix derived from protein expression normalized by the DSB method (Seurat clustering parameters: resolution 3.0, k = 50). UMAP parameters: min.dist = 0.6, n_neighbors = 35. B. Distribution of a subset of lineage defining markers labeled by DSB counts – each protein is visualized on the same continuous normalized DSB scale, illustrating the quantitative nature of the DSB normalized units interpreted as the number of standard deviations from the mean of the empty droplets. C. The median count (in natural-log (count+1) space without DSB transformation) of each protein in cells from cluster 1 in (A) are plotted versus that of from the empty droplets; proteins along the diagonal (identity line) have non-zero counts, but are not significantly greater than the corresponding counts in the empty droplets. D. Similar to C, but the y axis is showing the DSB normalized counts (in natural log +10 space); proteins in red are corrected to levels around zero reflecting their concordance with mean counts in the empty droplets. Note that to compare DSB to the simple log transformation, here a pseudocount of 1 was added before natural log transformation to avoid the log of zero. Other pseudocounts can also be used.
Discussion
Here we experimentally revealed two types of protein expression noise in CITE-seq data and developed a simple method to correct them: 1) protein-specific ambient background captured by empty droplets or unstained cells; 2) technical factor reflected by shared signal between droplet/cell-specific background and isotype controls. Our normalization method allows quantification of protein expression above background levels in single cells, which in turn enables more accurate assessment of cell types and states.
Two recent publications used negative binomial8 and Gaussian mixture9 models to identify protein-specific negative “noise” populations. These mixture models were fitted to the counts for each protein, while we used empty droplets to account for protein-specific background and mixture models to fit counts from all proteins within each droplet/cell to infer the technical component reflective of library size (Figs 1B–C). Another recent method defined protein expression as a mixture of biological cell state-dependent foreground and noise-associated background10. It uses variational inference to learn the parameters of a probabilistic model that incorporates both latent cell-state variables and noise/technical factors. For example, it also revealed a trimodal CD4 distribution as we reported here (Fig S1B). It leverages information from both mRNA and protein counts and is thus distinct from our simpler protein-centric approach. Extending our approach to use both mRNA and protein data is of interest for future development; it would be interesting to compare normalization/denoising using protein only versus using both protein and mRNA in future studies. However, our normalization method is compatible with joint analysis of protein and mRNA: e.g., DSB can provide protein-level normalization before downstream integration with mRNA data. Protein-centric high-dimensional cell population identification followed by assessing mRNA profile/state within individual cell clusters provides a complementary approach. For example, we had performed such analyses to dissect the cellular origin and circuitries behind predictive immune signatures in humans4. Clusters of immune cells defined by protein expression are often interpretable by using knowledge accumulated from years of efforts in studying such cells11 using surface protein markers.
One important caveat of the DSB method is that the inferred technical component (step 2 of our approach) used for denoising may encompass signal from non-specific binding to Fc receptor on the cell surface. Thus, cell types with higher Fc receptor expression may on average receive more correction than cells with lower Fc receptor expression. In peripheral blood samples such as those examined here, DSB can render monocytes, which have higher levels of Fc receptor expression, with lower relative protein expression. Since the overall technical factor correction is small and does not solely rely on signal from isotype controls, however, empirically we have not found this to have adverse effects on downstream analysis such as cell type identification. A future extension of our method could account explicitly for Fc receptor differences.
The developers of CITE-seq also noted distinct background noise for each protein3. They attributed the observed background to non-specific antibody binding and accounted for it in their experiments and statistical analysis. By spiking in mouse cells in their human study, they set a human-specific threshold for each protein after CLR transformation, defined as one standard deviation from the mean CLR value of the mouse cells (see Fig S5A in ref. 3). This species-based thresholding method helped to remove signal from non-specific binding and enabled delineation of canonical immune cell populations. However, measurement of cells from multiple species can entail more complex experimental designs and some cross-species antibody reactivity is expected, the extent of which can depend on the antibody panel. The DSB method may eliminate the need for external cross-species controls. However, it remains to be determined whether there are additional major sources of background noise not captured by the empty droplets and the technical factor we inferred here.
Our method is implemented in an open source R package “dsb” with a single function call operating on a cell by protein count matrix. The output can be integrated with diverse single cell RNA-seq software workflows, including those available through Bioconductor12 or Seurat13 (see vignettes in package documentation).
Methods
CITE-seq data
The CITE-seq data used here is reported in ref. 4, in which the data were generated to assess the cellular origin and circuitry of baseline signatures predictive of vaccination responses; the DSB method was used therein to normalize the protein data4. See the “Methods” section in ref. 4 for experimental details on data generation.
Bioinformatic pipeline and normalization
We used CITE-seq Count14 for HTO and ADT read mapping and Cellranger for UMI mapping. We demultiplexed cells as previously described4,15,16. UMAP17 plots were generated with config parameter n.neighbors = 35, min.dist = 0.6. Clustering was performed using Seurat (resolution 3.0, k = 50) directly on a distance matrix formed on the protein vs cells data matrix of CITE-seq proteins (without isotype controls) after normalizing with the DSB method. In equation II, the model parameters (the mixing parameter, mean and variance of each Gaussian distribution) were fitted with the mclust package18. In future versions, we will also incorporate checking the quality of this fit to flag cells with poor separation of negative and positive distributions. The technical factor was accounted for per cell as a covariate with the removeBatchEffect function in limma19. All analysis was performed with R version 3.5.
Code availability
Open source R software implementing the DSB method can be downloaded from the repository below including relevant package documentation and vignettes for usage and integration with Seurat: https://mattpm.github.io/dsb/
Data availability
The data can be found in the figshare repository of ref. 4: https://doi.org/10.1038/s41591-020-0769-8
Acknowledgements
This work was funded by the intramural research program of NIH, NIAID. The authors thank Can Liu for testing the DSB package and Yuri Kotliarov for helpful discussions related to this work.
References


