

ABSTRACT
A remarkable feature of the microtubule cytoskeleton is co-existence of distinct populations having different dynamic properties. A prominent example is the anaphase spindle, where stable antiparallel bundles exist alongside dynamic microtubules and provide spatial cues for cytokinesis. How are dynamics of spatially proximal arrays differentially regulated? We reconstitute a minimal system of three midzone proteins: the microtubule-cross-linker PRC1, and its interactors CLASP1 and Kif4A, proteins that promote and suppress microtubule elongation, respectively. We find their collective activity promotes elongation of single microtubules, while simultaneously stalling polymerization of cross-linked bundles. This striking differentiation arises from (i) higher activity of CLASP1 despite lower microtubule occupancy than Kif4A, (ii) amplification of Kif4A activity on microtubule bundles through stronger PRC1-affinity. In contrast to canonical mechanisms where antagonistic regulators set microtubule lengths of single arrays, our findings illuminate design principles by which their collective activity instead creates microenvironments comprised of arrays with distinct dynamic properties.
INTRODUCTION
Microtubules form the backbone of micron-sized structures such as mitotic spindles, ciliary axonemes, plant cortical arrays and neuronal axons. A remarkable feature of these structures is the co-existence of microtubule sub-populations with distinct dynamic properties, each tuned to specific functions1–3. For instance, neuronal axons contain long stable microtubules that form tracks for intra-cellular transport and exist alongside short dynamic microtubules that serve as microtubule seeds and sources of tubulin4. In the plant cortex, microtubule bundles are organized into stable arrays that specify the axis of cell elongation2,5. However, the simultaneous presence of dynamic microtubules in the cortex is important in reorienting arrays in response to environmental signals. How the dynamics of distinct microtubule populations present in close proximity are differentially regulated is a fundamental question.
Differential regulation of dynamics is prominent among the various sub-structures of the mitotic spindle such as interpolar, midzone, astral and kinetochore microtubules6–9. During the metaphase to anaphase transition, spindle microtubules are reorganized to form a cross-linked, antiparallel array at the cell center known as the spindle midzone10. This structure keeps separating chromosomes apart and provides positional cues for cell cleavage. Antiparallel microtubule arrays at the cell center are characterized by their stability which manifests as a resistance to microtubule-destabilizing agents, and low tubulin turnover frequencies11,12. However, the transition to anaphase is accompanied by the nucleation and polymerization of new microtubules in the inter-polar region of the cell, and consequently, the cell center also contains single microtubules that are dynamic13–15. How newly nucleated microtubules continue to grow while the cross-linked bundles present alongside them are largely stabilized is unclear.
The dynamics of microtubule populations at the spindle midzone are regulated by several Microtubule Associated Proteins (MAPs). In particular, the localization of three classes of MAPs to the cell center is conserved: (i) cross-linkers of antiparallel microtubules such as Protein Regulator of Cytokinesis-1 (PRC1)16–20 (ii) suppressors of microtubule growth such as kinesins Kif4A or Kip3p21–23, and (iii) growth promoters, which are most often homologues of mammalian CLASP124–26. In this study, we focus on the collective activity of the mammalian PRC1-Kif4A-CLASP1 module in regulating the dynamics of different microtubule sub-populations.
PRC1 is a conserved non-motor MAP that specifically cross-links microtubules in an antiparallel orientation27,28. PRC1 directly binds to and recruits other proteins to the cell center, including CLASP1, a non-motor MAP whose activity as a rescue factor promotes microtubule elongation, and Kif4A, a kinesin that suppresses microtubule growth and depolymerization29–32. During anaphase, CLASP1 activity contributes to initiating the assembly of microtubules in the central spindle, and is important for their growth and stability25,26,33. A loss of CLASP1 results in aberrant spindle midzone structures characterized by depolymerization of microtubules, monopolar spindles and decreased inter-polar spindle lengths24,34.In contrast to CLASP1 depletion, Kif4A-knockout cells are characterized by spindle midzones of larger widths21,29. In vitro, CLASP1 and Kif4A can each autonomously bind microtubules and regulate dynamics to produce opposite effects. While CLASP1 is a strong rescue factor whose activity causes an increase in the lengths of dynamic microtubules, Kif4A has been shown to quell dynamics, thereby suppressing microtubule growth 35–41. Additionally, the PRC1-Kif4A module can slide microtubules, resulting in the reduction of the overlap length between cross-linked microtubules42,43. The regulation of microtubule dynamics by the collective activity of the antagonistic regulators CLASP1 and Kif4A activity has not been studied either in the context of single microtubules or antiparallel bundles.
A largely unexplored question in regulating the architecture of complex microtubule networks with different subpopulations such as the spindle midzone, is the following: how can the dynamics of distinct spatially proximal microtubule arrays be differentially regulated? An intuitive mechanism of achieving differential regulation of microtubule sub-populations is to spatially segregate MAPs and confine their activity to only one subset of microtubules44. However, at the cell center, the presence of dynamic microtubule tips and stable overlaps within 0.6-0.7 μm of each other poses a big challenge to sequestering MAPs on a single population15. This is particularly difficult as microtubule-MAP interactions are typically characterized by moderate binding affinities in the micromolar concentration range. Moreover, this strategy does not permit individual arrays to switch between stable and dynamic states. An alternate mechanism that would allow for such switching is to modulate MAP activity on specific arrays through post-translational modifications. However, when MAPs are present at high cytosolic concentrations and turnover rapidly between microtubule-bound and soluble fractions, it is challenging to regulate only a subset of MAP molecules through post translational modifications. Overall, it is unclear if the dynamics of proximal microtubule arrays can be differentially regulated simply by the collective activity of a set of MAPs in the absence of external factors such as regulatory proteins. Further, it is not known how they can do so in a manner that allows individual arrays to switch between dynamic states, which would be essential in forming large adaptive microtubule networks such as those in the spindle.
We performed in vitro reconstitutions to probe the collective activity of human PRC1-Kif4A-CLASP1 protein module on single and cross-linked microtubules that exist in close proximity. We find that this minimal module exhibits differential regulation of different microtubule sub-populations, such that it promotes the elongation of single microtubules, while simultaneously suppressing the growth of cross-linked microtubules. Further, the two microtubule populations switch between phases characterized by either continuous elongation or no growth at starkly different Kif4A:CLASP1 concentration ratios. Quantitative analyses of protein-protein interactions unexpectedly reveal that a reciprocal activity and occupancy relationship of microtubule-bound Kif4A and CLASP1 underlie this differentiation. Our findings illuminate the design principles underlying differential regulation of proximal microtubule arrays by the collective activity of MAPs that have antagonistic effects on microtubule dynamics.
RESULTS
CLASP1 activity is dominant over Kif4A in regulating the lengths of single microtubules
We first determined the collective effect of Kif4A and CLASP1 on the length-regulation of single microtubules, in the absence of PRC1. Recombinant CLASP1-GFP and Kif4A were purified from SF9 insect cells (Supplementary Fig. 1a). Kif4A is a well characterized dimer but the oligomerization state of CLASP1 is less well characterized41,45. While we were not able to perform SEC-MALS (Size Exclusion Chromatography coupled with Multi-Angle Light Scattering) on full length CLASP1, analysis of three recombinant constructs that included different subsets of CLASP1 domains (1-654, 654-1471 and 805-1471) tagged with GFP showed that they are all monomeric in solution (Supplementary Fig. 1b). Dynamic light scattering studies indicated the CLASP1(805-1471)-GFP protein had low polydispersity and was elongated in shape, thus accounting for the early elution of the protein from SEC columns (Supplementary Fig. 1c). Since none of the domains formed dimers in solution, full-length CLASP1 is likely to be a monomer in solution. The dynamics of single microtubules in the presence of full-length CLASP1 and Kif4A was visualized using multi-wavelength TIRF microscopy. Briefly, HiLyte647-labeled GMPCPP-bound microtubule seeds were immobilized on a glass coverslip, and microtubule polymerization was initiated by the addition of X-Rhodamine-labeled tubulin, GTP and ATP (Fig. 1a). In controls with tubulin alone, microtubules exhibited dynamic instability with multiple growth and depolymerization events as expected (Fig. 1b). Under these conditions, rescue events were rare, and most catastrophe events result in depolymerization of the microtubule back to the seed (hereafter, these events are referred to as “complete catastrophe”). In experiments with 200 nM CLASP1-GFP alone, a dramatic reduction of complete catastrophes was observed (Fig. 1b). With 1000nM Kif4A alone, we saw a striking reduction in microtubule growth from seeds and an increase in duration of pauses where no polymerization was recorded, consistent with the known activities of these proteins (Fig. 1b).

Also see Supplementary Fig. 1
a. Schematic of the dynamic microtubule assay used to examine the collective activity of Kif4A and CLASP1 on single microtubules. HiLyte 647 labeled seeds (blue) were immobilized on glass coverslips via a neutravidin-biotin linkage. The seeds were incubated with X-Rhodamine labeled tubulin, CLASP1-GFP and Kif4A and imaged for 20 minutes. Polarity of microtubules are indicated as + and −.
b. Representative kymographs of X-rhodamine-microtubules in the presence of Kif4A and CLASP1-GFP. GMPCPP-seeds are not shown. → indicates growth event and direction of growth. Curved arrow indicates a catastrophe event. * indicates a rescue event on the microtubule. | indicates a period of stalled growth (‘pause’) on the microtubule. Concentrations correspond to dimeric Kif4A and monomeric CLASP1-GFP. Scale bar represents 2 μm.
c. Histogram of growth rates for each condition seen in (b).
d. Scatter plot of average instantaneous microtubule growth rate in the presence of 200 nM CLASP1-GFP and various Kif4A concentrations as indicated. Concentrations correspond to dimeric Kif4A and monomeric CLASP1-GFP. Error bars indicate standard deviation. Assay conditions: tubulin control (16.4 ± 2.6 nm/s, n = 58), 200 nM CLASP1 (12.4 ± 2.2 nm/s, n = 66), 200 nM CLASP1 + 125 nM Kif4A (6.9 ± 2.8 nm/s, n = 67), 200 nM CLASP1 + 250 nM Kif4A (5.7 ± 2.6 nm/s, n = 73), 200 nM CLASP1 + 1000 nM Kif4A (3.7 ± 3.7 nm/s, n = 73) and 1000 nM Kif4A (0.3 ± 0.8 nm/s, n = 38). P < 0.05 for each column when compared to control with tubulin alone.
e. Box and whisker plot of maximum microtubule length in the presence of 200 nM CLASP1-GFP and various Kif4A concentrations as indicated. Concentrations correspond to dimeric Kif4A and monomeric CLASP1-GFP. Horizontal lines within box indicate the 25th, median and 75th percentile. Plus-sign indicates mean. Error bars indicate minimum and maximum range. Mean and standard deviation for assay conditions with tubulin alone (6.0 ± 2.9 μm, n = 60), 200 nM CLASP1 (12.1 ± 3.2 μm, n = 68), 200 nM CLASP1 + 125 nM Kif4A (7.0 ± 2.3 μm, n = 67), 200 nM CLASP1 + 250 nM Kif4A (5.4 ± 2.1 μm, n = 72), 200 nM CLASP1 + 1000 nM Kif4A (2.2 ± 1.4 μm, n = 74) and 1000 nM Kif4A (0.6 ± 0.5 μm, n = 40). P < 0.05 for 1000 nM Kif4A when compared to the tubulin control.
f. Scatter plot of GFP intensity per pixel on taxol-stabilized microtubules in the presence of Kif4A-GFP  or CLASP1-GFP
  . Error bars represent standard deviation. All concentrations refer to monomeric proteins, to enable comparison between GFP intensities of CLASP1-GFP and Kif4A-GFP. Inset shows magnified region containing intensities for CLASP1-GFP
 . Mean and standard deviation of intensities for assay conditions with CLASP1-GFP: 8 nM (26.9 ±18, n=70), 40 nM (95.3 ± 41.8, n=70), 60 nM (109 ± 30.0, n=70), 80 nM (400.1 ± 166.9, n=70), 160 nM (397.6 ± 90.3, n=70), 400 nM (754.5 ± 154.3, n=70), 800 nM (854.3 ± 122.1, n=35). Assay conditions with Kif4A-GFP: 20 nM (894.0 ± 253.9, n=70), 100 nM (1856 ± 380.3, n=70), 150 nM (2649 ± 1527, n=70), 200 nM (3982 ± 2346, n=70), 400 nM (6814 ± 2085, n=70), 1000 nM (7542 ± 1640, n=70).
g. Bar graph of the ratio of rescue to total number of catastrophe events in 20 minutes in the presence of 200 nM CLASP1-GFP and various Kif4A concentrations as indicated. Concentrations correspond to dimeric Kif4A and monomeric CLASP1-GFP. Error bars indicate standard deviation. Assay conditions: Tubulin control (0.0 ± 0.1, n = 60), 200 nM CLASP1 (1.0 ± 0.2, n = 57), 200 nM CLASP1 + 125 nM Kif4A (0.9 ± 0.3, n = 43), 200 nM CLASP1 + 250 nM Kif4A (0.9 ± 0.3, n = 49), 200 nM CLASP1 + 1000 nM Kif4A (0.4 ± 0.3, n = 42) and 1000 nM Kif4A (0.0 ± 0.0, n = 10). P < 0.05 for tubulin control to (i) 200 nM CLASP1, (ii) 200 nM CLASP1 + 250 nM Kif4A to 200 nM CLASP1 + 1000 nM Kif4A and to (iii) 1000 nM Kif4A. P is not significant for 200 nM CLASP1 to (i) 200 nM CLASP1 + 125 nM Kif4A and to (ii) 200 nM CLASP1 + 250 nM Kif4A.
We next performed a series of experiments where the CLASP1-GFP concentration was held constant (200 nM) and increasing amounts of Kif4A were titrated in (125 - 1000 nM). Mixtures of CLASP1-GFP and Kif4A resulted in complex dynamic instability behavior with switching between phases where a microtubule undergoes either polymerization, depolymerization or pauses its dynamics (Fig. 1b). Addition of increasing amounts of Kif4A resulted in a broad range of polymerization rates and an increase in the frequency of the pause-state where polymerization is stalled. This is evident from the broadening of the growth-rate histograms and the increasing number of phases with zero growth rate (first bin of histogram) (Fig. 1c). In addition to the frequency of pauses, we found that the duration of pauses also increased as Kif4A concentration was increased (Supplementary Fig. 1d). To quantitatively compare the growth rates in these conditions, while accounting for differences in the duration of each phase, particularly those of pause-states, we plotted the average instantaneous growth rate for each kymograph analyzed (Fig. 1d). The data show a systematic decrease of this parameter with increasing ratios of Kif4A: CLASP1, consistent with lower growth rate and increased duration of pausing at higher Kif4A concentrations.
We next examined how the combined activities of these proteins regulates microtubule length. Compared to tubulin-control, both the maximum length a microtubule grew from the seeds in the 20 min observation time, and the average microtubule length before any catastrophe event increased 2-fold in experiments with 200 nM CLASP1-GFP (Supplementary Fig. 1e, Fig. 1e; Maximum microtubule length: Control 6.0 ± 2.9 μm [n = 60], 200 nM CLASP1 12.1 ± 3.2 μm [n = 68]). Addition of increasing amounts of Kif4A systematically decreased the maximum microtubule length, and in assays with Kif4A alone, we observed extremely short polymerization events (maximum length < 1μm) or no polymerization at all (Fig. 1e).
We noticed that even though the average instantaneous growth rate dropped by a factor of ~3 from tubulin-control to 200 nM CLASP1-GFP + 250 nM Kif4A condition (Fig. 1d), the maximum microtubule lengths were similar under these conditions and became lower than the tubulin-control only with the addition of 1000 nM Kif4A (Fig. 1e). This suggests that the activity of CLASP1 in promoting the elongation of microtubules dominates over the growth suppressing activity of Kif4A and nearly 5-fold excess of Kif4A over CLASP1 is needed before Kif4A can effectively suppress microtubule elongation.
How does CLASP1 activity counteract the suppression of microtubule growth by Kif4A?
The ability of CLASP1 to override Kif4A activity on length regulation of single microtubules could arise due to either (i) higher microtubule binding of CLASP1 compared to Kif4A, or (ii) suppression of catastrophes by CLASP1, or (iii) promotion of rescues by CLASP1.
We first compared microtubule binding by Kif4A or CLASP1 individually, by analyzing GFP-fluorescence intensity measurements. GMPCPP-polymerized taxol-stabilized microtubules were incubated with either 0-1000 nM of Kif4A-GFP or 0-800 nM of CLASP1-GFP. As Kif4A is processive and exhibits microtubule tip accumulation at high ATP, the experiments were performed at 150 nM ATP. A comparison of GFP intensity per pixel showed that at all concentrations, the fluorescence intensity of Kif4A-GFP on microtubules was 4-9 fold higher than that of CLASP1-GFP. For instance, at 400 nM concentrations, the mean GFP-intensity per pixel for CLASP1-GFP was 754.5 ± 154.3, while for Kif4A-GFP it was 9-fold higher at 6814 ± 2085 (Fig. 1f). Analysis of Kif4A-GFP intensities in the presence of higher ATP concentrations excluded the possibility that the low concentrations of ATP used in this assay promoted stronger Kif4A-GFP binding (Supplementary Fig. 1f). Thus, in the presence of both proteins, CLASP1 promotes the elongation of microtubules despite its lower microtubule occupancy.
Next, we considered the possibility that the increased microtubule elongation despite the reduction in growth rates could arise from suppression of catastrophe by Kif4A and CLASP1. Therefore, we examined catastrophe and rescue frequencies in this experiment. Under all our assay conditions, the catastrophe frequency was uniformly ~ 2-2.5 fold less than the control (Supplementary Fig. 1g). However, the frequency of rescues increased 20-fold in the presence of 200 nM CLASP1-GFP compared to the tubulin-control. Moreover, no rescue events were observed with 1000 nM Kif4A (Supplementary Fig. 1h). We found that in all Kif4A:CLASP1 ratios tested, the rescue frequency remained higher than the tubulin-control (Supplementary Fig. 1h). To determine what fraction of all catastrophe events are rescued in each condition, we computed the ratio of rescue to total number of catastrophe events (Fig. 1g). Again, we find that CLASP1 has a dominant effect. For instance, 86% of all catastrophes are rescued in the 200 nM CLASP1-GFP + 250 nM Kif4A condition. Remarkably, even with a 5-fold excess of Kif4A over CLASP1, nearly 40% of catastrophe events are rescued (Fig. 1g). Consistent with this decrease in rescue percentage, we find that the microtubule occupancy of CLASP1-GFP decreases as more Kif4A is added, and CLASP1 intensity per pixel on microtubules with 1000 nM Kif4A is 1.5-fold lower than with 250 nM Kif4A (Supplementary Fig. 1i).
Together these data suggest that CLASP1’s activity as a rescue-promoting factor dominates on single microtubules over a wide concentration range, counteracting growth suppression by Kif4A to promote elongation of the polymer. To our surprise, this activity of CLASP1 dominates even when it is present at 4-to 9-fold lower-levels on microtubules relative to kif4A.
Differential regulation of single and cross-linked microtubules by the CLASP1-Kif4A-PRC1 protein module
Having established that CLASP1 activity dominates over Kif4A on single microtubules, we next studied if CLASP1 could also counteract Kif4A activity on cross-linked microtubules. In addition to binding to microtubules, both Kif4A and CLASP1 are known to bind to PRC129,30. This raises the question: In the presence of Kif4A, CLASP1 and PRC1, are the dynamics of PRC1-cross-linked microtubules similar to those of single microtubules?
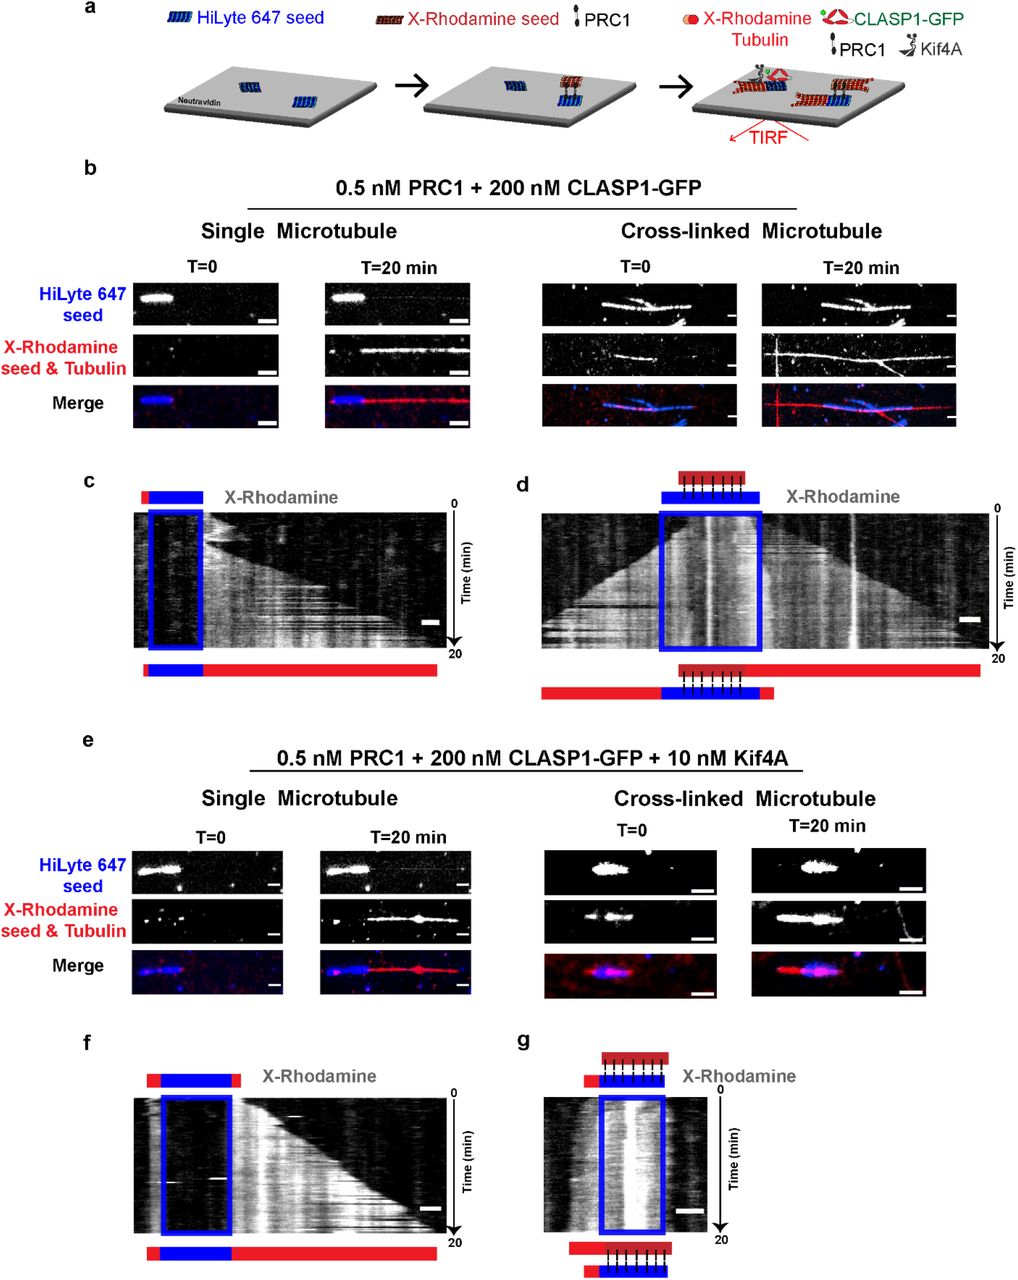
To answer this question, we reconstituted the collective activity of Kif4A, CLASP1 and PRC1 in assays where we can visualize the dynamics of both cross-linked and single microtubules. HiLyte647 GMPCPP-bound microtubule seeds were immobilized on a glass coverslip and incubated with PRC1 and X-Rhodamine GMPCPP-bound microtubule seed to form cross-linked arrays. Due to the low frequency of cross-link formation, a mixture of single and cross-linked seeds is present in the same field of view (Fig. 2a). Microtubules were grown from the immobilized single and cross-linked microtubule seeds by the addition of X-Rhodamine-labeled tubulin, 1 mM GTP and ATP, 50 mM KCl, PRC1, Kif4A and CLASP1-GFP. In this assay, we observe both the elongation of preformed antiparallel microtubule overlaps and the formation of new overlaps from cross-linking of growing microtubules. In the presence of 0.5 nM PRC1 and 5 nM Kif4A, microtubule dynamics were completely suppressed and microtubules exhibited relative sliding that halted when the ends arrived at close proximity, as described earlier42,43 (Supplementary Fig. 2).
Also see Supplementary Fig. 2, Supplementary Video 1 and Supplementary Video 2.
a. Schematic of the dynamic microtubule assay used to examine the collective activity of PRC1, Kif4A and CLASP1-GFP on cross-linked and single microtubules. HiLyte 647 labeled seeds (blue) were immobilized on glass coverslips via a neutravidin-biotin linkage, and cross-linked to X-Rhodamine labeled (dark red) seeds by the protein PRC1 (black). Microtubule dynamics in the presence of X-Rhodamine labeled tubulin (red), PRC1, CLASP1-GFP and Kif4A were imaged for 20 minutes.
b. Representative image of single microtubule (left) and cross-linked microtubule (right), showing HiLyte 647 (top), X-Rhodamine (middle) and merged (bottom) channels at the start (T=0) and end (T=20 min) of the experiment described in (a). Assay conditions are 0.5 nM PRC1 + 200 nM CLASP1-GFP. Scale bars represent 2 μm.
c. Kymograph of X-Rhodamine channel obtained from single microtubule shown in (b). The position of the seed is shown as a blue box. The schematics above and below the kymograph indicate the positions of the seed (blue) and microtubules (red) at the start and end of the experiment, respectively. Scale bar represents 2 μm.
d. Kymograph of X-Rhodamine channel obtained from cross-linked microtubule shown in (b). The position of the seed is shown as a blue box. The schematics above and below the kymograph indicate the positions of the seeds (blue, dark red) and microtubules (red) at the start and end of the experiment, respectively. Scale bar represents 2 μm.
e. Representative image of single microtubule (left) and cross-linked microtubule (right), showing HiLyte 647 (top), X-Rhodamine (middle) and merged (bottom) channels at the start (T=0) and end (T=20 min) of the experiment described in (a). Assay conditions are 0.5 nM PRC1 + 200 nM CLASP1-GFP + 10 nM Kif4A. Scale bars represent 2 μm
f. Kymograph of X-Rhodamine channel obtained from single microtubule shown in (e). The position of the seed is shown as a blue box. The schematics above and below the kymograph indicate the positions of the seed (blue) and microtubules (red) at the start and end of the experiment, respectively. Scale bar represents 2 μm.
g. Kymograph of X-Rhodamine channel obtained from cross-linked microtubule shown in (e). The position of the seed is shown as a blue box. The schematics above and below the kymograph indicate the positions of the seeds (blue, dark red) and microtubules (red) at the start and end of the experiment, respectively. Scale bar represents 2 μm.
In the presence of 200 nM CLASP1-GFP and 0.5 nM PRC1, kymographs reveal a near-continuous extension of microtubules from plus-ends of both single microtubules and preformed overlaps for the duration of the experiment indicating that CLASP1 is active on both sets of microtubules under this condition (Figs. 2b, 2c and 2d, Supplementary video 1). We next added 10 nM Kif4A along with 200 nM CLASP1-GFP and 0.5 nM PRC1, and found that single microtubules continued to elongate for the duration of the experiment, as they did in the absence of Kif4A (Fig. 2e and 2f). However, cross-linked microtubules in the same field of view showed a dramatic suppression of microtubule polymerization (Fig. 2e and 2g, Supplementary video 2). Thus, a minimal system consisting of three proteins can differentially regulate the dynamics of single and cross-linked microtubules. Here, the Kif4A-CLASP1-PRC1 protein module selectively promotes the elongation of single microtubules whereas the growth of cross-linked antiparallel microtubules is suppressed.
Quantitative analysis of length-regulation of cross-linked and single microtubules
How does the collective activity of PRC1, Kif4A and CLASP1 regulate the dynamics of cross-linked overlaps? To answer this question, we systematically increased the Kif4A concentration from 10 – 125 nM while keeping CLASP1-GFP concentration constant at 200 nM and found that there was no microtubule elongation in over 70% of all preformed bundles analyzed (Supplementary Fig. 3). Instead, microtubules exhibited relative sliding which resulted in the formation of short overlaps (Fig. 3a and 3b). Even with a 20-fold excess of CLASP1 over Kif4A ( 200 nM CLASP1-GFP, 10 nM Kif4A and 0.5 nM PRC1), when plus-ends of growing single microtubules came into contact and formed a bundle, polymerization was rapidly stalled, resulting in very short overlaps (Fig. 3c).

Also see Supplementary Fig. 3
Schematics and montages of microtubule bundles (red) grown from microtubule seeds (blue) in the presence of CLASP1-GFP, Kif4A and PRC1 at indicated concentrations. Schematics indicate the plus end of the microtubules within the bundle. Velocity arrow indicates direction of microtubule sliding. Dotted red arrows indicate microtubule growth. Dotted gray lines indicate regions of overlap. X-Rh MT: X-Rhodamine microtubules. Scale bar represents 2 μm. Assay conditions are
a. 200 nM CLASP1-GFP + 0.5 nM PRC1 + 125 nM Kif4A
b. 200 nM CLASP1-GFP + 0.5 nM PRC1 + 50 nM Kif4A
c. 200 nM CLASP1-GFP + 0.5 nM PRC1 + 10 nM Kif4A
d. 200 nM CLASP1-GFP + 0.5 nM PRC1 + 5 nM Kif4A
e. 200 nM CLASP1-GFP + 0.5 nM PRC1
This behavior was switched when we reduced Kif4A concentrations below 10 nM. Microtubule polymerization was observed at all overlaps under these conditions, including at new overlaps that were formed by the cross-linking of two growing ends (Fig. 3d, 3e, Fig. S3). Consistent with this observation, a plot of average instantaneous growth rate for each overlap analyzed showed phases with no polymerization at Kif4A concentrations greater than 10 nM, and a shift at 5 nM Kif4A, where microtubule polymerization at increased growth rates resumed (Fig. 4a). Similarly, plots of maximum microtubule length in the 20 min experimental time window and average length of each overlap revealed no extension until the Kif4A concentration was reduced to 5 nM in the presence of 200 nM CLASP1-GFP and 0.5 nM PRC1 (Fig. 4b and Supplementary Fig. 4a). Together, these data show that Kif4A has a dominant effect in regulating the dynamics of cross-linked microtubules over a wide concentration range

Also see Supplementary Fig. 4
a. Scatter plot of instantaneous growth rate of cross-linked microtubules in the presence of CLASP1-GFP, Kif4A and PRC1 at indicated concentrations. Error bars indicate standard deviation. Assay conditions (Preformed refers to microtubules crosslinks formed by seeds prior to tubulin addition and Grown refers to crosslinks formed by overlap of growing microtubules after tubulin addition): 200 nM CLASP1 + 0.5 nM PRC1 + 125 nM Kif4A 0.0 ± 0.0 nm/s [n = 30, 28:2 Preformed:Grown]; 200 nM CLASP1 + 0.5 nM PRC1 + 50 nM Kif4A 0.4 ± 0.8 nm/s [n = 39, 37:2 Preformed:Grown]; 200 nM CLASP1 + 0.5 nM PRC1 + 10 nM Kif4A Bundle 0.3 ± 0.6 nm/s [n = 35, 24:11 Preformed:Grown]; 200 nM CLASP1 + 0.5 nM PRC1 + 5 nM Kif4A 6.1 ± 2.8 nm/s [n = 36, 23:13 Preformed:Grown] and 200 nM + 0.5 nM PRC1 11.8 ± 2.3 nm/s [n = 33, 24:9 Preformed:Grown]
b. Box and whisker plot of maximum length of cross-linked microtubules in the presence of varying CLASP1-GFP, Kif4A and PRC1 concentrations. Plus-sign indicates mean. Horizontal lines within box indicate the 25th, median and 75th percentile. Error bars indicate minimum and maximum range. Mean and standard deviation for assay conditions: 200 nM CLASP1 + 0.5 nM PRC1 + 125 nM Kif4A (0.0 ± 0.0 nm, n = 30 (28:2 Preformed:Grown)), 200 nM CLASP1 + 0.5 nM PRC1 + 50 nM Kif4A (0.3 ± 0.6 nm, n = 33 (31:2 Preformed:Grown)), 200 nM CLASP1 + 0.5 nM PRC1 + 10 nM Kif4A (0.3 ± 0.7 nm, n = 36 (25:11 Preformed:Grown)), 200 nM CLASP1 + 0.5 nM PRC1 + 5 nM Kif4A (5.7 ± 2.1 nm, n = 37 (24:13 Preformed:Grown)), 200 nM + 0.5 nM PRC1 (15.2 ± 4.4 nm, n = 33 (24:9 Preformed:Grown)), 20 nM CLASP1 + 0.5 nM PRC1 + 5 nM Kif4A (1.5 ± 1.3 nm, n = 24 (22:2 Preformed:Grown)) and 0.5 nM PRC1 + 5 nM Kif4A (0.8 ± 0.7 nm, n = 20 (20:0 Preformed:Grown)). Preformed refers to microtubules crosslinks formed by seeds prior to tubulin addition and Grown refers to crosslinks formed by overlap of growing microtubules after tubulin addition.
c. Bar graph of the ratio of rescues to total number of catastrophe events in microtubule bundles in 20 minutes in the presence of varying CLASP1-GFP, Kif4A and PRC1 concentrations. Error bars indicate standard deviation. ND: Not determined because no dynamics were observed. Assay conditions: 200 nM CLASP1 + 0.5 nM PRC1 + 125 nM Kif4A (Not Determined, n = 30), 200 nM CLASP1 + 0.5 nM PRC1 + 50 nM Kif4A (Not Determined, n = 39), 200 nM CLASP1 + 0.5 nM PRC1 + 10 nM Kif4A (Not Determined, n = 36), 200 nM CLASP1 + 0.5 nM PRC1 + 5 nM Kif4A (0.9 ± 0.3, n = 15), 200 nM + 0.5 nM PRC1 (1.0 ± 0.1, n = 24), 20 nM CLASP1 + 0.5 nM PRC1 + 5 nM Kif4A (0.3 ± 0.4, n = 17) and 0.5 nM PRC1 + 5 nM Kif4A (0.0 ± 0.0, n = 12).
d. Scatter plot of instantaneous growth rates of single microtubules in the presence of CLASP1-GFP, Kif4A and PRC1 at varying concentrations. Error bars indicate standard deviation. Assay conditions: 200 nM CLASP1 + 0.5 nM PRC1 + 125 nM Kif4A (3.9 ± 2.9 nm/s, n = 7); 200 nM CLASP1 + 0.5 nM PRC1 + 50 nM Kif4A (8.4 ± 2.2 nm/s, n = 69); 200 nM CLASP1 + 0.5 nM PRC1 + 10 nM Kif4A (11.3 ± 2.5 nm/s, n = 60); 200 nM CLASP1 + 0.5 nM PRC1 + 5 nM Kif4A (12.5 ± 1.7 nm/s, n = 52); and 200 nM + 0.5 nM PRC1 (12.7 ± 2.1 nm/s, n = 47).
e. Box and whisker plot of maximum length of single microtubules in the presence of varying CLASP1-GFP, Kif4A and PRC1 concentrations. Plus-sign indicates mean. Horizontal lines within box indicate the 25th, median and 75th percentile. Error bars indicate minimum and maximum range. Mean and standard deviation for assay conditions: 200 nM CLASP1 + 0.5 nM PRC1 + 125 nM Kif4A (5.0 ± 2.1 μm, n = 76); 200 nM CLASP1 + 0.5 nM PRC1 + 50 nM Kif4A (8.4 ± 2.8 μm, n = 69); 200 nM CLASP1 + 0.5 nM PRC1 + 10 nM Kif4A (12.1 ± 3.3 μm, n = 60); 200 nM CLASP1 + 0.5 nM PRC1 + 5 nM Kif4A (11.1 ± 3.8 μm, n = 53); and 200 nM + 0.5 nM PRC1 (12.2 ± 3.4 μm, n = 47).
f. Bar graph of the ratio of rescues to total number of catastrophe events in single microtubules in 20 minutes in the presence of varying CLASP1-GFP, Kif4A and PRC1 concentrations. Error bars indicate standard deviation. Assay conditions: 200 nM CLASP1 + 0.5 nM PRC1 + 125 nM Kif4A (0.93 ± 0.18, n = 41); 200 nM CLASP1 + 0.5 nM PRC1 + 50 nM Kif4A (0.95 ± 0.18, n = 63); 200 nM CLASP1 + 0.5 nM PRC1 + 10 nM Kif4A (0.99 ± 0.06, n = 52), 200 nM CLASP1 + 0.5 nM PRC1 + 5 nM Kif4A (0.95 ± 0.15, n = 50), 200 nM + 0.5 nM PRC1 (0.93 ± 0.18, n = 45); 20 nM CLASP1 + 0.5 nM PRC1 + 5 nM Kif4A (0.20 ± 0.26, n = 39); 0.5 nM PRC1 + 5 nM Kif4A (0.0 ± 0.0, n = 50).
Does CLASP1 activity affect the lengths of cross-linked microtubules in the presence of Kif4A? To answer this question, we compared the maximum microtubule overlap lengths at 5 nM Kif4A with varying CLASP1-GFP concentrations. We found that increasing the concentration of CLASP1-GFP from 0 to 200 nM caused a 7-fold increase in the maximum overlap length (Fig. 4b), indicating that at low Kif4A concentrations (below 5 nM), the concentration ratio of Kif4A:CLASP1 tunes the lengths of overlaps. We next examined rescue and catastrophe events. Analysis of the average number of rescue events in the presence of 200 nM CLASP1-GFP as Kif4A concentration is decreased from 125-0 nM shows that dynamics reinitiate when Kif4A is reduced to 5 nM (Supplementary Fig. 4b, Table 1). Under these conditions, the rescue activity of CLASP1 is evident, with 90% of all catastrophes being rescued, as opposed to 0% with no CLASP1 (Fig. 4c).
We next examined the dynamics of single microtubules present in the same field of view as the cross-linked bundles and asked if the presence of PRC1 altered their dynamics. We analyzed the average instantaneous growth rates, maximum microtubule lengths during the time frame of the experiment and the percentage of catastrophe events that were rescued (Figs. 4d-4f). Unlike what was observed for cross-linked microtubules, we found that compared to conditions with 200 nM CLASP1, 0.5 nM PRC1 and no Kif4A, all three parameters of single microtubule growth showed no significant changes with the addition of 10 nM Kif4A. Further, the trends observed in these quantities were consistent with the dynamics of single microtubules recorded in the absence of PRC1 (Figs. 1d, 1e and 1g).
In summary, on overlaps, the suppression of growth by Kif4A is dominant at concentrations over 10 nM and counteracts the activity of CLASP1 as a rescue factor. At lower concentrations of Kif4A, the collective activity of CLASP1 in promoting rescues and of Kif4A in inhibiting dynamics together tune overlap lengths. On the other hand, on single microtubules, the activity of CLASP1 as a rescue factor predominates. While increasing Kif4A leads to a decrease in microtubule growth rates, the strong rescue activity of CLASP1 compensates and ensures that the single microtubules continue to elongate.
Why does growth suppression by Kif4A dominate over CLASP1 activity on cross-linked microtubules?
The differences in the response of single and cross-linked microtubules to low nanomolar concentrations of Kif4A prompts the question: Why does Kif4A activity dominate over CLASP1 on cross-linked microtubules? A key difference between both microtubule populations is the presence of PRC1 on cross-linked microtubules. The dominant effects of Kif4A could be a result of stronger recruitment to overlaps by PRC1, which could arise through stronger PRC1-Kif4A binding affinity compared to PRC1-CLASP1 affinity. To investigate this possibility, we first identified the PRC1-binding region on CLASP1 through BioLayer Interferometry (BLI) assays. We quantified PRC1-binding affinities of CLASP1-GFP constructs of varying lengths and identified the SR-rich region of CLASP1 between residues 654-805 as the main PRC1 binding region. Further BLI assays with full-length PRC1 and CLASP1(654-1471)-GFP yielded a binding KD of 1.19 ± 0.2 μM for the PRC1-CLASP1 interaction (Fig. 5a). Under the same conditions, BLI experiments with PRC1 and KIf4A-GFP revealed a strikingly tighter binding with a KD of 12.47± 2.1 nM (Fig. 5b).

a. Bio-Layer interferometry assay to quantitatively examine the binding affinity of CLASP1 constructs to PRC1. Error bars represent standard error of mean. Data were fit to a Hill equation. KD: CLASP1(1-654)-GFP > 10 μM; CLASP1(805-1471)-GFP > 10 μM and CLASP1(654-1471)-GFP: 1.19 ± 0.24 μM.
b. Bio-Layer interferometry assay to quantitatively examine the binding affinity of Kif4A-GFP to PRC1. Error bars represent standard error of mean. Data were fit to a Hill equation. KD: 12.47± 2.09 nM.
c Scatter plot of CLASP1-GFP fluorescence intensities on single  and cross-linked
  microtubules. Error bars indicate standard error of mean. Mean intensity and standard error of mean for assay conditions: 0.5 nM PRC1 + 200 nM CLASP1-GFP, single microtubules (24.2 ± 0.9, n=54), cross-linked microtubules (80.2 ± 8.1, n=30).
d. Scatter plot of Kif4A-GFP fluorescence intensities on single  and cross-linked
  microtubules. Error bars indicate standard error of mean. Mean intensity and standard error of mean for assay conditions: 0.5 nM PRC1 + 10 nM Kif4A-GFP, single microtubules (80.1 ± 13, n=46), cross-linked microtubules (1106 ± 90.1, n=57).
The 100-fold differences in the PRC1-binding affinities of CLASP1 and Kif4A translated to a difference in the enrichment of both proteins on cross-linked microtubules, compared to single microtubules. A comparison of CLASP1-GFP intensities on cross-linked and single microtubules in an assay performed with 0.5 nM PRC1 and 200 nM CLASP1-GFP showed a 3-fold enrichment on overlaps, confirming that PRC1 does indeed recruit CLASP1 to overlaps. (Fig. 5c; CLASP1-GFP intensity per pixel on overlaps: 80.2 ± 44.2; single microtubules: 24.2 ± 6.7). In the absence of recruitment by PRC1, the intensity of CLASP1-GFP on bundles would be less than 2-fold higher than on single microtubules. In contrast, in microscopy experiments with 0.5 nM PRC1 and 10 nM Kif4A-GFP, the enrichment of Kif4A was 14-fold on cross-linked microtubules compared to single microtubules (Fig. 5d; Kif4A-GFP intensity per pixel on overlaps: 1106.0 ± 679.8; single microtubules 80.1 ± 87.8). Together, the comparison of binding affinities and enrichment of proteins in overlaps indicate that the tighter PRC1-Kif4A interaction compared to PRC1-CLASP1 leads to a stronger recruitment of Kif4A by PRC1 on cross-linked overlaps.
DISCUSSION
It is well established that the length of a microtubule or the overlap between two microtubules can be tuned by the collective activity of MAPS with opposite functions, such as tubulin polymerases and depolymerases, or inward-outward sliding by plus- and minus-end directed motors46. This study illustrates that in contrast to these canonical mechanisms of length regulation that operate on a single microtubule or one type of array, the collective activity of antagonistic MAPs on an ensemble of microtubule arrays can differentially regulate the dynamics and size of its constituent sub-populations.
We find that a minimal protein module comprised of three MAPs: the antiparallel cross-linker PRC1, a kinesin that suppresses microtubule dynamics Kif4A, and a protein that promotes microtubule rescue CLASP1, can differentially regulate the dynamics and lengths of single and cross-linked microtubules (Figs. 2e-2g, Fig. 4). Under identical reaction conditions single microtubules can exist in a phase of continuous microtubule elongation while tubulin polymerization is completely suppressed in crosslinked bundles. In addition, each of these co-existing microtubule populations can switch between the two extreme phases of (i) continuous microtubule elongation, and (ii) complete suppression of tubulin polymerization. However, the switches on single and cross-linked microtubules occur at strikingly different Kif4A concentrations, at a constant concentration of CLASP1 (Fig. 6a).

a. The dynamics of single microtubules (top) and cross-linked microtubules (bottom) are differentially regulated by the PRC1-CLASP1-Kif4A protein module. Box with dotted lines indicates regime where dynamics switch between continuous growth  and no elongation
  . In the presence of 200 nM CLASP1, the switch for both microtubule populations occur at strikingly different Kif4A concentrations.
b. Underlying this differentiation is the (i) reciprocal levels of activity and occupancy of microtubule-bound Kif4A and CLASP1. As a result, (ii) the high activity of CLASP1 as a rescue factor overcomes Kif4A activity on single microtubules, despite lower CLASP1 occupancy. However, on cross-linked microtubules, (iii) the enrichment of Kif4A through the stronger PRC1-Kif4A binding helps it overcome CLASP1 activity. The low occupancy of CLASP1 on microtubules permits Kif4A to override CLASP1 on crosslinked microtubules.
How are single and crosslinked microtubules differentially regulated by the PRC1-Kif4A-CLASP1 module? We find that on single microtubules, the activity of CLASP1 dominates to promote rescue and thereby microtubule elongation even at a 5-fold lower concentration than Kif4A (Fig. 1b-1e, Fig. 4). In this regime, the microtubule occupancy of CLASP1 is at least 4-9 fold lower compared to Kif4A (Fig. 1f). The lower occupancy of CLASP1 could arise from few lattice-bound molecules of this large, flexible, multi-domain protein sterically hindering further microtubule binding, or from the transient nature of its binding to the microtubule lattice37,39,41. Why do single microtubules continue to elongate in the presence of all three proteins, despite having more Kif4A bound? We propose that similar to its isoform CLASP2, a low number of CLASP1 molecules which bind all along the microtubule lattice are sufficient to initiate a rescue, whereas Kif4A needs to be present at high concentrations at the tip to suppress microtubule dynamics37. In contrast to single microtubules, we find that low nanomolar concentrations of Kif4A overcome CLASP1 activity on cross-linked microtubules to suppresses microtubule elongation. How is this achieved If CLASP1 has high activity at lower occupancy than Kif4A? The change in dynamics arises primarily from the 10-28 fold greater accumulation of PRC1 at overlaps compared to single microtubules36,47. In our experiments, this subsequently leads to the 14-fold enrichment of Kif4A at overlaps due to its 100-fold higher affinity for PRC1-binding compared to the PRC1-CLASP1 interaction (Fig. 5). This level of enrichment of Kif4A on PRC1-crosslinked microtubules should suppress microtubule growth as a ~10-fold enrichment of Kif4A is sufficient to stall the growth of single microtubules at 1000 nM relative to 10 nM solution concentrations (Fig. 1f). In comparison, CLASP1 is enriched only 3-fold at overlaps over single microtubules, through PRC1-binding. As a result of this amplification of Kif4A activity at overlaps by PRC1, growth suppression by Kif4A overcomes CLASP1 activity even at a 20-fold excess solution concentration of CLASP1 over Kif4A (Fig. 4a-4c). Thus, two seemingly counteracting intrinsic properties of CLASP1 are requisite for the differential regulation of dynamics of single and cross-linked microtubules observed in this system: (i) Strong rescue activity that promotes elongation of single microtubules, and (ii) low microtubule occupancy which permits the dominance of enriched Kif4A at overlaps. Interestingly, the converse is true for Kif4A, and its weak activity can prevail over CLASP1 only at overlaps where it has high occupancy (Fig. 6b). Taken together, our results suggest that an inverse relationship between the activity and occupancy of the regulators Kif4A and CLASP1 on microtubules underlies the differential regulation of the dynamics of single versus cross-linked microtubules in this system (Fig. 6b).
While the strict spatial segregation of proteins into different arrays, such as a mechanism where CLASP1 binds only single microtubules with high affinity and Kif4A binds only on overlaps, may appear to be the simplest strategy for the differential regulation of array dynamics, the concurrent activity of both Kif4A and CLASP1 on single and cross-linked microtubules, as described here, has several advantages. First, tight spatial partitioning is difficult to achieve in dynamic systems where the proteins are characterized by fast turnover on microtubules. This is indeed the case for PRC1, CLASP1 and Kif4A at the cell center and consequently, the local solution concentrations of all proteins are likely to be high15,26,48. Second, in addition to differential regulation, this system permits the modulation of stability and length of single and cross-linked microtubules by both regulators. Moreover, the tuning of single microtubule lengths affects the total number of bundles by altering the probability of two growing ends encountering each other to form a cross-linked overlap. Third, the presence of both proteins allows individual microtubule arrays to independently switch between dynamic states. This property would be advantageous in re-initiating microtubule growth in case of damage to either array. Thus, the characteristic features of the PRC1-Kif4A-CLASP1 system presents a highly versatile and tunable system for differentially regulating length and dynamics of single microtubules and cross-linked bundles at proximal cellular sites.
How might such a module, which consists of opposing regulators, promote microtubule organization at the cell center during anaphase? The structure of the anaphase spindle differs widely across cell types, with the number of inter-polar microtubules varying from fewer than 10 to many 100s, and with spindle elongation lengths ranging from 1 to 10 μm49. In the face of such diversity, the presence of both the growth promoter and suppressor on single and cross-linked microtubules provides a flexible strategy whereby the dominant regulator could change depending on the spindle type and the need of the system. This is seen in systems such as Xenopus egg extracts and Drosophila spermatocytes at anaphase where CLASP homologs increase the stability of all spindle microtubules, including bundles25,50. In fission and budding yeast, the spindle localization of the growth suppressors of the Kinesin-8 family is independent of the cross-linker Ase1p23,51. This likely reflects an adaptation suited to the large elongation of its spindle, which is chiefly mediated by the activity of rescue factors and polymerases such as CLASP and XMAP215 homologs on cross-linked microtubules24,51. In yet other systems, the nucleation and elongation of non-centrosomal microtubules at anaphase onset contribute significantly to spindle assembly. CLASPs are known microtubule nucleation factors, and in these systems, CLASP activity on single microtubules is essential for initial microtubule assembly33. Together, the three-protein module provides an adaptable, versatile platform which can promote the nucleation and elongation of new microtubules, and tune the lengths and stability of single and cross-linked arrays separately, through differential regulation of their dynamics.
On a broader note, these design principles do not rely on features specific to the anaphase spindle and can be extended to other cytoskeletal structures, to regulate the dynamics of microtubule and actin arrays found in the cellular cytoplasm.
METHODS
Protein Expression and Purification
Full-length human CLASP1 protein (GenBank: BC112940.1) and all deletion constructs (CLASP1(1-654), CLASP1(654-1471) and CLASP1(805-1471)) were cloned into a modified pFastBac expression vector (Thermo Fischer Scientific) that contained a PreScission Protease cleavable N-terminal Twin-Strep-Tag and a C-terminal GFP followed by a Tobacco etch Virus (TEV) cleavable 6x-His tag. Proteins were expressed in the Sf9 insect cell line using the Bac-to-Bac® Baculovirus Expression System (Thermo Fischer Scientific), and cells were grown in HyCloneTM CCM3 SFM (GE Life Sciences). Pellets of all deletion constructs were lysed by a short sonication in buffer A (50 mM Phosphate buffer pH 8.0, 300 mM NaCl, 10 % glycerol, and 30 mM imidazole) supplemented with 0.15 % tween, 0.5 % Igepal 630, 2 mM TCEP, 1 mM PMSF, 0.5 mM Benzamidine Hydrochloride, 75 U Benzonase and protease inhibitor cocktail (Thermo Scientific). The lysate was clarified by ultracentrifugation (70,000 x g, 30 min) and supernatant was incubated with Ni-NTA resin (Qiagen) for 1 hour. The resin was washed with buffer A supplemented with 0.15 % tween and 0.5 mM TCEP and bound protein was eluted with 50 mM Phosphate buffer pH 8.0, 300 mM NaCl, 5 % glycerol and 400 mM imidazole. Peak protein fractions were pooled and incubated with TEV and PreScission protease (30:1 w/w of protein:protease) overnight at 4 °C. The proteins were further purified by size exclusion chromatography (SEC; HiLoad 16/600 Superdex 200 pg, GE Healthcare) in 50 mM phosphate pH 8.0, 300 mM NaCl, 5 % glycerol and 5 mM β-mercaptoethanol, and frozen in liquid nitrogen. Full-length CLASP1-GFP was purified similar to the protocol described above, with the following modifications: Lysis buffer contained 50 mM Phosphate buffer pH 7.5, 500 mM NaCl, 10 % glycerol, 30 mM imidazole, 100 mM arginine, supplemented with 0.15 % tween, 0.5 % Igepal 630, 2 mM TCEP, 1 mM PMSF, 75 U Benzonase and protease inhibitor cocktail (Thermo Scientific). Following a short sonication and ultracentrifugation, the clarified supernatant was passed through a Ni-NTA superflow cartridge (Qiagen). After elution, fractions containing pure protein were pooled and the 6x-His tag was cleaved with TEV protease in the presence of 100 mM arginine, 2 mM β-mercaptoethanol, 5 mM EDTA and 0.1 % tween. The cleaved protein was further purified through SEC in a Superose 6 increase 10/300 GL column (GE Healthcare), in buffer containing 50 mM phosphate pH 7.5, 500 mM NaCl and 10% glycerol.
Kif4A-GFP, Kif4A and PRC1 were purified as previously described35,47. Tubulin was purified52 or purchased from PurSolutions, LLC. Tubulin was labeled in 1:10 proportions with biotin or X-rhodamine according to published protocols or mixed with prelabeled tubulin purchased from Cytoskeleton, Inc.
Total Internal Reflection Fluorescence Microscopy Assays
Microscope chambers were constructed using a 24 × 60 mm PEG-Biotin coated glass slide and 18 × 18 mm PEG coated glass slide separated by double-sided tape to create two channels for exchange of solutions. Standard assay buffer was 1 x BRB80 (80 mM K-PIPES at pH 6.8, 2 mM MgCl2 and 1 mM EGTA at pH 6.8), 50 mM KCl, 1 mM ATP, 1 mM GTP, 0.1 % methylcellulose and 3 % sucrose. Imaging was carried out in the presence of an antifade reagent mix (40 mg/ml Glucose Oxidase, 35 mg/ml Catalase, 25 mM Glucose, 0.5% β-mercaptoethanol and 10 mM Trolox reagent). Images were acquired using NIS-Elements (Nikon) and analyzed using ImageJ. Data were analyzed from experiments performed on three independent days, unless specified otherwise.
Dynamic Microtubule Assay of Single Microtubules
Experiments with dynamic microtubules were carried out as described in Jiang et al., 201953. X-rhodamine (1:10 labeled to unlabeled) and biotin (1:10 labeled to unlabeled) labeled microtubules were polymerized in the presence of GMPCPP, a non-hydrolysable GTP-analogue, and immobilized on a neutravidin coated glass coverslip. Coverslips were briefly incubated with casein to block non-specific surface binding. A low concentration of CLASP1-GFP (1 nM) was added and accumulation of protein preferentially to the plus-end of seed was used as an indicator of microtubule polarity. Subsequently, 16 μM tubulin (1 X-rhodamine-labelled tubulin:10 unlabeled tubulin) in assay buffer and antifade reagent along with CLASP1 and Kif4A protein and ATP were added. Images were recorded every 10 seconds for 20 minutes. In all microtubule experiments, concentrations of monomeric CLASP1 and dimeric Kif4A are reported, unless otherwise specified.
Dynamic Microtubule Assay of Microtubule Bundles
HiLyte647 (1:10 labeled to unlabeled) and biotin (1:10 labeled to unlabeled) labeled microtubules were polymerized in the presence of GMPCPP, a non-hydrolysable GTP-analogue, and immobilized on a neutravidin coated glass coverslip. Coverslips were briefly incubated with casein to block non-specific surface binding. Microtubule bundles were formed through the addition of 5 nM PRC1 and GMPCPP-polymerized X-rhodamine microtubules. CLASP1, Kif4A, PRC1 and tubulin were subsequently added in the presence of antifade reagents. Images were recorded every 10 seconds for 20 minutes. For experiments performed to quantify the enrichment of Kif4A-GFP on bundles in the absence of CLASP1, data from 2 independent days of experiments were analyzed.
Kif4A-GFP and CLASP1-GFP binding to single microtubules
HiLyte647 (1:10 labeled to unlabeled) and biotin (1:10 labeled to unlabeled) labeled microtubules were polymerized in the presence of GMPCPP and taxol, and immobilized on a neutravidin coated glass coverslip. Coverslips were briefly incubated with casein to block non-specific surface binding. Kif4A-GFP or CLASP1-GFP were subsequently added, along with master buffer, antifade reagent, ATP and 50 mM KCl and still images were recorded. Data from two independent days of experiments were analyzed. Data from a third day was recorded and showed consistently higher intensity values owing to changes in the microscope’s settings. These data were separately analyzed and showed the same trends as data from the other two sets. Concentrations of monomeric Kif4A-GFP were used in these experiments to enable direct comparison between CLASP1-GFP and Kif4A-GFP intensities.
Quantification and Statistical Analysis
Intensity analysis
ImageJ was used to assess GFP fluorescence intensities on microtubules. For all average intensity per pixel values recorded, a rectangular area along the microtubule was selected with a width of 5 pixels. Background intensities were also subtracted locally from regions of interest using the same principle around the selected microtubule. Intensities were not analyzed for microtubules found at the edges of the camera’s field of view. Plotting of intensities was carried out in GraphPad Prism. “n” numbers in all experiments refer to the unique number of microtubules used for the dataset and standard deviations correspond to deviations from the mean.
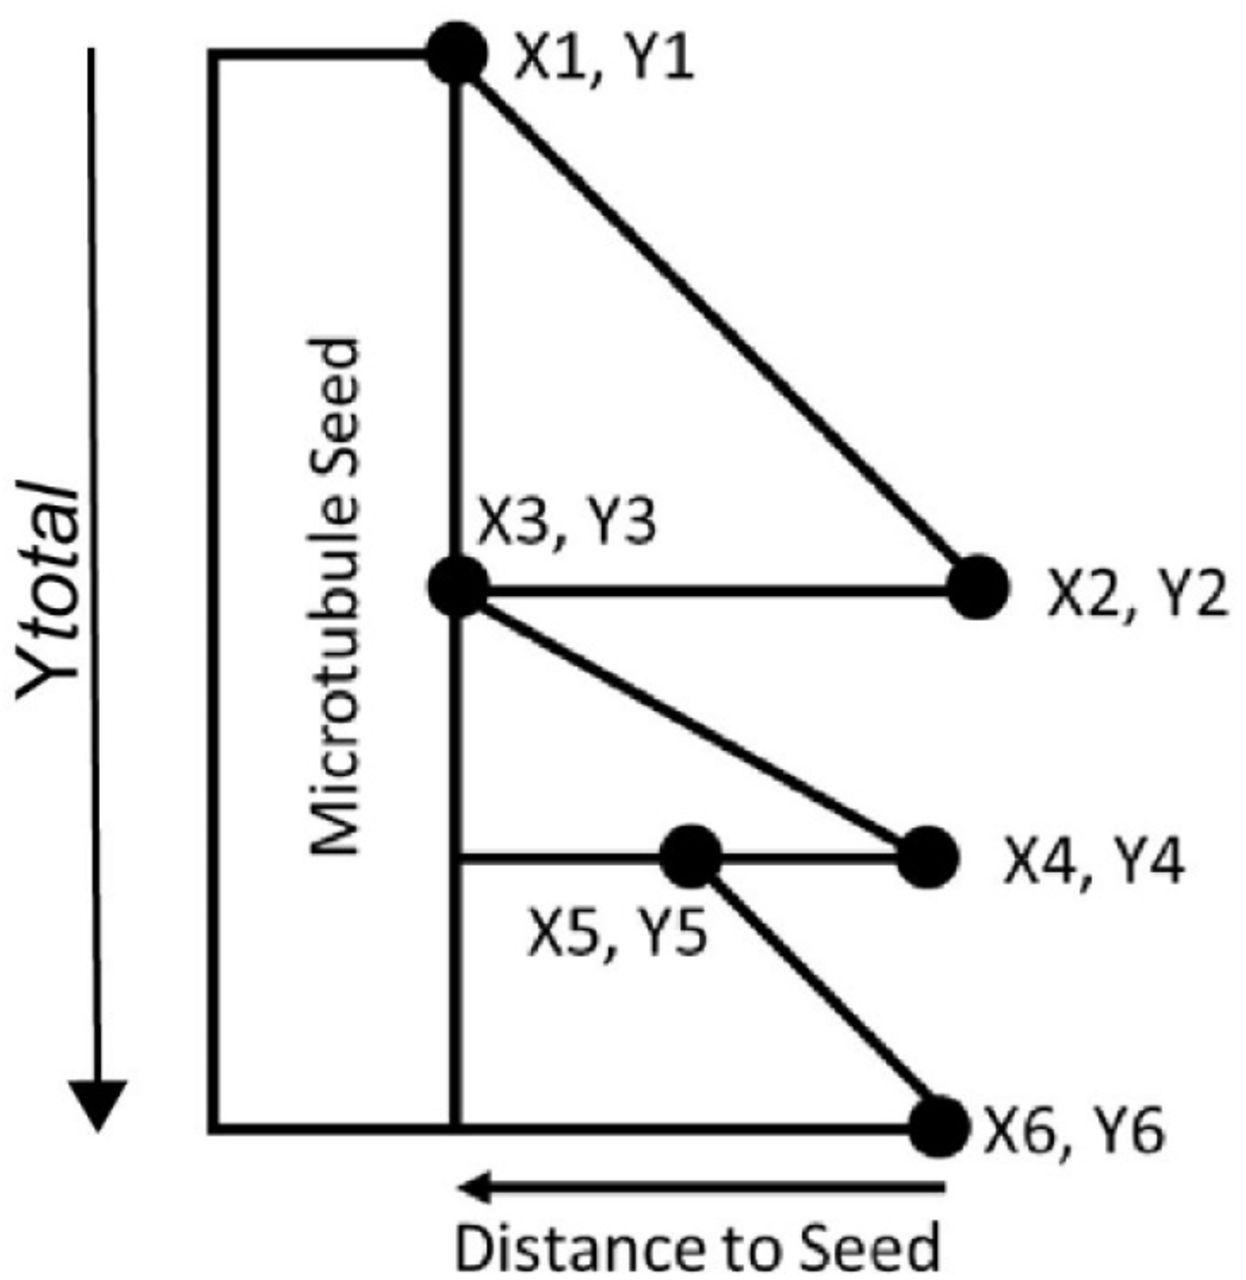
For kymographic analysis of microtubules, kymographs from growing microtubules were generated using the multiple kymograph plugin in ImageJ. Analysis was carried out first by 1) recording the coordinates of each growth event as below and 2) the length from the tip of the growing microtubule for each event to the microtubule seed. Rate values were multiplied by 65 (nm per pixel of the recording camera) and divided by 10 (duration between each frame) to arrive at a nm/s value and length values were multiplied by 65 to arrive at a nm value.
Growth Rate Analysis
For each event in a kymograph, growth rates were calculated by the equation:

The output was the growth rate in nm/s. These values were used to plot the growth rate of each event and also the distribution of growth rates.
Distribution plot of growth rates
Individual growth rates from each event on a kymograph were plotted on a distribution plot using GraphPad Prism. Relative frequency values were plotted with a bin width of 3 nm/s.
Instantaneous growth rate
To calculate instantaneous growth rates, the growth rate of each individual event was considered as a fraction of total time of each kymograph as:

Subsequently, the instantaneous growth rate for each kymograph equated to:

Fraction of time microtubule stalled plot
Instantaneous growth rates were recorded and all values <3 nm/s were considered as stalling events. (Pixel size of the Zyla CMOS camera is 65 nm. Frames were recorded every 10 seconds for all images. Therefore at 3 nm/s, there would only be 30 nm growth which is less than 1 pixel). The fraction of time each microtubule stalled was calculated as below:

Average microtubule length before catastrophe event analysis
Microtubule lengths were measured from the tip of a growing microtubule to the seed for each catastrophe event. Length at the last timepoint was excluded from the calculation as no catastrophe could be recorded. Each individual length from all kymographs analyzed were plotted.
Maximum microtubule length analysis
For each kymograph, the maximum length each microtubule reached was recorded. Lengths were measured from the tip of the microtubule to the seed. Length at the last timepoint was included. Each individual value for each kymograph was plotted.
Average number of rescues
For each kymograph, the number of rescue events were recorded. Rescue events were defined as catastrophe events which did not depolymerize to the GMPCPP microtubule seed.
Rescue as a fraction of total number of catastrophe
For each kymograph, the number of rescue events and catastrophe events were recorded. Rescue events were defined as above and catastrophe events were defined as any catastrophe event regardless of depolymerization to the GMPCPP microtubule seed. The frequency of rescue events as a fraction of total number of catastrophe events were plotted for each individual kymograph.
BioLayer Interferometry (BLI) Assays
BLI experiments were performed in an Octet Red 96 instrument (ForteBio). Full length PRC1 (the ‘ligand’ protein) was immobilized on an Amine-Reactive Second-Generation (AR2G) sensor at a concentration of 12 μg/ml in sodium acetate buffer pH 5, using the AR2G Reagent kit (ForteBio). The analyte proteins (CLASP1(1-654)-GFP, CLASP1(1-805)-GFP, CLASP1(805-1471)-GFP and Kif4A-GFP) were diluted in binding buffer: 1X BRB80 (80 mM K-PIPES at pH 6.8, 1 mM MgCl2 and 1 mM EGTA at pH 7.2) supplemented with 50 mM KCl, 1 mM DTT and 0.1 % tween, at concentrations ranging from 0-10 μM for CLASP proteins and 0-120 nm for Kif4A-GFP. The sensors containing PRC1 were first dipped into quenching solution (1 M ethanolamine), and then in pre-blocking solution containing binding buffer with 1 mg/ml α-casein, to reduce non-specific binding of analyte. Following this, they were dipped briefly in binding buffer and then into analyte proteins to record the binding response for association of analyte to ligand, and then into plain binding buffer for dissociation. The assay was repeated sans ligand protein to measure non-specific binding of analyte to the sensor. Data were analyzed using Data Analysis 9.0 software (ForteBio) and double referencing was performed to correct for drift of ligand from sensor and non-specific binding of analyte. Binding responses at 180s in the association step from three independent experiments were plotted against analyte concentrations and data were fit to a Hill equation to determine the binding KD.
ACKNOWLEDGEMENTS
This work was supported by a grant from the NIH (1DP2GM126894-01), and funds from the Pew Charitable Trusts and the Smith Family Foundation to R.S. The SEC-MALS instrumentation was supported by NIH Award Number 1S10RR023748-01 to Ewa Folta-Stogniew (Yale School of Medicine, USA). We thank Bob K. Dass (ForteBio – Molecular devices) for help with BLI assays.
Footnotes
↵* radhika{at}molbio.mgh.harvard.edu
REFERENCES


