

Abstract
There is a long-established link between anatomy and function in the somatomotor system in the mammalian cerebral cortex. The morphology of the central sulcus is highly predictive of the location of functional activation peaks relating to movement of different effectors in individuals. In contrast, morphological variation in the subcentral region and its relationship to function is, as yet, unknown. Investigating the subcentral region is particularly important in the context of speech, since control of the larynx during human speech production is related to activity in this region. Here, we examined the relationship between morphology in the central and subcentral region and the location of functional activity during movement of the hand, lips, tongue, and larynx at the individual subject level. We provide a systematic description of the sulcal patterns of the subcentral and adjacent opercular cortex, including the inter-individual variability of sulcal morphology. We show that, in the majority of subjects, the anterior subcentral sulcus is not continuous, but consists of two distinct segments. A robust relationship between morphology of the central and subcentral sulcal segments and movement of different effectors was demonstrated. Inter-individual variability of underlying anatomy might thus explain previous inconsistent findings, in particular regarding the ventral larynx area in subcentral cortex. A surface registration based on sulcal labels indicated that such anatomical information can improve the alignment of functional data for group studies.
Introduction
A fundamental challenge in neuroscience is to establish meaningful links between brain structure and function. One of the clearest cases of such a structure-to-function relationship is found in the somatomotor system in the central strip of the cerebral cortex (Jackson 1863; Hitzig and Fritsch 1870; Vogt and Vogt 1919; Penfield and Boldrey 1937). Different parts of the body are represented in an orderly and consistent fashion, following a somatotopic organization, the schematic visualization of which is known as Penfield’s ‘homunculus’.
In contrast to electrical brain mapping studies, neuroimaging studies typically report average activations from larger groups. This approach demonstrates effects that are representative of the human brain in general, but obscures subject-specific features and inter-individual variability, limiting sensitivity and functional resolution (Bennett and Miller 2010; Nieto-Castañón and Fedorenko 2012; Woo et al. 2014). Consequently, a growing number of neuroimaging studies now tend to report activation patterns in individuals (Miller et al. 2002; Barch et al. 2013; Carey et al. 2017). A deeper understanding of structure-to-function relationships, however, requires examination of inter-individual functional variability together with anatomical variability.
Several studies have established a coupling between the sulcal/gyral brain anatomy and functional activation in individuals (e.g., Amiez et al., 2006; Derrfuss et al., 2012; Amiez et al., 2013; Zlatkina et al., 2016; Bodin et al., 2018). A recent neuroimaging study demonstrated that the location of individual somatomotor activation peaks showed a consistent relationship between the effector being moved and the morphologically defined segments of the central sulcus (Germann et al. 2019). The inter-individual variability of the central sulcus segments, however, was not quantified and this investigation focused exclusively on the central sulcus.
Movement representation in the human brain, however, is not limited to the central sulcus. The subcentral gyrus, in addition to the ventral portion of the central somatomotor strip, is involved in speech-related movements (Penfield and Boldrey 1937; Olthoff et al. 2008; Grabski et al. 2012; Bouchard et al. 2013; Eichert et al. 2020a). Voluntary control of laryngeal movements during vocalization evokes brain activity in two distinct regions in lateral motor cortex: a dorsal region close to the representation of the lips and a ventral region close to the lateral fissure (reviewed in: Belyk and Brown, 2017; Eichert et al., 2020a). The representation of the larynx in the human brain, however, remains controversial. The inconsistency among reports in the literature might be explained by inter-individual variability in structure and function in this region. Therefore, examining the functional anatomy of the speech motor system requires investigation both of the central sulcus and the subcentral gyral region at an individual subject level.
To the best of our knowledge, there has been no systematic examination of the morphological variability in the subcentral gyrus and the adjacent opercular cortex. There are two distinct sulci in the subcentral region: the anterior subcentral sulcus (ascs) and the posterior subcentral sulcus (pscs) (Ono et al. 1990; Petrides 2012, 2019). The variability of these two sulci in relation to the central sulcus segments across individuals, and the relationship of morphological variability to functional brain activity during movement, specifically vocalization, are needed.
Here, we assessed the structure-to-function relationship in the human motor system on an individual subject level by examining the morphology of the central sulcus, the subcentral gyrus and the adjacent central operculum. We performed sulcal labelling in surface space, rather than in volume space, which is a suitable representation of the intrinsic topology of the cerebral cortex (Fischl et al. 1999). To visualize and quantify inter-individual variability of the examined sulcal segments, we derived spatial probability maps in both standard surface and volume space. In a subset of subjects, we acquired functional magnetic resonance imaging (fMRI) data to localize brain activity during movement of the hand, lips and tongue, as well as the larynx during vocalization (Eichert et al. 2020a). To investigate how this structure-to-function relationship can help to improve alignment of data, we registered all subjects based on the sulcal surface labels. A decrease in distances across activation peaks after applying the registration would indicate that anatomical variability can explain some of the functional variability.
Material and Methods
Subjects
Data from two groups of subjects were used. In one study group, both structural and functional MRI data were acquired; (n = 20) in the other study group, only structural MRI data were available (n = 30).
Structural and functional MRI data from the performance of motor tasks were acquired from 20 subjects (12 females, 18 – 40 years [27.4 ± 5.6, mean ± SD], 5 self-reported left-handers). All subjects were self-reported native English speakers (two were raised bilingually from infancy and three were fluent in a second acquired language) and had no history or diagnosis of speech disorders. All had normal hearing, normal or corrected-to-normal vision, and no neurological impairments. The subjects were part of a study that had been approved by the Central University Research Ethics Committee of the University of Oxford (CUREC, R55787/RE001) in accordance with the regulatory standards of the Code of Ethics of the World Medical Association (Declaration of Helsinki). All subjects gave informed consent for their participation and were monetarily compensated for their participation.
In addition, we used cortical brain surface reconstructions from 30 subjects provided by the Human Connectome Project (HCP), WU-Minn Consortium (Principal Investigators: David Van Essen and Kamil Ugurbil; 1U54MH091657) funded by the 16 NIH Institutes and Centers that support the NIH Blueprint for Neuroscience Research; and by the McDonnell Center for Systems Neuroscience at Washington University (Van Essen et al. 2013). The minimally pre-processed datasets of the first 31 subjects (16 female, age range 22-35 years, handedness information not accessed) of the Q2 release were used. One subject was excluded because of a technical problem in the automatic FreeSurfer parcellation.
MRI Data Acquisition
MRI data acquisition parameters differed for the two groups of subjects. Data from the subjects that took part in the functional study were obtained at the Oxford Centre for Human Brain Activity (OHBA) using a 3T Siemens Prisma scanner with a 32-channel head coil. Two structural images of the whole brain had been acquired at 1 mm isotropic resolution; a T1w image (MPRAGE sequence) and a T2w image (SPACE sequence). For task-fMRI, whole head T2*-weighted echo planar images were acquired at 2.4 mm3 isotropic resolution (TE = 30 ms, multiband fact 6, TR = 0.8 s, Casey et al., 2018).
Data acquisition and preprocessing methods of the HCP subjects are detailed in Glasser et al. (2013) and Uǧurbil et al. (2013). T1w images had been acquired using an MPRAGE sequence at 0.7 mm isotropic resolution.
Structural MRI Data Analysis
Data of the subjects who took part in the functional study were pre-processed using the HCP-pipeline Glasser et al. (2013). The automatic processing pipeline includes cortical surface reconstruction using FreeSurfer based on the contrast from the T1w and the T2w images and automatic assignment of neuroanatomical labels. Cortical surface reconstructions of the HCP subjects were derived using FreeSurfer based on the T1w scans and directly provided by the database. A linear transformation (12 degrees of freedom) from FreeSurfer’s anatomical to standard MNI space (nonlinear 6th generation atlas, Fonov et al., 2011) was derived using FSL’s FLIRT (Jenkinson and Smith 2001; Jenkinson et al. 2002).
Sulcal Labelling
We identified the following sulci and sulcal segments in the structural data from all 50 subjects: five segments of the central sulcus from dorsal to ventral (cs_1 to cs_5), the lateral and opercular segments of the anterior subcentral sulcus (ascs_lat, ascs_op) and the posterior subcentral sulcus (pscs) (Fig. 1a). Sulcal labels for one example subject are shown in Fig. 1b, c and a three-dimensional rendering of this individual’s segments is provided as animation in the supplementary material (Online Resource 1) generated using FSLeyes (McCarthy 2020). Sulcal labels were drawn manually onto the native surface mesh (approximately 136,000 vertices) in Connectome Workbench’s wb_view (www.humanconnectome.org/software/connectome-workbench.html). Surface features of both pial and white matter surface were inspected in conjunction with the subject’s T1w scan. The identification of central sulcus segments was based on changes in direction of the sulcus and on gyral ‘plis de passage’, which are small gyral bridges connecting the postcentral with the precentral gyrus. These landmarks can be most easily identified on the white matter surface and are not always visible on the pial surface alone (Germann et al. 2019). The following description of morphological criteria was sufficient to identify the sulci in all 50 subjects.
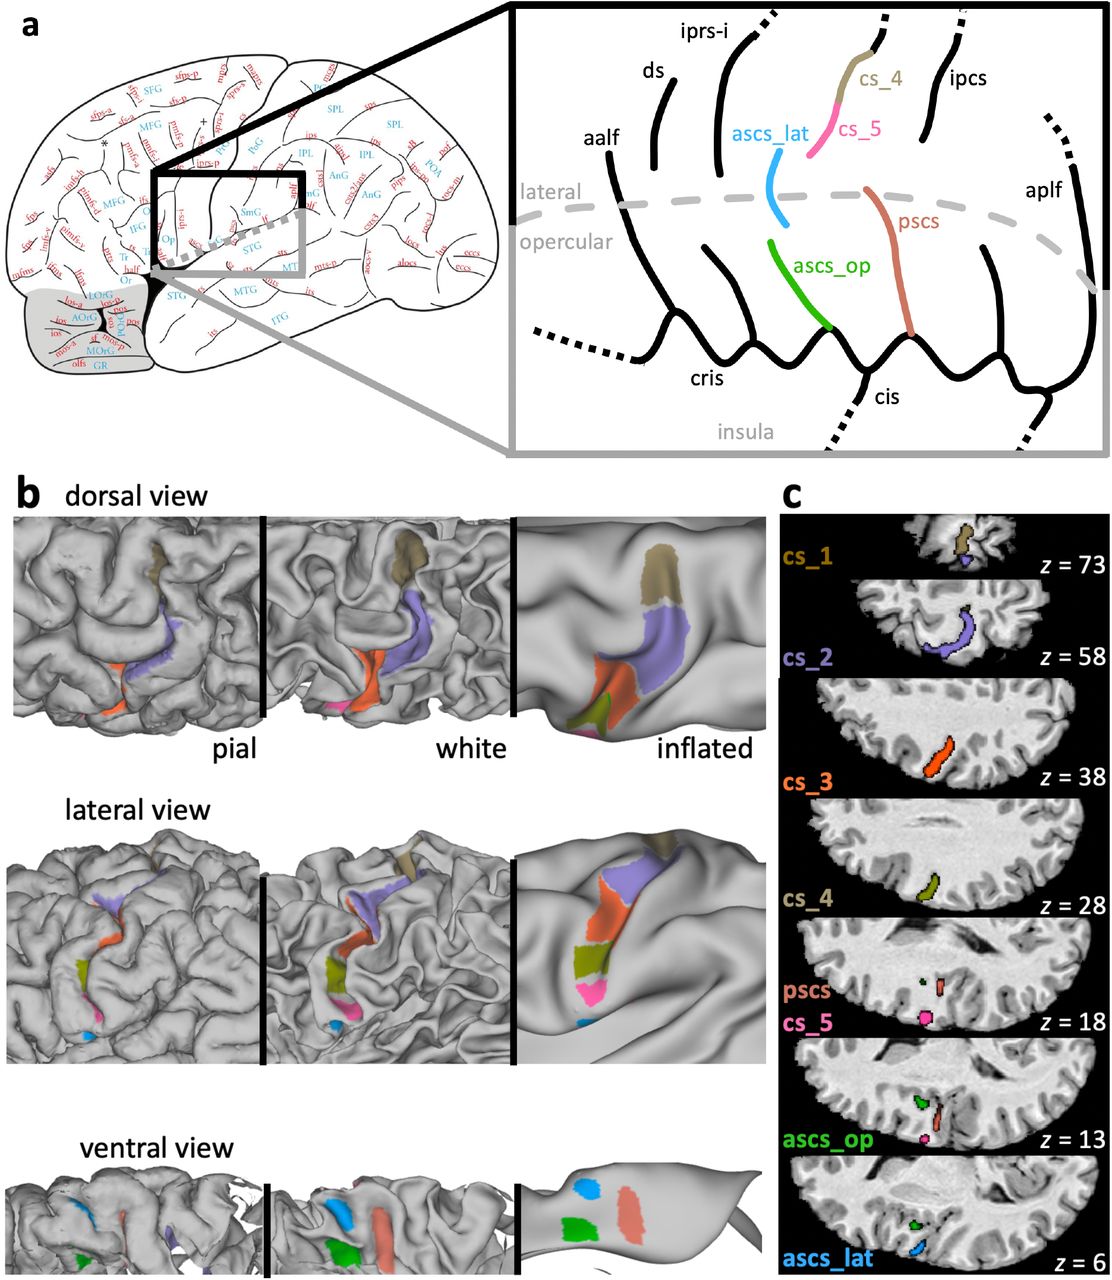
Sulcal morphology in the central and the subcentral region. a Left: Sulcal map of the human cerebral cortex (brain atlas figure modified from Petrides M. (2019)). Right: Typical configuration of sulci in the subcentral region (Type 1). Anatomical variability was assessed in the sulci marked with colour: ascs_lat, lateral segment of the anterior subcentral sulcus; ascs_op, opercular segment of the anterior subcentral sulcus; cs_1 to 5, segments of the central sulcus (only cs_4 and cs_5 are shown in the highlighted region); pscs, posterior subcentral sulcus. Grey dashed line: visible surface boundary between lateral and opercular cortex. aalf, ascending anterior ramus of the lateral fissure; aplf, ascending posterior ramus of the lateral fissure; cis, central insular sulcus; cris, circular insular sulcus; ds, diagonal sulcus; iprs, inferior precentral sulcus. b Sulcal labels in one individual displayed onto the native pial surface, white matter surface, and inflated surface. c Sulcal labels of the same subject in MNI volume space
Cs_1 is the most dorsal segment of the central sulcus, which runs more or less in a vertical straight direction. Its ventral boundary was drawn at the location where a gyral bridge forms a prominent landmark on the posterior bank of the central sulcus. Cs_2 has a characteristic curvature in the shape of the Greek omega letter (see Fig. 1b, c), which is known as the ‘hand knob’ (Yousry et al. 1997). This knob is often more pronounced in the left hemisphere and it can comprise two smaller knob-like curves instead of one. The boundary between cs_2 and cs_3 was drawn at the location where the central sulcus changes direction and where a gyral passage can be observed on the posterior bank. In some brains, an additional convexity of the central sulcus can be observed on the posterior bank in the middle of cs_3. The ventral boundary of cs_3 was drawn ventral to this convexity, if present, at the location where a small gyral bridge forms a landmark on the anterior bank of the central sulcus. The last two segments of the central sulcus, cs_4 and cs_5 are smaller in extent, shallower and more variable in their morphology (see Results section for a more detailed anatomical characterization). The boundary between cs_4 and cs_5 was defined based on a gyral bridge on the posterior bank of the central sulcus. Cs_5 is the most ventral part of the central sulcus, which can form an additional curve or run in straight direction.
The labels for ascs and pscs were assigned based on an atlas of human brain morphology (Petrides, 2019). For ascs, we labelled two distinct segments: a lateral and an opercular segment (ascs_lat, ascs_op). The course of ascs_lat, ascs_op and pscs was found to be highly variable and a detailed description of the sulcal anatomy in the subcentral region is reported in the results section.
The morphological patterns of the ventral subcentral region were categorized into five types depending on the configuration of ascs_lat. The classification was based on the location of ascs_lat on the cortex and its spatial relation to other sulci. Sulcal segments were considered as ‘merged’, when there was a clear continuation on the pial surface, although, in some cases, a discontinuity between the merged sulci was still observed on the white matter surface.
Spatial Probability Maps
In order to characterize the inter-individual morphological variability of the labelled sulci, we generated probability maps in surface and volume space. To obtain surface probability maps, all surface labels were resampled from native to a standard mesh (32k_fs_LR) following FreeSurfer’s registration (Glasser et al. 2013). At each vertex, the 50 surface maps were binarized, summed up and then normalized to create a surface label with intensities ranging from 0 % to 100 % at the maximal possible overlap of all 50 subjects. For visualization, the surface probability maps were displayed onto an inflated template surface.
For the generation of volumetric probability maps, surface labels on the standard mesh were mapped to volume space. The subjects’ native pial surface were transformed to the same standard mesh, which involves a non-linear transformation to Montreal Neurological Institute (MNI) stereotaxic space. Then we mapped the surface labels from the individual’s pial surface to 0.5 mm resolution volume space using wb_command. Given that the volumetric labels spatially varied in 3 rather than in 2 dimensions, the labels were smoothed (Gaussian kernel with FWHM of 2 mm) to enhance overlap. The labels were then thresholded at 0.1, binarized and then summed at each voxel. For visualization, volume probability maps were overlaid onto the MNI average brain.
Anatomical characterization of sulcal segments
We characterized the sulcal segments using several anatomical descriptors. Inter-individual variability was determined as the maximal value within the surface probability map. As measure for sulcal depth, we computed the minimal value in each individual’s sulcal segment labels using FreeSurfer’s sulcal depth map. The depth value is derived based on an individual’s pial surface and expressed as normalized value relative to a baseline running along the sulcal banks, rather than in real-world units. The depth values range from positive values at the crown of a gyrus to negative values at the fundus of a sulcus. Furthermore, we computed the mean cortical thickness in each label, as provided by FreeSurfer. As measure for the size of the sulcal segment, we computed the number of vertices that the surface label spanned on the native surface.
Functional MRI Experimental Design
The 20 subjects who provided structural and functional data took part in an fMRI study on speech production and laryngeal motor control. The experimental design, processing, and fMRI results of this study have been reported elsewhere in detail (Eichert et al. 2020a) and are here only briefly described. In a functional localizer task, subjects were asked to perform repeated lip protrusion or tongue retraction at a rate of approximately 1-2 reps/s. The subject’s breathing pattern was explicitly controlled using the fixation symbol on the screen, instructing them to inhale for 1.5 s and exhale for 4 s. A ‘breathing only’ condition, during which the subjects followed the same breathing pattern, was acquired as baseline condition. Each task condition was performed in blocks lasting 22 s followed by a rest period of 8 s with normal breathing. The conditions were presented in a fixed pseudo-random order following a balanced Latin-square design wherein each condition was repeated four times.
In a separate task, subjects were instructed to produce a syllable sequence (/la leɪ li la leɪ li/) under four different conditions: overt speech, silent mouthing, only vowel production and covert speech. Breathing instructions, task timing and randomization of the four blocks were the same as described for the localizer task, except that each condition was repeated five times. In a third task, subjects performed a phonological and semantic judgement task. Participants had to indicate a yes/no response by pressing a button with the right index or the middle finger every 3 s. This task was analyzed as a localizer for the hand region in the left hemisphere.
Functional MRI Data Analysis and Statistical Analysis
Functional MRI data processing was carried out using FEAT (FMRI Expert Analysis Tool) Version 6.00, part of FSL (FMRIB’s Software Library, www.fmrib.ox.ac.uk/fsl) including motion correction of the images and unwarping using a fieldmap (Jenkinson 2003). Time-series statistical analysis was based on a general linear model (GLM) implemented in FILM with local autocorrelation correction (Woolrich et al. 2001). Standard motion correction parameters and individual volumes that were motion outliers, determined using fsl_motion_outliers, were included as separate regressors at the first level for each subject. Registration to the high-resolution structural scan and standard 2-mm MNI template was carried out using FLIRT. Registration from high resolution structural to MNI space was then further refined using FNIRT nonlinear registration (Andersson et al. 2007).
In the functional localizer task for lip and tongue movement, activity during each condition was assessed relative to the ‘breathing only’ condition. For the syllable production task, the conditions were analyzed in a factorial model that allowed separation of the (supralaryngeal) articulation and the (laryngeal) vocalization components of the task. Brain activity associated with the control of supralaryngeal articulation was defined as (‘overt speech’ minus ‘vowel production’) plus (‘silent mouthing’ minus ‘covert speech’) and the main contrast for vocalization was derived by the contrast (‘overt speech’ minus ‘silent mouthing’) plus (‘vowel production’ minus ‘covert speech’). The task activations from the ‘articulation’ contrast are not further discussed in this manuscript.
In both tasks described above, the rest blocks with normal breathing served as baseline, which means that they were not modelled in the GLM. For the hand localizer task, we derived a contrast of all conditions involving button presses relative to a resting baseline. Note that this task only provided data to analyze the hand representation in the left hemisphere.
Individual Surface Activation Maxima
To assess inter-individual variability of the fMRI results, we derived the location of individual activation maxima for hand, lip, and tongue movement, and larynx activity during vocalization. Activation maxima were derived using the steps described in Eichert et al. (2020a), which are reported here only briefly. ROI definitions are described in more detail in the supplementary material.
Different volumetric ROI masks were used for the different motor representations based on individual anatomy in both hemispheres. We used an ROI of the whole central sulcus for hand, lip and tongue, based on the Destrieux Atlas. For the dorsal larynx representation, we used a more limited portion of the central sulcus ROI (MNI z-coordinates: 50 – 30). For the ventral larynx representation, we manually defined an ROI based on individual surface landmarks.
Individual volumetric ROIs were linearly transformed from FreeSurfer’s anatomical to functional space of the respective task fMRI scan. Within the ROI, the voxel of maximal intensity was determined from the uncorrected z-statistics image. It should be noted that for some subjects this local maximum did not achieve the corrected voxel-wise significance threshold. Using a lower uncorrected threshold is justified given our goal to visualize and assess spatial variability of the activation maxima. Activation maxima were manually inspected in the subject’s native volume space to confirm that the systematic approach described below captured task-related activations. The activation maxima were mapped to the individual’s native midthickness surface, resampled to the 32k standard (fs_LR) surface mesh using the FreeSurfer registration, smoothed (FWHM = 1 mm), and binarized to form a small circular patch.
Structure-to-Function Relationship
Next, we examined the spatial relationship between the sulcal segments, and the task activation peaks at the individual subject level. This analysis was performed in the 20 subjects who contributed both task and structural data. Individual task activation peaks were mapped onto the individual’s cortical surface as described above for sulcal segments.
In order to characterize the structure-to-function relationship at the group level, we aligned all individual surfaces based on the anatomical surface labels and then we applied the same registration to individual task activation peaks. This approach allowed us to visualize individual variability in the spatial distribution of task activation peaks in a common group-level space.
The registration of sulcal labels was driven by the binary labels for cs_1, cs_2, cs_3, cs_4, cs_5, ascs_lat, ascs_op and pscs and performed using multimodal surface matching (MSM, Robinson et al. (2014). As target, or reference, for the MSM-based registration, we used the normalized and thresholded (> 0.4) average labels after projecting all of them to the same regular sphere (approximately 32,000 vertices). Each subject’s sulcal maps and the reference sulcal maps were merged into a combined file with six data arrays. Then, we derived a registration using MSM for each subject.
We explored how manual labeling of sulcal segments can help to align data across subjects. Therefore, we compared our registration based on sulcal segments with the FreeSurfer registration and a registration based on sulcal depth maps. The FreeSurfer registration and sulcal depth maps were provided by the HCP-processing pipeline. To derive a registration based on sulcal depth, we used MSM default settings. To characterize the effect of the registrations, we quantified the spatial spread of the fMRI activation peaks: For each effector, we computed the median geodesic distances across all 20 activation peaks. A smaller spatial spread of activation peaks indicates a better registration performance.
Results
Sulcal Pattern of the Subcentral Region
The sulcal anatomy of the subcentral region was examined in a total of 100 hemispheres (n = 50 brains) and the morphological patterns encountered were classified into five types (Fig. 2). The most commonly observed configuration of subcentral sulci (Type 1, 44 % of hemispheres) is shown in Fig. 1b, c. In the Type 1 configuration, the central sulcus does not extend ventrally to meet the lateral fissure. The fifth and most ventral segment of the central sulcus (cs_5) is typically short and forms a curve in an anterior direction. The lateral segment of ascs (ascs_lat) is visible on the lateral surface of the brain and is clearly separate from the central sulcus. Dorsally, the ascs_lat extends into the precentral gyrus with variable length. Ventrally, the ascs_lat continues into the opercular cortex, which is hidden within the lateral fissure of the brain. A small gyral bridge separates the ascs_lat from the opercular segment of ascs (ascs_op), which continues medially until it reaches the circular insular sulcus (cris). The medial origin of the ascs_op can be identified at a curve of cris, which is formed by the posterior short insular gyrus just anterior to the central insular sulcus (cis). Posterior to ascs_op, the posterior subcentral gyrus (pscs) can be found, which extends laterally towards the lateral fissure. The medial origin of pscs can be identified at a curve of cris posterior to cis, which is formed by the anterior long insular gyrus. The number of curvatures of cris and the number of subcentral sulci is variable, but the ascs_op and the pscs could be reliably identified in every subject examined. The morphology of all of the mentioned sulci is variable across subjects, but the description of morphological sub-types below focusses on the configuration of the ascs_lat.

Morphological patterns. Schematic drawings illustrating the main morphological patterns of the subcentral region formed by the ascs_lat with neighbouring sulci. Type 1: Canonical configuration observed in the majority of hemispheres (also shown in Fig. 1b). Type 2: ascs_lat merged with the central sulcus. Type 3: ascs_lat merged with ascs_op. Type 4: ascs_lat merged with the inferior ramus of iprs. Type 5: ascs_lat anterior to ascs_op
Different Types of Morphological Patterns
The subcentral region exhibits high inter-individual variability regarding the configuration of the ascs_lat. The observed occurrences of morphological types are reported in Table 1. In addition to the canonical (Type 1, 44 % of hemispheres) configuration described above, it was commonly observed that the ascs_lat merged with the central sulcus (Type 2, 20 %) (Fig. 2). In these cases, the ascs_lat remains mostly on the lateral brain surface and does not reach into the opercular cortex. The ascs_op extends further lateral and its extension is visible on the lateral brain surface. Another commonly observed sub-type was identified by a more opercular position of the ascs_lat (Type 3, 18 %). In Type 3, the ascs_lat is less visible on the lateral surface and the central sulcus extends further ventral towards the lateral fissure. Type 3 is also characterized by a reduced gyral bridge separating the ascs_lat from the ascs_op. In six cases, the opercular continuation of the the ascs_lat curved posteriorly and merged with pscs instead of the ascs_op (not shown as separate type). In several cases, we also observed the ascs_lat to merge with the inferior ramus of the inferior precentral sulcus (iprs-i) (Type 4). When ascs_lat and iprs-i merge, the ventral continuation of ascs_lat curves in an anterior rather than a posterior direction and the position of ascs_lat is more lateral than opercular. In a few cases (Type 5) the position of the ascs_lat was notably further rostral so that it was positioned anterior to ascs_op rather than posterior as in the other configurations.
Morphological subtypes of the subcentral region. Observed frequencies of morphological patterns based on 100 examined hemispheres (LH – left hemisphere; RH – right hemisphere).
Strong hemispheric differences were observed in the occurrences of the morphological types (Table 1). Type 2 (ascs_lat merged with cs_5) is much more common in left hemispheres (85% vs. 15 %), while Type 4 (ascs_lat merged with iprs) and Type 5 (ascs_lat further anterior), are more common in right hemispheres (75 % vs. 25 % for Type 4; 83 % vs. 17 % for Type 5), although both types are infrequent. For Type 1 (canonical configuration) and Type 3 (ascs_lat merged with ascs_op) no pronounced hemispheric differences were observed.
Spatial Probability Maps
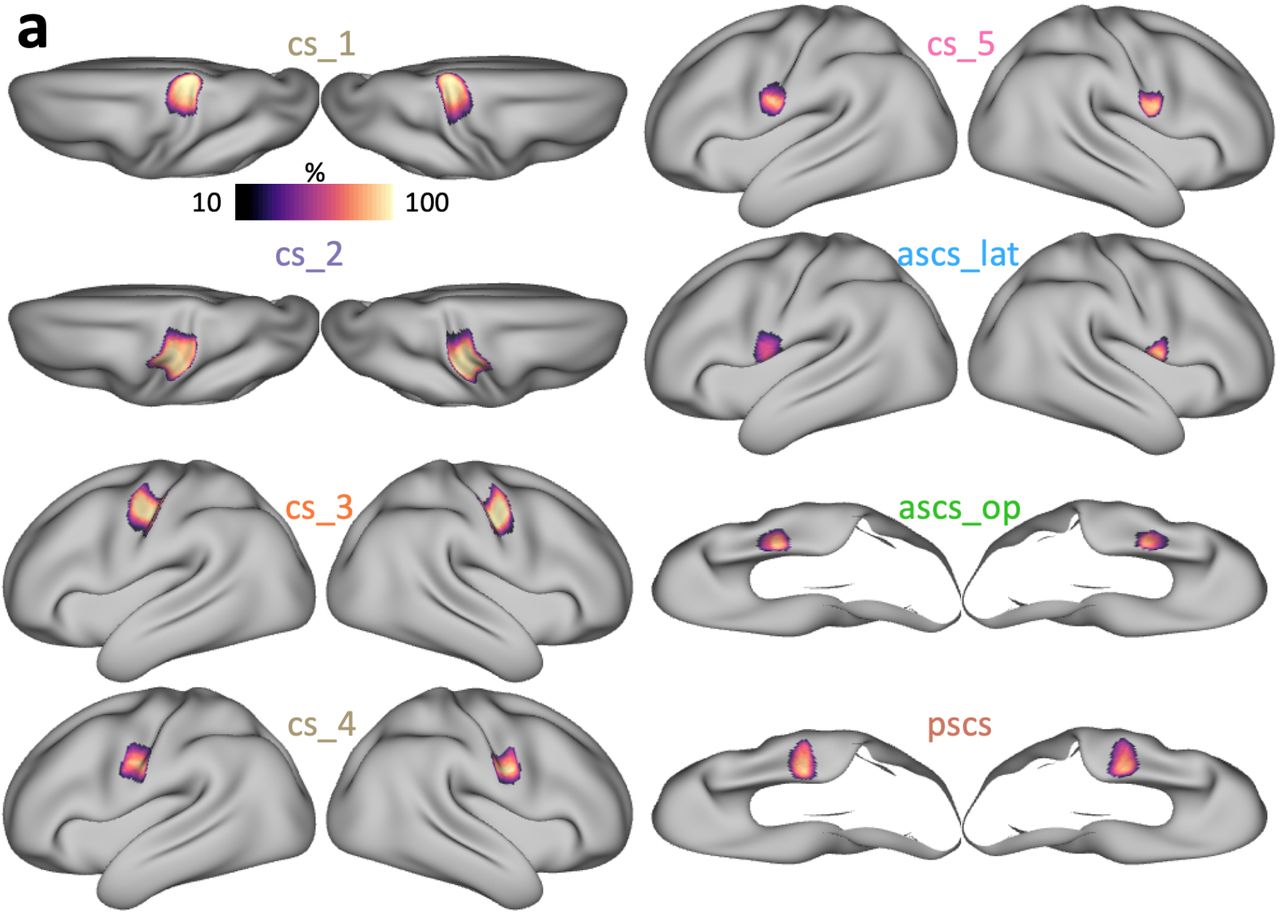
The morphological variability of the central sulcus segments and the subcentral sulci was quantified and visualized using spatial probability maps in 2D surface space and 3D volumetric space (Fig. 3). For both surface and volume probability maps, intensity values decrease from the center of the map towards the edges, which is typical for overlap maps. Values in the volumetric probability maps are overall lower given that they capture variability in three spatial dimensions. The pattern of values across sulci and hemispheres, however, is consistent across surface and volumetric probability maps. For all sulci, hemispheric differences were observed with regard to the location in volume space (Fig. 3b). All sulcal segments in the left hemisphere are located consistently further posterior compared to the segments on the right hemisphere, which is in line with the Yakovlevian anticlockwise torque of the two hemispheres (see Table 2 for coordinates of the voxel of maximal probability and for the center of gravity for each label).

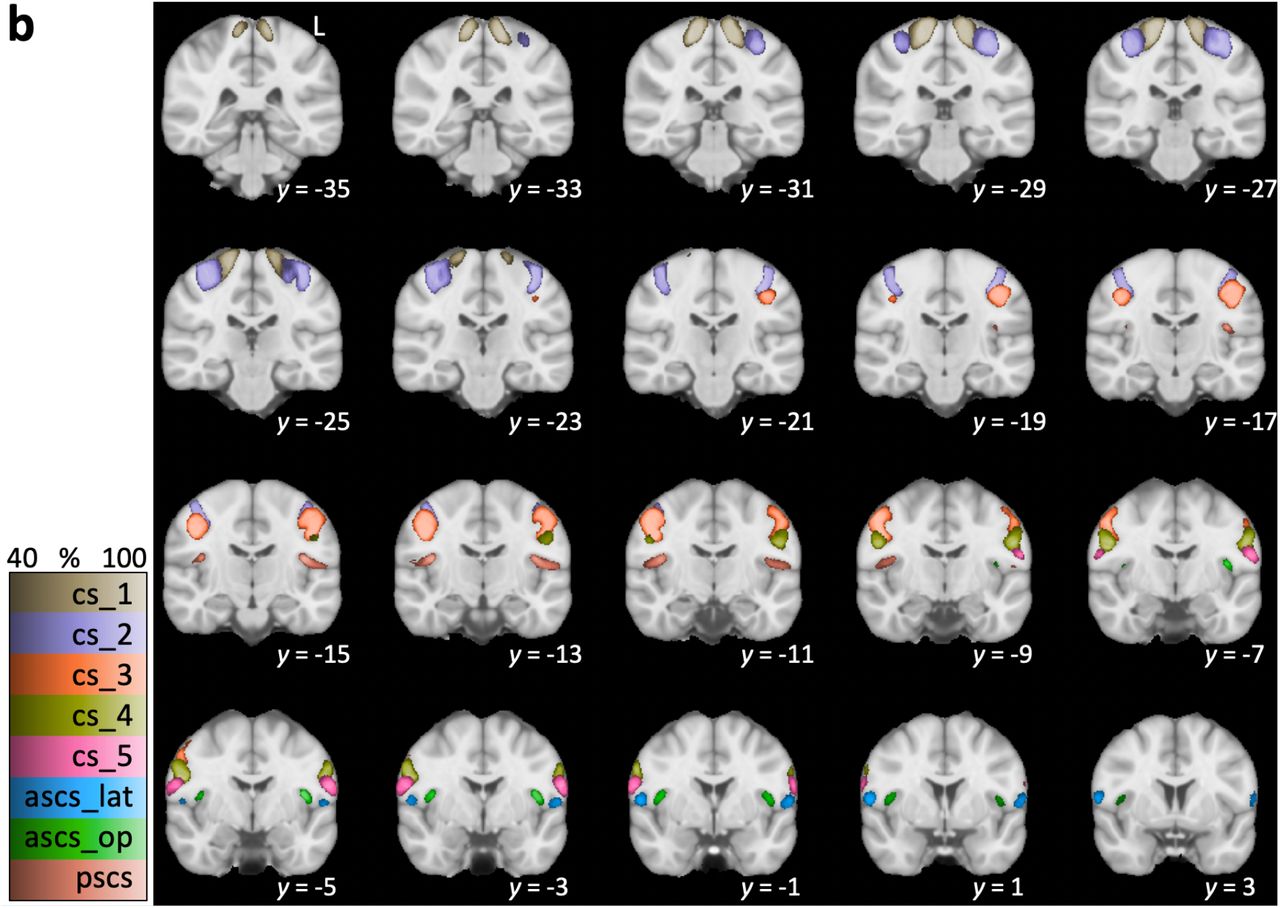
Spatial probability maps. a Surface probability maps of central and subcentral sulcal labels shown on an inflated average surface (n = 50). Labels for cs_1 and cs_2 are shown from a dorsal perspective. Labels for ascs_op and pscs are shown from a ventral perspective with the temporal lobe removed for better visibility of the opercular cortex. Intensity values show the amount of overlap with 100 % indicating an overlap in all subjects. b Volumetric probability maps overlaid onto the standard MNI template (n = 50). L – left hemisphere shown on right side of the image. Intensity values show the amount of overlap across subjects. Color maps for the different sulci have been matched in luminance so that brighter colors indicate a higher overlap
Coordinates of spatial probability maps. Shown are the MNI-coordinates (x, y, z) of each sulcal segment’s voxel showing maximal overlap and the center of gravity in the volumetric probability maps in left and right hemisphere.
The first three segments of the central sulcus (cs_1 - 3) show high inter-individual spatial consistency, which is characterized by high values, i.e. overlap, in the probability maps. Consistency is lower for cs_4 and cs_5. Maximal values in the probability map for quantitative comparison are provided in Fig. 4. Consistency is also low for the subcentral sulci (ascs_lat, ascs_op, pscs) with lowest consistency for ascs_lat, especially in the left hemisphere. The hemispheric effect for the ascs_lat is evident in both surface and volumetric probability maps. It was observed that the ascs_lat is more variable on the left hemisphere (see for example Fig. 5, slice y = 1). The low consistency in ascs_lat is in line with the variable morphological subtypes that were described above. The two subcentral sulci, ascs_op and pscs, are less consistent than the central sulcus segments, but more consistent than the ascs_lat.

Anatomical measures for sulcal segments. Surface probability quantifies the absolute value of maximal percentage for the overlap of sulcal labels as shown in Fig. 3a. A low probability indicates high inter-individual variability. A more negative sulcal depth indicates a deeper sulcus. Bars for sulcal depth, cortical thickness and sulcal area show mean values ± 95 % confidence intervals (n = 50 for each hemisphere)

Structure-to-function relationships. a Individual sulcal labels and activation maxima for subjects, where both anatomical and functional data were available (n = 20). Only the central strip of the brain is shown. For colour legend see b. b Location of individual activation peaks with respect to the sulcal maps after applying the sulcal registration (ascs_op is not visible). The sulcal outlines show the averaged, normalized and thresholded (> 0.4) sulcal labels after registration. Brighter colors indicate overlapping peaks
Anatomical Characterization of Sulcal Segments
In addition to probability maps, we characterized the sulcal segments based on sulcal depth, cortical thickness and sulcal area of the surface label (Fig. 4). It can be observed, that the first three central sulcus segments (cs_1 to cs_3) are deeper than cs_4 and cs_5. Note that the sulcal depth measures are expressed in normalized FreeSurfer units, rather than in real-world values. The ascs_lat is notably shallower than the other segments. Cortical thickness increases from dorsal to ventral and is highest in the two subcentral sulcal segments (ascs_op, pscs). The largest sulcal segment, as indicated by sulcal area, is cs_2, especially in the left hemisphere. Cs_4 and cs_5 are notably smaller than the other central sulcus segments. None of the three measures described show a hemispheric difference for ascs_lat, unlike the surface probability maps, which demonstrate greater variability, i.e. less overlap, in the left hemisphere. Given that handedness of the HCP subjects was not accessed, we did not assess how this affected the measures described above. Regardless of handedness, however, it must be assumed that the majority of the 50 subjects would be left lateralized for language. In the supplementary material, we report the anatomical measures depending on the morphological subtype of the subcentral region (Supplementary Material, Fig. 7). While minor deviations from the patterns described in Fig. 4 can be observed, overall, the anatomical characteristics for the sulcal segments is similar across all morphological subtypes.
Sulcal Registration and Structure-to-Function Relationship
All individual sulcal labels and functional activation peaks are shown in Fig. 5a. To visualize the spatial relationships on a group level, we first registered all individual surfaces based on the binary sulcal labels using MSM. After registering the sulcal labels, we averaged all transformed sulcal labels and thresholded (> 0.4) the average labels to obtain the outlines of registered sulcal segments. Fig. 5b shows the outlines of the registered sulci, which demonstrates an orderly dorsal-ventral configuration of the sulcal segments.
Next, we applied the registration that was used to transform individual surface labels to the group space to the functional activation peaks of different effectors in individual subjects. Fig. 5b shows the location of the resampled activation maxima in relation to the outlines of the registered segments. Given that the same registration was applied to individual sulcal labels and the peaks, the location of resampled peaks with respect to the registered sulci reflects the original spatial relationship on the native surfaces of the individuals.
Overall, a strong correspondence between sulcal labels and functional peaks was observed. The observed relationships between labels and peaks are reported in Table 3. The majority of activation peaks from the hand localizer fall inside the center of cs_2. The dorsal peaks for larynx activity are found on the anterior bank of cs_3. Peaks from the lip localizer also fall within cs_3 and overlap with the location of the dorsal larynx peaks. Those for the lip, however, are reliably located at the more ventral extent of cs_3 whereas those for the dorsal larynx peaks span the segment. Activation peaks from the tongue localizer fall inside cs_4 with high consistency. The ventral peaks for larynx activity are associated with cs_5 and ascs_lat or with the gyrus in between, but the relationship is less consistent than for the other functional peaks.
Structure-to-function relationships. The numbers show the observed relationships between functional activation peaks (n = 20) and sulcal label underlying the peak depending on the hemisphere.
The relationship between sulcal label and effector is highly similar across hemispheres (Table 3). The only exception is the lip cluster in the right hemisphere, where several peaks are located in cs_4 rather than in cs_3. The group-level representation (Fig. 5b), however, demonstrates that this difference is driven by minor variations in the boundary between cs_4 and cs_3, rather than being a systematic hemispheric difference in the cortical location of the activity. The sulcal label underlying the ventral larynx peak was the same in both hemispheres for the majority of subjects (n > 12). Furthermore, we examined the relationship between morphological subtype of the subcentral region and the location of the ventral larynx peak. We observed no systematic relationship, i.e. all combinations of subtype and sulcal label are present. Given the low count number for each combination, a robust quantification of this observation is not feasible.
To characterize the effect of the sulcal registration on the spatial variability of functional peaks, we computed the median distance across all peaks for each effector. We compared this measure of spatial spread with that obtained from the FreeSurfer registration and a registration based on sulcal depth maps. Overall, the three registrations have a similar effect on the spatial variability (Fig. 6). Some differences can be observed across effectors, but with our sample size none of the effects are significant. For the lip cluster in the left hemisphere, spatial spread is increased for the registration based on sulcal labels, which is driven by an outlier (see Fig. 5b). Spatial variability of the ventral larynx cluster in the left hemisphere benefitted most from the sulcal-label registration.

Effect of anatomical registrations on functional variability. Distance of task activation peaks after registration based on FreeSurfer labels (blank bars), after registration based on whole-brain sulcal depth maps (striped bars) and after registration based on manually drawn sulcal segment labels (dotted bars). The median distance ± 95% confidence interval is shown across all peaks for each task cluster (n = 20; 190 pairs of points for each cluster)

Discussion
We examined the morphological patterns and the inter-individual variability of the sulci in the subcentral region of the cerebral cortex in the human brain and their relation to activity evoked by movement. A robust relationship between morphological features of central and subcentral sulcal segments and movement of different effectors at the individual subject level was demonstrated. Cross-subject registration based on the individually drawn sulcal labels demonstrated that morphological variability explains functional variability in part.
Morphology of the Subcentral Cortex and the Central Operculum
The present study provided a systematic examination of the sulcal patterns of the subcentral and adjacent opercular cortical region in the human brain, including inter-individual variability of the sulcal morphology. In this region, one encounters an anterior and a posterior subcentral sulcus (ascs, pscs) (Petrides, 2012, 2019). We showed that, in the majority of subjects, the ascs consists of a distinct lateral (ascs_lat) and a distinct opercular segment (ascs_op).
The morphological patterns of the subcentral region were classified into five distinct subtypes, based on the configuration of ascs_lat. In addition to the canonical configuration (Type 1, Fig. 1b), the ascs_lat often merged with the central sulcus, so that the central sulcus complex extended further ventral towards the lateral fissure (Type 2). In Type 3, the ascs_lat merges with the inferior precentral sulcus (iprs). In Type 4, the position of the ascs_lat is notably more opercular and it merges with the ascs_op, so that the ascs_lat and ascs_op form one continuous sulcus. Type 5 is characterized by a more anterior position of the ascs_lat, compared with its position in the other types. The variability in the configuration of the lateral and opercular segments explains why the ascs appears as one continuous sulcus in a volumetric average of structural brain images in MNI space (Petrides, 2019).
Sulcal Labelling in Surface Space
We aimed to reproduce the segmentation of the central sulcus, as described in a volumetric labeling study (Germann et al., 2019). We labelled sulcal segments directly on the subject’s native cortical surface, rather than in volume space as traditionally done in several MRI-based labelling studies (Germann et al. 2005, 2019; Zlatkina and Petrides 2010; Amiez et al. 2013; Sprung-Much and Petrides 2018, 2019). We demonstrated the advantages of working in surface space as this is a more suitable representation of the sheet-like geometry of the cerebral cortex.
The anatomical landmarks critical for labelling are conveniently visualized in surface space and therefore more easily reproducible (Fig. 1b). We characterized the sulcal segments using several surface-based anatomical features. Further quantifications of geometrical and topological properties of interest for sulcus morphometry are readily available for surface labels (Mangin et al. 2004). Furthermore, using surface labels allowed us to perform a surface-based registration, where distances are represented as geodesic distances along the cortex rather than as Euclidean distances between voxels (Fischl et al. 1999; Klein et al. 2010). In the current study, the labels were drawn manually, but automatic labelling of sulcal segments is subject of ongoing research (Machlouzarides-Shalit et al.; Clouchoux et al. 2006; Takerkart et al. 2015; Borne et al. 2020).
Spatial Probability Maps
We visualized the morphological variability and spatial extent of the central sulcus segments and the subcentral sulci in surface and volumetric probability maps. The first three central sulcus segments show the highest spatial consistency across subjects. Consistency decreases for the fourth and even further for the most ventral (fifth) segment of the central sulcus, which is in line with previous observations (Germann et al., 2019). The decrease in probability values for cs_4 and cs_5 can also be attributed to their smaller spatial extent compared to the sulcal labels for cs_1-3. Consistency for the subcentral sulci ascs_lat, ascs_op and pscs is also notably reduced, which is in line with the inter-subject variability in the morphological patterns as described above.
Hemispheric Differences
The classification of morphological subtypes and the spatial probability maps revealed hemispheric differences in the subcentral cortex, indicating that the position of the ascs_lat along the rostro-caudal axis differs between hemispheres, but the dorso-ventral position does not. The ascs_lat in the left hemisphere tends to be located further posteriorly, which frequently results in a merge with the central sulcus, while the ascs_lat in the right hemisphere is located more anteriorly. Our quantifications showed that the ascs_lat is more variable in the left hemisphere, although other anatomical measures are not different across hemispheres.
The hemispheric difference in variability can be interpreted in relation to sulcal variability of the ventro-lateral cortex (Germann et al. 2005; Sprung-Much and Petrides 2018, 2019). Language processing is lateralized to the left hemisphere and the role of left inferior frontal cortex in language function is widely established (Broca 1861; Price 2000). Functional language lateralization is associated with structural asymmetries (Foundas et al. 1996; Josse and Tzourio-Mazoyer 2004) and increased regional variability (Croxson et al. 2018), but the structure-to-function relationships remain controversial (Dorsaint-Pierre et al. 2006; Sprung-Much and Petrides 2018). We presume that increased surface area in the left inferior frontal cortex affects the neighboring sulci so that the ascs_lat is ‘pushed’ to a relatively further posterior position in the left hemisphere. Despite the hemispheric differences in morphology, the structure-to-function relationships for basic movements of different effectors described below, did not exhibit notable differences between hemispheres.
Functional Activation Peaks and Morphology
Here, we demonstrated a tight link between individual morphological features of the cortex and activation peaks for the different effectors examined. We replicated the relationships between central sulcus segments and functional localizers for the hand, lip, tongue, and larynx described in Germann et al. (2019). We identified two larynx peaks, because more recent studies suggest that two separate regions in the central region correlate with larynx activity (Belyk and Brown 2017; Jarvis 2019; Eichert et al. 2020a). Germann et al., however, found only a ventral larynx peak. The difference across studies might be because our functional localizer differed substantially from the one used by Germann et al., where ‘humming’ was used as task instruction to localize larynx activity. Germann et al. found the ventral larynx peak to be associated with cs_5, but we showed that it was also localized in the ascs_lat in a large proportion of subjects (14 out of 40 hemispheres). This difference might be due to the significantly larger sample size in the current study, which allowed a more robust assessment of the relationships. A systematic location of the dorsal larynx peak relative to morphological features has been predicted before (Sun et al. 2016), but, to our knowledge, this is the first study that describes these relationships for both dorsal and ventral larynx representations and together with representations of the articulators.
It should be noted that the functional contribution of the two larynx representations in motor control during vocalization is still debated (Simonyan 2014; Belyk and Brown 2017). Quantifications of cortical microstructure, such as myelin content, indicate that the ventral larynx region is not located in primary motor cortex (Eichert et al. 2020a). The focus of the current study, however, is not the interpretation of the functional activation peaks per se, but to assess the relationship between their location and the underlying morphology. The individual variability in the cortical location of the ventral larynx representation could be one factor in explaining inconsistent reports in the literature.
No systematic relationship between morphological subtype and the sulcal label underlying the ventral larynx peak was observed. At the given sample size of 20 subjects, the total counts for each combination of subtype and sulcal label is low and, therefore, it is not practical to quantify the robustness of this effect. The current dataset, however, suggests that the sulcal label predicts the location of the maximal functional activation, irrespective of the morphological configuration formed by the sulci. Future research could elaborate on the functional significance of the morphological subtypes (Sun et al. 2016). Using an fMRI-paradigm that activates the opercular region more directly might reveal effects on the size of the activated area or the activation strength.
Relationship between Variability in Structure and Function
We observed a robust relationship between sulcal landmarks and the location of functional activation peaks for speech-related effectors. The somatomotor system, however, is only one example system, where a link between sulcal morphology and function at the individual subject level was established (Boling et al. 1999; Coulon et al. 2011; Zlatkina et al. 2016; Germann et al. 2019). Detailed anatomical and functional studies have also revealed these relationships for other parts of the cortex (Amiez et al., 2006; Bodin et al., 2018).
A registration based on individually drawn sulci showed an improved registration for the left ventral larynx representation, when compared to a registration based on sulcal depth and based on FreeSurfer labels, which rely on prominent and consistent landmarks, such as deep sulci. In many contexts, such as brain development or cross-species comparisons, the manual identification of sulcal landmarks is vital to constrain the registration algorithm when automatic labelling is inaccurate or infeasible (Van Essen and Dierker 2007; Lebenberg et al. 2018; Eichert et al. 2020b). Here we show, however, that manual identification of sulcal landmarks is also critical for registrations in the human brain, particularly in brain regions that are highly variable and have low gyrification. Although the activation peaks for the ventral larynx representation are not directly located in the subcentral opercular area, the more detailed anatomical information in this region is still helpful for the alignment. Our study emphasizes the importance of detailed anatomical investigations of sulcal segments and tertiary sulci in understanding the structure-to-function relationships in the cortex (Weiner et al. 2018; Miller et al. 2020).
In the current study, we examined gross-anatomical features of the brain surface, an approach that is directly applicable to neuronavigation and neurosurgical planning. Recent advances in neuroimaging, however, allow us to acquire multiple image modalities in the same subjects, some of which correlate with the underlying cellular microstructure (Fischl and Dale 2000; Zhang et al. 2012; Weiskopf et al. 2013). Although the histological analysis of post-mortem brains remains the gold standard to define anatomical parcels of the brain, neuroimaging has become a versatile tool for parcellating the cortex and to establish relationships between different modalities (Glasser et al. 2016; Jakobsen et al. 2018; Smith et al. 2019; Eichert et al. 2020b). Future work will show how detailed morphological labelling and segmentation studies can benefit from other neuroimaging modalities.
In summary, the current study demonstrated a robust relationship between morphological features of the central and subcentral sulcal segments and movement of different effectors at the individual subject level. We described the morphological patterns of the sulci in the subcentral and central opercular cortical region, their inter-individual variability and several anatomical properties. Laryngeal activity during vocalization activates the subcentral region, which we found to be highly variable across participants. This variability could explain inconsistencies in previous reports about a ventral larynx representation.
Supplementary Material
Anatomical Characterization of Sulcal Segments based on Morphological Subtypes
Regions-of-Interest to derive Maxima during Task Activation
The definition of regions of interest is described, in detail, in Eichert et al. (2020a) and is here repeated in a modified version. The central sulcus ROI used for the hand, lip and tongue was defined using FreeSurfer’s automatic volumetric labelling based on the Destrieux Atlas.
For the larynx, we identified two activation maxima in separate ROIs: One for the dorsal and one for the ventral larynx representation. The dorsal larynx ROI was a portion of the same central sulcus ROI used above from z-coordinates in MNI space of 50 - 30. The limits were determined empirically, so that ROI did not capture the ventral larynx representation or an unrelated supra-dorsal activation in the trunk area, which was observed in some individuals (Foerster 1931).
The ventral larynx representation lay outside the central sulcus and was located ventrally in the subcentral part of cortex. Because of the high inter-individual morphological variability in this region, the ventral larynx ROI was derived manually based on individual anatomy in surface space. A liberal surface ROI was drawn on each individual’s midthickness surface covering the ventral part of the central sulcus and adjacent gyri. Anteriorly, the ROI was delineated by the inferior portion of the precentral sulcus and posteriorly the ROI spanned the postcentral gyrus. If present, the lateral portion of the anterior sulcus in the subcentral gyrus was included within the ROI. The dorsal limit of the ROI was defined by a horizontal plane across the gyrus at the level of the usual location of the posterior ramus of the inferior precentral sulcus. The ventral larynx surface ROI was converted into a volumetric ROI covering the underlying cortical ribbon using wb_command. We checked that the ventral larynx ROI did not overlap with subjacent auditory cortex in the temporal lobe or inferior frontal cortex.
In some subjects, the main contrast for vocalization in the syllable production task had additional activity related to articulation of the tongue. To remove this, we transformed the coordinates for each individual’s maximal voxel from the tongue contrast (from the basic localizer task) to the functional space of the syllable production task (task 1) using rigid-body transformation and then derived a spherical ROI (7 voxels diameter) around it. This sphere was used to mask the z-statistic image of the main contrast for vocalization prior to localizing the maxima for laryngeal activity in the dorsal and ventral ROIs described above.
Animation of one Individual’s Sulcal Segments
Online Resource 1
The animation shows the 3D rendering of one individual’s sulcal segments in native volume space. Shown is the same subject as in Fig. 1 using the same color legend.
Declarations
Funding
N.E. is a Wellcome Trust Doctoral student in Neuroscience at the University of Oxford [203730/Z/16/Z]. N.E. was supported by a Lazlo and Etelka Kollar Brain@McGill Graduate/Postgraduate Travel Grant awarded by the Oxford McGill Zürich Partnership in the Neurosciences. The project was supported by the NIHR Oxford Health Biomedical Research Centre. The Wellcome Centre for Integrative Neuroimaging is supported by core funding from the Wellcome Trust [203139/Z/16/Z]. The work of R.B.M. is supported by the Biotechnology and Biological Sciences Research Council (BBSRC) UK [BB/N019814/1] and the Netherlands Organization for Scientific Research NWO [452-13-015]. The work of M.P. is supported by CIHR Foundation Grant FDN-143212.
Conflicts of interest
The authors declare no competing financial interests.
Compliance with Ethical Standards
HCP subjects: The Ethical standards are fully described in the core HCP literature referenced in the main body. The remaining subjects were part of a study that had been approved by the Central University Research Ethics Committee of the University of Oxford (CUREC, R55787/RE001) in accordance with the regulatory standards of the Code of Ethics of the World Medical Association (Declaration of Helsinki). All subjects gave informed consent for their participation.
Availability of data and material
Anatomical raw data of the subjects that provided structural and functional data is publicly available at OpenNeuro under the accession code ds002634. The minimally pre-processed data of the HCP subjects is openly available for download at https://db.humanconnectome.org. Upon acceptance of the manuscript, derived data supporting the findings of this study will be made available from the Wellcome Centre for Integrative Neuroimaging’s GitLab at git.fmrib.ox.ac.uk/neichert/project_variability.
Code availability
Upon acceptance of the manuscript, processing code will be made available from the Wellcome Centre for Integrative Neuroimaging’s GitLab at git.fmrib.ox.ac.uk/neichert/project_variability. Parts of the processing code is already available at git.fmrib.ox.ac.uk/neichert/project_larynx. FSL tools, including MSM, are available from fsl.fmrib.ox.ac.uk. Connectome Workbench is available at www.humanconnectome.org/software/connectome-workbench.html.
Author Contributions
Conception and design: NE, MP. Acquisition of data: NE, KEW. Analysis and interpretation of data: NE, KEW, RBM, MP. Original draft: NE, MP. Revising the article: NE, KEW, RBM, MP. Contribution of analytic tools: NE, RBM.
Footnotes
References


