

Abstract
In flowering plants, heterochromatin is demarcated by the histone variant H2A.W, elevated levels of the linker histone H1, and specific epigenetic modifications, including DNA methylation and H3K9 methylation. How H2A.W regulates heterochromatin organization and interacts with other heterochromatic features is unclear. To analyze the in vivo function of H2A.W, we created a h2a.w null mutant via CRISPR-Cas9, h2a.w-2. We found that H2A.W is not essential for plant development, and that loss of H2A.W did not perturb histone methylation patterns. In contrast, we found a reduction of non-CG DNA methylation in pericentromeric heterochromatin and an increase in DNA methylation at euchromatic sites targeted by the RNA-directed DNA methylation pathway. Loss of DNA methylation in h2a.w-2 correlated with both increased H1 occupancy and decreased DNA accessibility at heterochromatin. Our results indicate that H2A.W helps stabilize the accessibility of heterochromatin and facilitates efficient DNA methylation by fine tuning the genomic distribution of H1.
Introduction
Eukaryotic genomes are packaged in chromatin. The basic unit of chromatin is the nucleosome, which contains a protein octamer comprising two of each of the core histones H2A, H2B, H3, and H4, wrapped by ∼147bp of DNA. Chromatin is organized into two distinct domains termed constitutive heterochromatin, which is enriched in transposable elements (TEs) and other types of repetitive DNA, and euchromatin, which comprises mostly protein-coding genes. Euchromatin is more accessible and associated with transcriptional activity, whereas heterochromatic domains prevent transcription and are often compacted into higher order structures such as chromocenters in Arabidopsis thaliana and mouse nuclei. Yet, heterochromatin has to retain a certain degree of accessibility to allow important DNA-related biological processes to occur, including maintenance of DNA methylation, DNA replication, DNA damage repair, and transcription for small RNA production.
In most eukaryotes, euchromatic and heterochromatic regions can be distinguished by their DNA methylation level, the presence of distinct post-translational modifications of histones, and their association with specific histone variants. In plants, DNA methylation occurs in three sequence contexts (CG, CHG, and CHH, where H is any base but G). DNA methylation in euchromatic regions tends to be low, except at CG sites over gene bodies of protein-coding genes. Heterochromatic sequences, however, are characterized by dense methylation at all three sequence contexts (CG and non-CG methylation). In Arabidopsis, heterochromatin is additionally decorated with histone H3 lysine 9 mono and dimethylation (H3K9me1 and H3K9me2), catalyzed by the SU(VAR)3–9 HOMOLOG-class of histone methyltransferases SUVH4/KYP, SUVH5, and SUVH6 1. The mechanisms that establish and maintain heterochromatin-specific non-CG methylation and H3K9 methylation are tightly and reciprocally interconnected 2–5. The DNA methyltransferases CMT2 and CMT3 are recruited by H3K9me1 and H3K9me2 2, while the H3K9 methyltransferases SUVH4/5/6 are recruited to chromatin by DNA methylation 6–8, creating a positive feedback loop that reinforces silencing. DNA methylation in plants is also established and maintained via the RNA-directed DNA methylation (RdDM) pathway, which preferentially targets short euchromatic TEs and the edges of long heterochromatic TEs 2,3,9. Recruitment of RNA polymerase IV during the early steps of RdDM involves SHH1, which binds methylated H3K9, thereby also linking RdDM targeting to H3K9 methylation 10,11. Arabidopsis heterochromatin is also marked by H3K27me1, which depends on the redundant histone methyltransferases ARABIDOPSIS TRITHORAX-RELATED 5 and 6 (ATXR5, ATXR6) 12. Although heterochromatin structure is visibly altered in atxr5 atxr6 mutants, DNA methylation and H3K9me2 appear largely unaffected, suggesting that H3K27me1 is maintained independently of these marks.
The linker histone H1, which binds nucleosomes and the intervening linker DNA, is also preferentially associated with heterochromatin in Arabidopsis 13–17. In Arabidopsis, H1 associates with chromatin independently of DNA methylation, but loss of H1 leads to chromocenter decondensation, and has varying effects on DNA methylation: pericentromeric heterochromatic TEs gain DNA methylation in h1, while TEs on the chromosome arms lose methylation 15,18–20. H1 is thought to hinder heterochromatic DNA methylation by restricting the access of DNA methyltransferases to these regions 3,21. The joint action of H1 and CG methylation by the DNA methyltransferase MET1 silences a subset of TEs and prevents the production of aberrant gene transcripts, suggesting DNA methylation and H1 help define functional transcriptional units 15. The histone variant H3.3 also plays a role in restricting H1 from associating with active genes in Arabidopsis 17, Drosophila 22, and mouse 23. However, the mechanisms that control H1 deposition and shape its relative enrichment in heterochromatin remain unknown.
In Arabidopsis, the histone variant H2A.W is strictly and specifically localized to constitutive heterochromatin 24,25. This is in contrast with the other three H2A variants, replicative H2A, H2A.X, and H2A.Z, which are primarily associated with protein-coding genes 24,26. Arabidopsis has three H2A.W isoforms, H2A.W.6, H2A.W.7, and H2A.W.12, encoded by HTA6, HTA7, and HTA12 respectively. To characterize the role of H2A.W in Arabidopsis heterochromatin, a previous study generated a triple-knockout hta6 hta7 hta12 line, referred here to as h2a.w-1 24.
However, we identified a large genomic rearrangement in the hta6 transfer-DNA (T-DNA) insertion mutant allele used to generate the h2a.w-1 triple knockout line. Using CRISPR-Cas9, we obtained a new null h2a.w triple mutant without this rearrangement, referred to here as h2a.w-2. Analyzing h2a.w-2 mutants revealed that the hta6 chromosomal rearrangement, which led to a duplication of the CMT3 locus, was responsible for the severe developmental effects and CHG hypermethylation reported in h2a.w-1 24. These defects hindered functional analysis of H2A.W. Using the new mutant h2a.w-2, we now show that loss of H2A.W results in no visible developmental or morphological phenotypes and has only minor effects on gene and TE expression. In contrast, chromocenter condensation is affected in h2a.w-2, accompanied by a marked decrease in DNA accessibility, decline in non-CG methylation, and increased deposition of the linker histone H1 at regions normally occupied by H2A.W. Based on these results, we propose that H2A.W fine-tunes the accessibility of heterochromatin by hindering the deposition of H1, thus facilitating access for non-CG DNA methylation factors.
Results
A large chromosomal translocation in hta6 obscured functional analysis of H2A.W
To investigate whether H2A.W plays a role in controlling TE mobilization, we used available Whole Genome Bisulfite Sequencing (BS-seq) data of h2a.w-1 triple mutants and their corresponding wild type (WT) 24. We detected significantly increased copy numbers for several TEs (Supplementary Table 1), but because these TEs were all located within the same genomic region on the right arm of chromosome 1, we suspected that this result reflected a chromosomal rearrangement in the h2a.w-1 plants, rather than a genuine role for H2A.W in controlling activity of this TE subset. Further analysis of h2a.w-1 BS-seq and RNA-seq data revealed abnormally high coverage along an approximately 5 Mb region of chromosome 1, indicating that this region may be duplicated in h2a.w-1 (Fig. 1a, Supplementary Fig. 1a). Southern blot analysis of hta6 SALK_024544.32 (hereafter named hta6-1), hta7 (GABI_149G05.01), and hta12 (SAIL_667_D09) DNA confirmed the presence of a genomic rearrangement, likely a translocation of part of chromosome 1, in hta6-1 (Fig. 1b). Further analyses revealed a ∼5 Mb deletion in chromosome 1 which is replaced by T-DNA/vector sequences, and a translocation of a part of chromosome 1, flanked by T-DNA sequences, to chromosome 5 (Supplementary Fig. 1b). Using segregating plants from crosses between wild-type and hta6-1, we were able to recover hta6-1 mutants with either normal or doubled dosage of the chromosome 1 region. The plants with normal dosage showed a WT-like phenotype, while plants with doubled dosage were abnormally small (Supplementary Fig. 1b), suggesting that increased dosage of this portion of chromosome 1 causes developmental defects.

(a) Sequencing coverage of published h2a.w-1 BS-seq data 24, averaged in 1 kb bins across chromosome 1. The red line shows the smoothed conditional mean (LOESS). The black arrowhead indicates the genomic location of CMT3. See also Supplementary Fig 1a. (b) Zoomed-in view of plot in (a) across the left border of the chromosome 1 region showing increased coverage in h2a.w-1 (top panel). DNA gel blot analysis of the chromosome 1 region showing abnormal coverage in h2a.w-1 in the indicated T-DNA insertion mutants (lower panel). Genomic DNA of the indicated genotypes was digested with SspI (recognition sites indicated by red ticks on the thick black line) and hybridized with a fragment corresponding to the genomic region indicated in red under the plot. (c) The hta6-2 CRISPR-Cas9 mutant allele. Diagram of the HTA6 gene showing the insertion of a G (in red) in hta6-2, which creates a frame shift 89 bp downstream from the translation initiation site and an early stop codon (asterisk) 195 bp downstream from the translation initiation site. (d) Western blot showing total loss of H2A.W in h2a.w-1 and h2a.w-2. Nuclear extracts of the indicated genotypes were analyzed using antibodies directed against H2A.W.6, H2A.W.7, total H2A.W, and H3. (e) Representative images of wild-type, hta6-2, and h2a.w-2 plants (scale bar = 1 cm). Both hta6-2 and h2a.w-2 mutants develop like wild-type Col-0 plants.
Using targeted mutagenesis via CRISPR-Cas9, we generated a new hta6 allele (hta6-2) carrying a single-base frame shift mutation that causes a stop codon early in the protein (Fig. 1c). Western blot confirmed that hta6-2 is a null mutant for H2A.W.6 (Fig. 1d). We crossed hta6-2 with hta7 and hta12 to obtain the new null triple mutant, h2a.w-2. Western blot analysis confirmed that H2A.W is completely absent in h2a.w-2 (Fig. 1d and Supplementary Fig. 1c). h2a.w-2 plants are morphologically indistinguishable from wild-type plants (Fig. 1e), indicating that increased dosage of a large portion of chromosome 1, and not loss of H2A.W, caused the strong developmental defects reported in h2a.w-1 24. Instead, H2A.W appeared to be dispensable for Arabidopsis development. We therefore sought to clarify the function of H2A.W in heterochromatin transcription, composition, and organization.
H2A.W has little impact on transcription but is required for the efficient methylation of heterochromatic DNA
Previous analyses of the impact of H2A.W loss on transcription may have been confounded by the genomic rearrangement in h2a.w-1. We therefore re-explored whether lack of H2A.W affects genome-wide transcription by performing RNA-seq of WT and h2a.w-2. These analyses identified only a few differentially expressed protein-coding genes (PCGs; 78 upregulated, 52 downregulated) and only a handful of transcriptionally activated TEs in h2a.w-2 (Supplementary Fig. 2a, b). These results show that gene expression is not strongly affected in the absence of H2A.W, and that H2A.W alone does not play a significant role in repressing TEs.

(a) Average DNA methylation levels in the CG, CHG, and CHH sequence contexts, in 100 kb windows across chromosome 4 in WT and h2a.w-2. (b) Metaplots of CG, CHG, and CHH methylation levels over TEs in pericentromeres and chromosome arms in WT and h2a.w-2. TEs were aligned at the 5’ (left dashed line) and 3’ end (right dashed line), and sequences 3 kb upstream or downstream were included, respectively. Average methylation over 100 bp bins is plotted. (c) Metaplots of CG and CHG methylation levels over H2A.W peaks in the chromosome arms and pericentromeres. (d) Locally weighted scatterplot smoothing (LOESS) fit of CG, CHG, and CHH methylation levels in WT and h2a.w-2 calculated in 50 bp windows and plotted against TE size. (e) Kernel density plots of CHG and CHH DNA methylation differences between h2a.w-2 and WT at CMT2-dependent and DRM1/2-dependent regions.
The chromosomal rearrangement in h2a.w-1 caused a duplication of the gene encoding CMT3 (Fig. 1a, Supplementary Fig. 1a) and this duplication was likely responsible for the higher levels of CHG methylation previously reported in h2a.w-1 24. Indeed, we found that CMT3 mRNA was significantly increased in hta6-1 and in h2a.w-1 carrying additional CMT3 gene copies (Supplementary Fig. 2c). However, CMT3 expression in h2a.w-2 was similar to WT (Supplementary Fig. 2c), indicating that CMT3 transcription is not affected by loss of H2A.W. We were also able to recover h2a.w-2 cmt3 quadruple mutant plants, which had no obvious developmental defects (Supplementary Fig. 2d), indicating that the lethal genetic interaction between h2a.w-1 and cmt3 24 was due to the chromosomal rearrangement in hta6-1.
We therefore sought to clarify the impact of H2A.W loss on DNA methylation by examining the methylome of h2a.w-2 using BS-seq. We found no conspicuous change in CG DNA methylation in the h2a.w-2 mutant (Fig. 2a, b), while non-CG methylation levels appeared substantially decreased at pericentromeric regions (Fig. 2a, b). In agreement with these chromosome-wide observations, TEs located in the pericentromeres showed substantially reduced CHG and CHH methylation levels (Fig. 2b), suggesting that H2A.W promotes DNA methylation in these regions. Conversely, we found that TEs located on chromosome arms showed increased CHH DNA methylation in h2a.w-2, suggesting an antagonistic effect of H2A.W (Fig. 2b). Indeed, looking specifically at regions normally occupied by H2A.W in WT revealed opposing changes in non-CG DNA methylation in the h2a.w-2 mutant, based on chromosomal location (Fig. 2c). A substantial decrease in methylation levels was observed in pericentromeric regions, whereas regions located in chromosome arms showed increased methylation levels, mostly at CHH sites (Fig. 2c). Short TEs enriched in chromosome arms are known targets of the RdDM pathway involving DRM1/2, while CHG and CHH methylation at long heterochromatic TEs is preferentially maintained by CMT3 and CMT2, respectively 2,3. We found that short TEs tended to gain CHH methylation in h2a.w-2, while long heterochromatic TEs instead tended to lose CHH and CHG methylation (Fig. 2d). Accordingly, non-CG methylation was reduced at CMT2-dependent regions but increased at DRM1/2-dependent regions in h2a.w-2 (Fig. 2e). Together, these findings indicate that H2A.W promotes CMT3 and/or CMT2 mediated methylation maintenance in pericentromeric heterochromatin. They also suggest that H2A.W opposes RdDM at less heterochromatic regions on chromosome arms, supporting the idea that RdDM is inhibited by heterochromatin as proposed previously 3,27.
Heterochromatin accessibility decreases in the absence of H2A.W
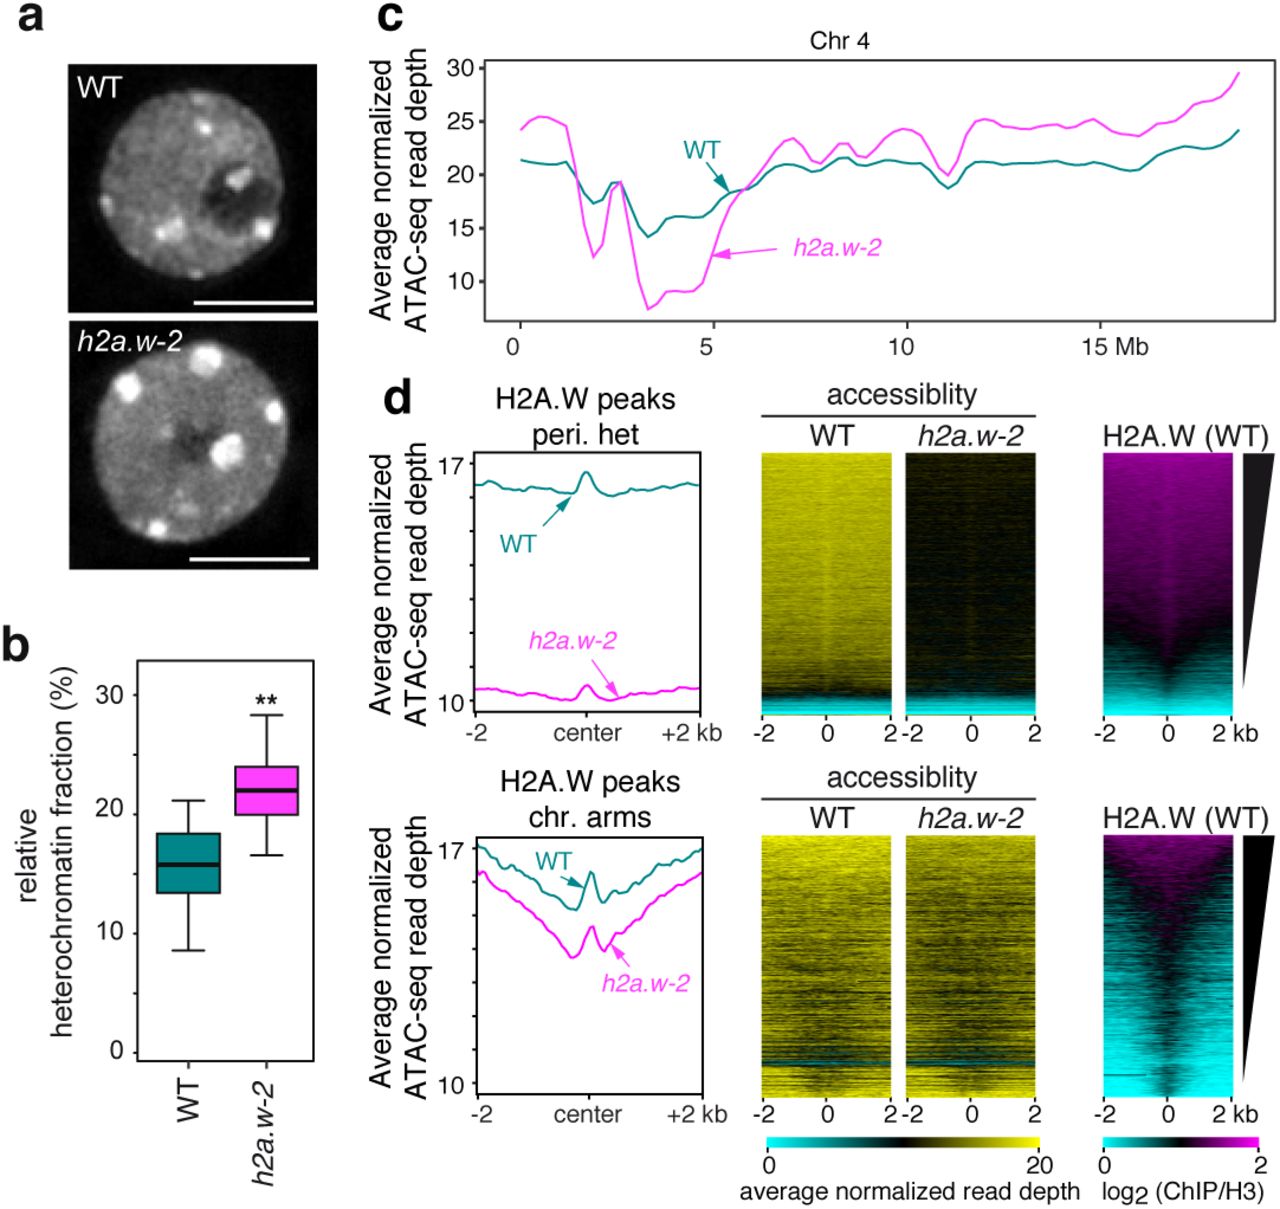
Since complex and global changes in patterns of DNA methylation often result from modulation of chromatin accessibility 21, we analyzed the chromatin organization in h2a.w-2. Indeed, we observed enlargement of chromocenters in h2a.w-2 (Fig. 3a, b), as was previously observed in h2a.w-1 24. Chromocenter enlargement is also observed in mutants that induce over-replication of heterochromatic regions 28. To test for over-replication, we analyzed DNA content in h2a.w-2 nuclei by FACS. We did not observe any significant change relative to WT (Supplementary Fig. 3), indicating that enlargement of chromocenters most likely reflected changes in chromatin organization.

(a) Representative images of DAPI-stained WT (Col-0) and h2a.w-2 leaf interphase nuclei. Scale bar is 5 µm. (b) Quantification of the relative heterochromatin fraction in WT (n=52) and h2a.w-2 nuclei (n=51). Whiskers indicate 1.5X IQR. (c) Locally weighted scatterplot smoothing (LOESS) fit of ATAC-seq read depth averaged in 1 kb bins across chromosome 4 in WT and h2a.w-2. Average of three replicates shown. (d) Metaplots of average ATAC-seq read depth across all three replicates over H2A.W peaks in pericentromeres and chromosome arms (left). Heat maps of average ATAC-seq read depth across all three replicates over H2A.W peaks in pericentromeres and chromosome arms. In all heat maps, H2A.W peaks were ranked based on level of H2A.W signal in WT (right).
In addition, we directly profiled chromatin accessibility in h2a.w-2 using ATAC-seq 29. In WT, the accessibility of pericentromeric chromatin and regions associated with H2A.W was low relative to other regions, supporting the conclusion that pericentric heterochromatin is relatively inaccessible. (Fig. 3c and Supplementary Fig. 4a). Interestingly, we found a substantial reduction in the accessibility of pericentromeric heterochromatin in h2a.w-2 (Fig. 3c and Supplementary Fig. 4a). This decrease was particularly pronounced at regions normally associated with high levels of H2A.W in WT, and more modestly at regions normally associated with H2A.W but located along chromosome arms (Fig. 3d). Conversely, euchromatic regions that are not normally enriched in H2A.W showed an increase in chromatin accessibility in h2a.w-2 (Fig. 3c, Supplementary Fig. 4a, b). This increased accessibility was generally detected at regions that were already accessible in WT, indicating that they do not represent novel regions of open chromatin (Supplementary Fig. 4b, c). Taken together, our data indicate that H2A.W modulates chromatin accessibility and is particularly required for stabilizing heterochromatin accessibility. We hypothesized that the decreased accessibility observed in h2a.w-2 heterochromatin results from replacement of H2A.W by other types of H2A variants and/or deposition of a chromatin component that impedes chromatin accessibility.

(a) Locally weighted scatterplot smoothing (LOESS) fit of H2A.W, H2A.X, and replicative H2A levels averaged in 1 kb bins across chromosome 4 in the indicated genotypes. Average of two replicates shown. (b) Metaplots of average H2A.W, H2A.X, and replicative H2A levels from two replicates over H2A.W peaks in the chromosome arms and pericentromeres. (c) Smoothing spline fits (50 degrees of freedom) of changes in H2A.X and replicative H2A levels (h2a.w-2 minus WT; log2 ChIP/H3) in 1 kb windows plotted against WT H2A.W level.
H2A.X and replicative H2A replace H2A.W in h2a.w-2 heterochromatin
To assess the composition of chromatin in h2a.w-2, we profiled the genome-wide distribution of H3 and other H2A variants by chromatin immunoprecipitation followed by high-throughput sequencing (ChIP-seq). Profiles of H3 enrichment determined by ChIP-seq were similar in WT and h2a.w-2 plants, suggesting that nucleosome density was not responsible for the change in accessibility in h2a.w-2 (Supplementary Fig. 5a). Since H2A variants confer distinct stability to nucleosomes 30, the replacement of H2A.W by another H2A variant is expected to affect chromatin properties. Based on in vitro thermostability assays, replicative H2A confers higher stability than H2A.W and H2A.X, whereas H2A.Z nucleosomes are the least stable. Therefore, we explored the distribution of the other three H2A variants in h2a.w-2 plants by profiling H2A.X (H2A.X.3 and H2A.X.5), H2A.Z (H2A.Z.9), and replicative H2A (H2A.1 and H2A.13) using ChIP-seq. In WT, H2A.Z, H2A.X, and H2A showed relative depletion over pericentromeric heterochromatin as well as at H2A.W-associated regions located in chromosome arms (Fig. 4a and Supplementary Fig. 5a), as previously reported 24. In h2a.w-2, we found a striking gain of H2A.X, and to a lesser extent replicative H2A, but not H2A.Z, over regions normally marked by H2A.W in WT (Fig. 4a-c and Supplementary Fig. 5a). Western blot analyses confirmed increased levels of replicative H2A and H2A.X in h2a.w-2 chromatin (Supplementary Fig. 5b).

(a) Locally weighted scatterplot smoothing (LOESS) fit of H1 levels averaged in 1 kb bins across chromosome 4 in WT and h2a.w-2. Average of two replicates shown. (b) Metaplots of average H1 levels from two replicates over H2A.W peaks in pericentromeres and the chromosome arms (top panel). Plots over randomly shuffled peaks within the chromosome arms and pericentromeres are shown for comparison (bottom panel). (c) Locally weighted scatterplot smoothing (LOESS) fit of WT H2A.W levels (log2 ChIP/H3), changes in H1 levels (h2a.w-2 minus WT; log2 ChIP/H3), and changes in chromatin accessibility (h2a.w-2 minus WT; ATAC-seq read depth) in 50 bp windows plotted against TE size. (d) Locally weighted scatterplot smoothing (LOESS) fit of changes in CHG and CHH DNA methylation (h2a.w-2 minus WT) in 50 bp windows plotted against TE size. (e) The genome was divided into consecutive, non-overlapping 4-kb bins, which are stacked according to their genomic position from the top of chromosome 1 to the bottom of chromosome 5. Pericentromeric regions are indicated (peri.1 to peri.5). H2A.W enrichment in the WT (log2 ChIP/H3) is shown as a heat map on the left. Other heat maps show changes in H1 levels (log2 h2a.w-2/WT; log2 ChIP/H3), changes in chromatin accessibility (log2 h2a.w-2/WT; ATAC-seq read depth), and changes in CHG and CHH DNA methylation (h2a.w-2 minus WT) in h2a.w-2 versus WT.
Although replicative H2A nucleosomes show higher thermal stability than H2A.W nucleosomes, in vitro DNA protection assays have shown that replicative H2A confers less protection than H2A.W 30. This indicated to us that the increase in replicative H2A at pericentromeric chromatin may not be responsible for the observed decrease in accessibility. The in vitro thermostability of H2A.W and H2A.X nucleosomes is similar 30 and thus should not directly account for the changes in chromatin accessibility in h2a.w-2. However, H2A.X is primarily known for its role in DNA damage response, during which it becomes rapidly phosphorylated to form γH2A.X aggregates 25, which could impact chromatin accessibility. The ratio of γH2A.X/H2A.X remained unchanged in h2a.w-2 (Supplementary Fig. 5b), suggesting that γH2A.X was not responsible for the change in chromatin accessibility in h2a.w-2. In support of this conclusion, DNA damage response genes are not mis-regulated in h2a.w-2 (Supplementary Fig. 5c). As changes in H2A variant composition were not responsible for the decrease in heterochromatin accessibility, we next examined epigenetic modifications.
Heterochromatin H1 levels increase in h2a.w-2
Profiles of epigenetic marks associated with heterochromatin, namely H3K9me1, H3K9me2, and H3K27me1, were similar in WT and h2a.w-2 (Supplementary Fig. 5a). Hence, maintenance of these post transcriptional modifications is independent of H2A.W and they are not responsible for the change in heterochromatin accessibility in h2a.w-2.
Interestingly, the DNA methylation changes in h2a.w-2 appeared to be the inverse of those found in linker histone H1 mutants, which display decreased DNA methylation at short euchromatic TEs and increased methylation at long heterochromatic TEs 3. By re-analyzing published DNA methylation data in h1 knock-out mutants 21, we confirmed that non-CG DNA methylation changes at TEs in h2a.w-2, although of lower amplitude, were essentially the opposite of the changes that occur in h1 mutants (Fig. 2a and Supplementary Fig. 6), suggesting that the DNA methylation changes in h2a.w-2 may be related to changes in H1 distribution.
This prompted us to explore H1 patterns in h2a.w-2. Consistent with earlier work 15–17, our ChIP-seq analyses revealed that H1 is enriched in pericentromeric heterochromatin relative to euchromatin in WT (Fig. 5a). Regions associated with H2A.W in WT were also generally enriched in H1 (Fig. 5b). In h2a.w-2, we observed a further increase in H1 at pericentromeric heterochromatin, accompanied by a modest decrease of H1 along chromosome arms (Fig. 5a). Regions normally marked by H2A.W in both pericentromeric regions and chromosome arms showed a further increase in H1 enrichment in h2a.w-2 relative to WT (Fig. 5b), indicating that H2A.W opposes deposition of H1. Western blot analysis indicated that global nuclear H1 levels were similar in h2a.w-2 and WT (Supplementary Fig. 5b), suggesting that the total pool of H1 available is limiting and that increased recruitment of H1 in pericentromeric heterochromatin and other H2A.W-associated regions in h2a.w-2 is likely responsible for the relative depletion of H1 along the chromosome arms (Fig. 5a, b). Histone H1 is known to obstruct chromatin accessibility and stabilize nucleosomes by binding to the linker DNA 13. Therefore, redistribution of H1 may account for the change in chromatin accessibility in h2a.w-2 (Fig. 3c, Supplementary Fig. 4b, c).
To test this, we analyzed the correlation between chromatin accessibility, DNA methylation, and H1 levels in WT and h2a.w-2. Moving from chromosomal arms into pericentromeric regions, heterochromatin content and the length of individual TEs increases 3. Consistently, levels of H2A.W increased with TE length in WT (Fig. 5c). The increase in H1 in h2a.w-2 is correlated with H2A.W enrichment in WT and was highest at pericentromeric heterochromatin regions (Fig. 5a-c and 5e). As H1 enrichment increased in h2a.w-2, chromatin accessibility and non-CG methylation levels at TEs in pericentromeric heterochromatin decreased (Fig. 2a-c and Fig. 5c-e). Together, these data suggest that H2A.W-containing nucleosomes antagonize H1 deposition, thereby facilitating access of non-CG DNA methyltransferases to pericentromeric heterochromatin for efficient DNA methylation.
Discussion
Chromosomal rearrangements are common in T-DNA insertion lines 31,32. Here we identified a large chromosomal rearrangement in the hta6-1 SALK line that resulted in a duplication of the translocated region during the generation of the hta6-1 hta7 hta12 triple mutants (h2a.w-1). This chromosome rearrangement, and not the loss of H2A.W, is responsible for the developmental defects and CHG hypermethylation previously reported in h2a.w-1, as well as the lethality of h2a.w-1 cmt3 quadruple mutants 24. The absence of these defects in our newly generated triple mutant, h2a.w-2, has now enabled us to analyze the direct impact of H2A.W on heterochromatin composition and accessibility.
H2A.W promotes higher order chromatin compaction 24 and increases nucleosome stability 30. Hence, we expected loss of H2A.W to increase heterochromatin accessibility. Surprisingly, we observed the opposite, with accessibility decreasing in h2a.w-2. This suggests that H2A.W has an indirect impact on accessibility, presumably by affecting the recruitment of other factors that influence chromatin structure. Indeed, we found that H2A.W antagonizes H1 deposition. H1 is known to stabilize the wrapping of DNA around the nucleosome, promote assembly of higher order chromatin structures 33, and influence nucleosome spacing 34,35. H1 levels increase in h2a.w-2 heterochromatin, correlating with decreased accessibility in the same regions. The antagonism between H1 and H2A.W may originate from a competition for linker DNA binding. The extended C-terminal tail of H2A.W interacts with linker DNA, and this interaction prevents micrococcal nuclease accessibility 30. The H2A.W C-terminal tail contains a SPKK motif 24, which binds A/T-rich DNA in its minor groove and causes condensation 36,37. Two SPKK-like motifs SPAK and SP(G/A)K are also present in the C-terminal tails of Arabidopsis H1.1 and H1.2 (supplementary Fig. 7). By competing with H1 for linker DNA binding and preventing excessive H1 accumulation, H2A.W might promote chromatin accessibility and nucleosome “breathing” in otherwise compact heterochromatin. This would facilitate access of CMT3 and CMT2 to heterochromatic DNA, enabling the maintenance of DNA methylation patterns over these regions. At TEs targeted by RdDM, which are located primarily outside of pericentromeric heterochromatin, H1 levels also tend to increase in h2a.w-2, yet these regions also gain CHH methylation. Because RdDM is inhibited by heterochromatin 3,27, this suggests that the mild gain of H1 in these regions cannot compensate for the total loss of H2A.W in h2a.w-2. Thus, in h2a.w-2, the heterochromatic state/identity at these regions is lost, facilitating RdDM-mediated DNA methylation. The observation that MET1-dependent CG methylation is not affected in h2a.w-2 heterochromatin suggests that MET1 access to chromatin may be less sensitive to H1 levels compared to CMT3 and/or CMT2, so that the increase in H1 in h2a.w-2 may not be high enough to obstruct MET1 access to heterochromatin.
Although heterochromatin was long believed to be highly compact and inaccessible to transcriptional machinery, there is increasing evidence that low levels of accessibility within heterochromatin are required for proper heterochromatin formation by permitting access to various factors, including DNA and histone methyltransferases, that help maintain a heterochromatic state 38,39. H2A.W is likely subject to specific modifications, and its dynamic deposition likely participates in the regulation of chromatin accessibility through its interaction with H1 and other yet unknown factors. Interestingly, deposition of H1 in human osteoclasts depends on macroH2A 40, which is also localized specifically at heterochromatin and impacts its organization in mammals 41,42. The fact that similar properties convergently evolved in plant H2A.W and mammalian macroH2A suggests that regulating H1 deposition may be a key, conserved mechanism by which heterochromatin-specific H2A variants maintain accessibility to heterochromatin.
Methods
Plant material
The hta6 (SALK_024544C), hta7 (GABI_149G05.01), hta12 (SAIL_667_D09), and cmt3-11 (SALK_148381) mutant lines used in this study were all in the Col-0 genetic background. Plants were grown in long-day conditions (16 h light, 8 h dark) at 23°C with 50% relative humidity.
CRISPR-Cas9 targeted mutagenesis
Design of optimal guide RNA (gRNA) sequences was performed using an online bioinformatic tool (https://www.genome.arizona.edu/crispr/index.html). The spacer (GTTTCGAAATCGATGAAAGC) was ligated between the two BbsI sites of the pEn-Chimera vector using annealed oligonucleotides (Supplementary Table 2) and then transferred by a single site Gateway LR reaction into the pDE-CAS9 binary vector. The detailed procedure and vectors are described in 43. Col-0 plants were transformed by floral dipping 44 and T1 transformants were isolated following BASTA selection. Identification of heritable targeted mutagenesis events was done by PCR amplification and sequencing of the region of interest. Two independent T2 lines were then selected that had segregated away the T-DNA coding for the gRNA and Cas9 expression cassette and contained a potential insertion of a single guanine 3 bp upstream of the protospacer adjacent motif (PAM) at the gRNA-targeted HTA6 5’ coding region. The +1G insertion induces an early frame shift 89 bp downstream from the translation initiation site and a stop codon 195 bp downstream from the translation initiation site. Segregation of the mutant allele was analyzed in the T3 generation and we confirmed that both T2 lines were homozygous for the mutation. The knockout nature of this hta6-2 allele was confirmed by immunoblot analysis using a specific antibody (see Fig. 1d). In subsequent crosses, a dCAPS assay was used to identify the hta6-2 allele through a single BsaBI digestion (cuts the mutant allele) of the PCR product (Supplementary Table 2).
Southern blot
Genomic DNA was extracted from rosette leaves using the Wizard® Genomic DNA Purification Kit (Promega) following manufacturer’s instructions. 750 ng of DNA was digested overnight with 20 units of high fidelity SspI restriction enzyme (New England Biolabs) in Cutsmart® buffer and electrophoresed through a 1% agarose (w/v) gel for 8 h. The gel was depurinated (10 min in 0.25 N HCl), rinsed, denatured (30 min in 0.4 N NaOH, 1.5 M NaCl), neutralized (30 min in 0.5 M Tris-HCl, 1.5 M NaCl) and capillary blotted onto a Hybond-N+ membrane (Amersham) overnight. The membrane was UV-crosslinked at 150 mJ. The DNA probe was amplified from Col-0 DNA with primers indicated in Supplementary Table 2, gel-purified, and labeled with α-32P-dCTP using the random hexamer priming method (Megaprime DNA labeling system; Amersham) following manufacturer’s instructions and subsequently purified on illustra MicroSpin S-200 HR columns (GE Healthcare Life Sciences). Hybridization was performed using the PerfectHyb™ Plus hybridization buffer (Sigma) following manufacturer’s instructions, with overnight hybridization at 65°C followed by one washing step (10 min) in 2X SSC 0.1% SDS and two washing steps (15 min each) in 0.5X SSC 0.1% SDS, all at 65°C. The membrane was imaged on a Typhoon FLA 7000 (GE Healthcare Life Sciences).
Inverse PCR (iPCR)
250 ng of Col-0 and hta6-1 genomic DNA were digested by SspI and then column-purified using the Neo Biotech gel extraction kit. To favor self-recircularization of the SspI-digested fragments, ligation was performed at 15°C for 16 hours using 100 ng of the digested DNAs and 4.5 U of T4 DNA ligase (Promega) in a final volume of 100 µl. Following column purification (Neo Biotech gel extraction kit), 1/50 of the eluted DNA was used as a template for a first round of iPCR with primers that closely match the expected extremity of the translocation. A second round of PCR amplification was done using nested primers and a 1/100th dilution of the first amplification as template. A specific product of around 2.1 kb was obtained for the hta6-1 genomic DNA and sequenced (Eurofins) to identify the left border of the translocation. The primers used for iPCR are reported in Supplementary Table 2.
Transcript analysis
Total RNA was extracted with TRI Reagent (Sigma®) from 30 to 40 mg of fresh material following the manufacturer’s instructions. 8 µg of RNA were treated for 1 h at 37°C with 12 units of RQ1 DNase (Promega®) followed by phenol-chloroform extraction and ethanol precipitation of RNA which was subsequently dissolved in water. One-step reverse-transcription quantitative PCR (RT-qPCR) was performed with the SensiFAST™ SYBR® No-ROX One-Step kit (Bioline®) on an Eco™ Real-Time PCR System (Ilumina®) with the following program: 10 min at 45°C, 5 min at 95°C, and 40 cycles of 20 s at 95°C and 30 s at 60°C. A melting curve was generated at the end of the program to control for amplification specificity. Data was normalized to a reference gene and analyzed according to the 2-ΔΔCt method. Means and standard errors of the mean were calculated from independent biological samples. Differences in the means for RT-qPCR data were tested using an unpaired Student’s t-test with Welch’s correction with the t.test function of R version 3.4.0 45.
Nuclear protein extraction and immunoblot
Nuclear protein extracts for Western blot analyses were prepared as described in 25 with few modifications. For each sample 300mg of 10-day old seedlings or 200mg of floral buds (for H2A.W antibody characterization) are frozen in liquid nitrogen and disrupted in 2ml Eppendorf tubes using Qiagen TissueLyser II and metal beads to fine powder. Total ground powder is transferred into 15ml falcon tube containing 5ml of nuclei isolation buffer (NIB; 10 mM MES-KOH pH 5.3, 10 mM NaCl, 10 mM KCl, 250 mM sucrose, 2.5 mM EDTA, 2.5 mM ß-mercaptoethanol, 0.1 mM spermine, 0.1 mM spermidine, 0.3% Triton X-100) and supplemented with protease and phosphatase inhibitors (Roche), followed by vortexing until a fine suspension was obtained. The suspension was filtered through two layers of Miracloth into 50 ml Falcon tubes, followed by washing the Miracloth with 10 ml of NIB. Remaining buffer was carefully squeezed out of the Miracloth into the tube. Nuclei were pelleted by centrifugation at 3,000 rpm at 4°C for 5 min. The pellet was washed once with 5 ml of NIB and centrifuged again. Nuclei were re-suspended in 1 ml of NIB and transferred to Eppendorf tubes followed by centrifugation for 5 min at 4°C at maximum speed. Finally, nuclei were re-suspended in 150 μl of 1x PBS supplemented with protease and phosphatase inhibitors (Roche), mixed with 50μl of 4x Laemmli loading buffer and boiled for 5 minutes. Once the samples reached room temperature, 2μl of Benzonase (Millipore) was added and incubated for 10min on bench. Samples are again boiled for 3min to inactivate Benzonase. Samples were spun at maximum speed for 5 min to pellet down insoluble fraction and supernatant is transferred to fresh Eppendorf tubes. For Western blot analyses, 10 μl for histone variants, 20 μl for histone modifications and 5 μl for H3 (used as a loading control) were loaded per lane. Nuclear proteins were resolved using NuPAGE 4-12% Bis-Tris protein gels. Resolved proteins were transferred onto PVDF membrane using Bio-Rad wet transfer unit. Western blot analysis was performed using 1:1000 diluted antibodies in 5% milk in TBST. H2A.W.6, H2A, H2A.X, H2A.Z 24, H2A.W.7, and γH2A.X antibodies 25 were described previously. H2A.W and H1 antibodies were generated using peptides CTTKTPKSPSKATKSP and CRTGSSQYAIQKFIEEK respectively at Eurogentec.
Whole Genome Bisulfite sequencing (BS-seq)
Genomic DNA was extracted from the aerial portions of 10-day old seedlings using the Wizard® Genomic DNA Purification Kit (Promega) following manufacturer’s instructions. Sodium bisulfite conversion, library preparation, and sequencing on a Hiseq 4000 were performed at the Beijing Genomics Institute (Hong Kong) from 1 µg DNA, producing paired 100-bp (replicate 1) or 150-bp (replicate 2) paired-end reads. Analysis was performed as previously reported 46. Briefly, we removed PCR duplicates with a custom program that considered a read pair duplicated if both reads from a pair were identical to both reads of another read pair. Libraries were mapped with BS-Seeker2 v2.1.5 47 on the TAIR10 reference genome using the Bowtie2 aligner with 4% mismatches and methylation values were called from uniquely-mapped reads. Only cytosines with a minimum coverage of 8 reads were considered.
RNA-seq
Total RNA was isolated with RNeasy Mini kit (Qiagen) from 10-day old seedlings in three replicates. DNase treatment was done on 2 µg of total RNA with DNA free DNase Kit (Invitrogen). From 1 µg of total RNA, rRNA was depleted using RiboZero kit (Illumina). NGS-libraries were generated using NEBnext Ultra II directional RNA library prep kit for Illumina and sequenced as PE75 reads on an Illumina NextSeq550.
Reads were trimmed and filtered for quality and adapter contamination using Trim Galore 48 and aligned to the TAIR10 genome using STAR 49. Reads aligning equally well to more than one position in the reference genome were discarded, and probable PCR duplicates were removed using MarkDuplicates from the Picard Tools suite 50. Alignment statistics for each library are available in Supplementary Table 3. Read counts for each gene and TE were obtained using htseq-count 51, with annotations from araport11 52. Annotated TEs overlapping strongly (> 80%) with an annotated TE gene were considered TE genes, and the TE annotation was discarded. Differential expression analysis was performed using DESeq2 53, and genes were considered differentially expressed with an adjusted p-value < 0.05 and abs[log2(fold change)] > 1.
ATAC-seq
ATAC-seq was performed as described in 54. Briefly, 0.5 g of freshly collected 10-day old seedlings were chopped in 4 ml of pre-chilled lysis buffer (15 mM Tris-HCl pH 7.5, 20 mM NaCl, 80 mM KCl, 0.5 mM spermine, 5mM ß-mercaptoethanol, 0.2% Triton X-100). After chopping, the suspension was filtered through a 40 µM filter. Nuclei were further enriched using a sucrose gradient. Enriched nuclei were resuspended in 0.5 ml of pre-cooled lysis buffer with 4,6-Diamidino-2-Phenylindole (DAPI) and incubated for 15 min. DAPI stained nuclei were sorted on FACS Aria III (BD Biosciences). Sorted nuclei (50,000) were pelleted and washed once (10 mM Tris-HCl pH 8.0, 5 mM MgCl2). Tagmentation reaction was carried out using Nextera reagents (TDE1 Tagment DNA Enzyme (Catalog No. 15027865), TD Tagment DNA Buffer (Catalog No. 15027866)). Tagmented DNA was isolated using Qiagen MinElute PCR purification kit. NGS libraries were amplified using NEBNext high fidelity 2X master mix and Nextera primers. The number of PCR cycles was determined using a method described in 55. NGS-libraries were PE75 sequenced on an Illumina NextSeq550.
Reads were trimmed and filtered as indicated above (RNA sequencing), and aligned to TAIR10 using bowtie2 56. Reads aligning to multiple positions and PCR duplicates were removed (see RNA sequencing). Only properly paired reads were retained for the analysis. Alignment statistics for each library are available in Supplementary Table 3. Sample tracks and peaks in WT and h2a.w-2 were obtained using Genrich 57 with parameters -p 0.01, -a 200, -l 100 and - g 100. ChrM, ChrC, and several rRNA regions with very high coverage were omitted from the analysis. Metaplots of ATAC-seq signal over various genomic regions were created using deeptools 58. Plots of ATAC-seq signal over entire chromosomes are based on average signal over 1 kb non-overlapping bins tiled genome-wide, calculated using deeptools. Smoothed conditional mean of the signal was computed using the LOESS smoothing method with bin width span 0.1 and plotted using R 45.
ChIP-seq
ChIP was performed as described in 59. Briefly, 3 g (approx. 0.3 mg for each immunoprecipitation (IP)) of 10-day old seedlings were fixed in 1% PFA. Fixed seedlings were ground to fine powder in liquid nitrogen using a mortar and pestle. Nuclei were isolated using M2 buffer (10 mM phosphate buffer pH 7.0, 100 mM NaCl, 10 mM ß-mercaptoethanol, 10 mM MgCl2, 0.5% Triton X-100, 1 M hexylene glycol, 1× cOmplete protease inhibitor cocktail) and M3 buffer (10 mM phosphate buffer pH 7.0, 100 mM NaCl, 10 mM ß-mercaptoethanol, 1× cOmplete protease inhibitor cocktail). Chromatin shearing was done using a Covaris E220 with the following settings: treatment time 15 minutes, acoustic duty factor % 5.0, PIP 140 W, Cycles per burst 200 and max temperature 8°C. IP, washes, and DNA isolation were carried out as described in 59. 5 µg of the following antibodies were used for IP: H2A, H2A.X, H2A.Z (described in 24). H3 (ab1791 Abcam), H3K9me1 (ab8896 Abcam), H3K9me2 (ab1220/Abcam), H3K27me1 (17-643/Millipore) and H1 (AS111801/Agrisera) antibodies were obtained from commercial sources. NGS libraries were generated using Ovation Ultralow Library System V2 (NuGEN) for replicate 1 and NEBNext Ultra II DNA preparation kit for replicate 2. NGS-libraries were SR75 sequenced on an Illumina NextSeq550.
Reads were trimmed, filtered, and aligned using bowtie2, and multi-mapping reads and PCR duplicates were removed, all as indicated above (see ATAC-seq). Alignment statistics for each library are available in Supplementary Table 3. Sample tracks and metaplots over genomic regions were obtained using deeptools 58 bamCoverage (--normalizeUsing CPM). All samples except for H3 were normalized to their matched H3 sample using deeptools bamCompare. Plots over entire chromosomes were obtained from average ChIP-seq signal over 1 kb non-overlapping bins tiled genome-wide and smoothed using the same approach as the ATAC-seq data. H2A.W ChIP-seq data were re-analyzed from 24.
Data availability
The data supporting the findings of this study are available within the article and its Supplementary Information. High throughput sequencing data has been deposited in the Gene Expression Omnibus (GEO) database and can be accessed with the accession number GSE146948. All data are available from the corresponding author upon reasonable request.
Author contributions
P.B., C.L.P., R.Y., F.B, S.E.J. and O.M. designed the study. P.B., R.Y., T.P., Z.J.L. and M.N.P. performed experiments. C.L.P. and O.M performed bioinformatic analyses. P.B., C.L.P., R.Y., F.B. and O.M. wrote the manuscript. F.B., S.E.J. and O.M. coordinated the research.
Additional information
Competing interests
The authors declare that they have no conflict of interest.
Acknowledgments
We thank James Watson from GMI for editing and comments on the manuscript, and we thank the Vienna Biocenter Core Facility Next Generation Sequencing. This work was supported by CNRS, Inserm, Université Clermont Auvergne, Young Researcher grants from the Auvergne Regional Council (to O.M.), an EMBO Young Investigator award (to O.M.), and a grant from the European Research Council (ERC, I2ST 260742 to O.M.). P.B. was supported by a PhD studentship from the Ministère de l’éducation nationale, de l’enseignement supérieur et de la recherche. F.B., R.Y. and Z.L. are supported by the Gregor Mendel Institute and the Austrian Science Fund (FWF): I2303, P32054, P28320, and P26887. The funders had no role in study design, data collection and analysis, decision to publish, or preparation of the manuscript.
References


