

ABSTRACT
Cancer researchers use cell lines, patient derived xenografts, and genetically engineered mice as models to investigate tumor biology and to identify therapies. The generalizability and power of a model derives from the fidelity with which it represents the tumor type of investigation, however, the extent to which this is true is often unclear. The preponderance of models and the ability to readily generate new ones has created a demand for tools that can measure the extent and ways in which cancer models resemble or diverge from native tumors. Here, we present a computational tool, CancerCellNet, that measures the similarity of cancer models to 22 naturally occurring tumor types and 36 subtypes, in a platform and species agnostic manner. We applied this tool to 657 cancer cell lines, 415 patient derived xenografts, and 26 distinct genetically engineered mouse models, documenting the most faithful models, identifying cancers underserved by adequate models, and finding models with annotations that do not match their classification. By comparing models across modalities, we find that genetically engineered mice have higher transcriptional fidelity than patient derived xenografts and cell lines in four out of five tumor types. We have made CancerCellNet available as freely downloadable software and as a web application that can be applied to new cancer models.
INTRODUCTION
Models are widely used to investigate cancer biology and to identify potential therapeutics. Popular modeling modalities are cancer cell lines (CCLs)1, genetically engineered mouse models (GEMMs)2, and patient derived xenografts (PDXs)3.These classes of models differ in the types of questions that they are designed to address. CCLs are often used to address cell intrinsic mechanistic questions4, GEMMs to chart progression of molecularly defined-disease5, and PDXs to explore patient-specific response to therapy in a physiologically relevant context6. Models also differ in the extent to which the they represent specific aspects of a cancer type7. Even with this intra- and inter-class model variation, all models should represent the tumor type or subtype under investigation, and not another type of tumor, and not a non-cancerous tissue. Therefore, cancer-models should be selected not only based on the specific biological question but also based on the similarity of the model to the cancer type under investigation8,9.
Various methods have been proposed to determine the similarity of cancer models to their intended subjects. Domcke et al devised a ‘suitability score’ as a metric of the molecular similarity of CCLs to high grade serous ovarian carcinoma based on a heuristic weighting of copy number alterations, mutation status of several genes that distinguish ovarian cancer subtypes, and hypermutation status10. Other studies have taken analogous approaches by either focusing on transcriptomic or ensemble molecular profiles (e.g. transcriptomic and copy number alterations) to quantify the similarity of cell lines to tumors11–13. These studies were tumor-type specific, focusing on CCLs that model, for example, hepatocellular carcinoma or breast cancer. More recently, Yu et al compared the transcriptomes of CCLs to the Cancer Genome Atlas (TCGA) by correlation analysis, resulting in a panel of CCLs recommended as most representative of 22 tumor types14. While all of these studies have provided valuable information, they leave two major challenges unmet. The first challenge is to determine the fidelity of GEMMs and PDXs and whether there are stark differences between these classes of models and CCLs. The other major unmet challenge is to enable the rapid assessment of new, emerging cancer models. This challenge is especially relevant now as technical barriers to generating models have been substantially lowered15,16, and because each PDX can be considered a distinct entity requiring individual validation17.
To address these challenges, we developed CancerCellNet (CCN), a computational tool that uses transcriptomic data to quantitatively assess the similarity between cancer models and 22 naturally occurring tumor types and 36 subtypes in a platform- and species-agnostic manner. Here, we describe CCN’s performance, and the results of applying it to assess 657 cancer cell lines, 415 patient derived xenografts, and 26 distinct genetically engineered mouse models. This has allowed us to identify the most faithful models currently available, to document cancers underserved by adequate models, and to find models with inaccurate tumor type annotation. Moreover, because CCN is open-source and easy to use, it can be readily applied to newly generated cancer models as a means to assess their fidelity.
RESULTS
CancerCellNet classifies samples accurately across species and technologies
Previously, we had developed a computational tool using the Random Forest classification method to measure the similarity of engineered cell populations to their in vivo counterparts based on transcriptional profiles18,19. More recently, we elaborated on this approach to allow for classification of single cell RNA-seq data in a manner that allows for cross-platform and cross-species analysis20. Here, we used an analogous approach to quantitatively compare cancer models to naturally occurring patient tumors (Fig 1A). In brief, we used TCGA RNA-seq expression data from 22 solid tumor types to train a top-pair multi-class Random forest classifier. We combined training data from Rectal Adenocarcinoma (READ) and Colon Adenocarcinoma (COAD) into one COAD_READ category because READ and COAD are considered to be virtually indistinguishable at a molecular level21. We included an ‘Unknown’ category trained using randomly shuffled gene-pair profiles generated from the training data of 22 tumor types to identify query samples that are not reflective of any of the training data.

CancerCellNet (CCN) workflow and performance. (A) Schematic of CCN training (top) and usage (bottom). CCN was designed to assess and compare the expression profiles of cancer models such as CCLs, PDXs, and GEMMs with native patient tumors. First, CCN takes patient tumor expression profiles of 22 different cancer types from TCGA to train a multi-class Random Forest classifier and performs gene pair transformation on tumor expression profiles. Then CCN selects the most discriminative gene pairs for each cancer type as features. Lastly, CCN trains a multi-class Random Forest classifier using gene-pair transformed training data and feature gene pairs. To use trained classifier, CCN inputs the query samples (e.g. expression profiles from CCLs, PDXs, GEMMs) and generates a classification profile for the query samples. The column names of the classification heatmap represent sample annotation and the row names of the classification heatmap represent different cancer types. Each grid is colored from black to yellow representing the lowest classification score (e.g. 0) to highest classification score (e.g. 1). (B) Mean and standard deviation of area under the precision recall curve (AUPR) of classifiers based on 50 iterations of cross-validation: random sampling of training data, training CCN classifiers using training data and testing the classifiers on held-out data.
We assessed the performance of this approach by computing the area under the precision recall (AUPR) curves derived by 50 iterations of cross validation (Fig 1B, Supp Fig 1A). In the cross validations, the mean AUPR exceeded 0.95 in most of the tumor types. In addition to achieving high mean AUPRs on held-out TCGA data, we found that CCN also achieved high AUPR (above 0.9) when we applied it to independent testing data from the International Cancer Genome Consortium (ICGC) consisting of RNA-Seq data from 886 tumors across 5 tumor types (Supp Fig 1B)22.
As one of the central aims of our study is to compare distinct cancer models, including GEMMs, our method needed to be able to classify samples from mouse and human samples equivalently. We used the Top-Pair transform20 to achieve this and we tested the feasibility of this approach by assessing the performance of a normal (i.e non-tumor) cell and tissue classifier trained on human data as applied to mouse samples. Consistent with prior applications23, we found that the cross-species classifier performed well, achieving mean AUPR of 0.96 when applied to mouse data (Supp Fig 1C).
To evaluate cancer models at a finer resolution, we also developed an approach to perform tumor subtype classifications (Supp Fig 1D). We constructed 11 different cancer subtype classifiers based on the availability of expression or histological subtype information21,24–34. We also included non-cancerous, normal tissues as categories for several subtype classifiers when sufficient data was available: breast invasive carcinoma (BRCA), COAD_READ, head and neck squamous cell carcinoma (HNSC), kidney renal clear cell carcinoma (KIRC) and uterine corpus endometrial carcinoma (UCEC). The 11 subtype classifiers all achieved high overall average AUPRs ranging from 0.75 to 0.99 (Supp Fig 1E).
Fidelity of cancer cell lines
Having validated the performance of CCN, we then used it to determine the fidelity of CCLs. We mined RNA-Seq expression data of 657 different cell lines across 20 cancer types from the Cancer Cell Line Encyclopedia (CCLE) and applied CCN to them, finding a wide classification range for cell lines of each tumor type (Fig 2A, Supp Tab 1). To verify the classification results, we applied CCN to CCLE expression profiles generated through microarray expression profiling35. To ensure that CCN would function on microarray data, we first tested it by applying a CCN classifier created to test microarray data to 720 expression profiles of 12 tumor types. The cross-platform CCN classifier performed well, based on the comparison to study-provided annotation, achieving a mean AUPR of 0.944 (Supp Fig 2A). Next, we applied this cross-platform classifier to microarray expression profiles of CCLE (Supp Fig 2B). From the classification results of 571 cell lines that have both RNA-seq and microarray expression profiles, we found a strong positive association between the classification scores from RNA-seq and those from microarray (Supp Fig 2C). This comparison supports the notion that the classification scores for each cell line are not artifacts of profiling methodology. Moreover, this comparison shows that the scores are consistent between the times that the cell lines were first assayed by microarray expression profiling in 2012 and by RNA-Seq in 2019. We also observed high level of correlation between our analysis and the analysis done by Yu et al14(Supp Fig 2D), further validating the robustness of the CCN results.

Evaluation of cancer cell lines. (A) General classification heatmap of CCLs extracted from CCLE. Column annotations of the heatmap represent the labelled cancer category of the CCLs given by CCLE and the row names of the heatmap represent different cancer categories. CCLs’ general classification profiles are categorized into 4 categories: correct (red), correct mixed (pink), no classification (light green) and other classification (dark green) based on the decision threshold of 0.3. (B) Bar plot represents the proportion of each classification category in CCLs across cancer types ordered from the cancer types with the highest proportion of correct and correct mixed CCLs to lowest proportion. (C) Comparison between SKCM general CCN scores from bulk RNA-seq classifier and SKCM malignant CCN scores from scRNA-seq classifier for SKCM CCLs. (D) Comparison between SARC general CCN scores from bulk RNA-seq classifier and CAF CCN scores from scRNA-seq classifier for SKCM CCLs. (E) Comparison between GBM general CCN scores from bulk RNA-seq classifier and GBM neoplastic CCN scores from scRNA-seq classifier for GBM CCLs. (F) Comparison between SARC general CCN scores and CAF CCN scores from scRNA-seq classifier for GBM CCLs. The green lines indicate the decision threshold for scRNA-seq classifier and general classifier.
Next, we assessed the extent to which CCN classifications agreed with their nominal tumor type of origin. We annotated cell lines based their CCN score profile as follows. ‘Correct’ Cell lines with CCN score > 0.3 for the tumor type of origin were annotated ‘correct’. Those with CCN scores > 0.3 in the tumor type of origin and at least one other tumor type were annotated as ‘mixed’. Cell lines with CCN scores > 0.3 for tumor types other than that of the cell lines origin were annotated as ‘other’, and those lines that did not received a CCN score > 0.3 for any tumor type were annotated as ‘none’ (Fig 2B). We selected a decision threshold of 0.3 based on the average of the thresholds that produced the highest Macro F1 measure, harmonic mean of precision and recall, across 50 cross validations. We found that majority of cell lines originally annotated as Breast invasive carcinoma (BRCA), Cervical squamous cell carcinoma and endocervical adenocarcinoma (CESC), Skin Cutaneous Melanoma (SKCM), Colorectal Cancer (COAD_READ) and Sarcoma (SARC) fell into the ‘correct’ category (Fig 2B). On the other hand, no Esophageal carcinoma (ESCA) or Brain Lower Grade Glioma (LGG) were classified as ‘correct’, demonstrating the need for more transcriptionally faithful cell lines that model those general cancer types.
There are several possible explanations for cell lines not receiving a ‘correct’ classification. One possibility is that the sample was incorrectly labeled in the study from which we harvest the expression data. Consistent with this explanation, we found that colorectal cancer line NCI-H68436,37, a cell line labelled as liver hepatocellular carcinoma (LIHC) by CCLE, was classified strongly as COAD_READ (Supp Tab 1). Another possibility to explain low CCN score is that cell lines were derived from subtypes of tumors that are not well-represented in TCGA. To explore this hypothesis, we first performed tumor subtype classification on the CCLE lines from 11 tumor types for which we had trained subtype classifiers (Supp Tab 2). We reasoned that if a cell was a good model for a rarer subtype, then it would receive a poor general classification but a high classification for the subtype that it models well. Therefore, we counted the number of lines that fit this pattern. We found that of the 223 lines with no general classification, 54 (24%) were classified as a specific subtype, suggesting that derivation from rare subtypes is not the major contributor to the poor overall fidelity of CCLs.
Another potential contributor to low scoring cell lines is intra-tumor stromal and immune cell impurity in the training data. If impurity were a confounder of CCN scoring, then we would expect a strong positive correlation between mean purity and mean CCN classification scores of CCLs per general tumor type. However, the Pearson correlation coefficient between the mean purity of general tumor type and mean CCN classification scores of CCLs in the corresponding general tumor type was low (0.059), suggesting that tumor purity is not a major contributor to the low CCN scores across CCLE (Supp Fig 2E).
To more directly assess the impact of intra-tumor heterogeneity in the training data on evaluating cell lines, we constructed a classifier using cell types found in human melanoma and glioblastoma scRNA-seq data38,39. Previously, we have demonstrated the feasibility of using our classification approach on scRNA-seq data23. Our scRNA-seq classifier achieved a high average AUPR (0.95) when applied to held-out data (Supp Fig 3A-B). Comparing the CCN score from bulk RNA-seq general classifier and scRNA-seq classifier, we observed a high level of correlation (Pearson correlation of 0.89) between the SKCM CCN classification scores and scRNA-seq SKCM malignant CCN classification scores for SKCM cell lines (Fig 2C, Supp Fig 3C). Among the 37 SKCM cell lines that were classified as SKCM in general classification, 36 SKCM cell lines were also classified as SKCM malignant cells in scRNA-seq classifier. Interestingly, we also observed a high correlation between the SARC CCN classification score and scRNA-seq cancer associated fibroblast (CAF) CCN classification scores (Pearson correlation of 0.89). Six of the 10 SKCM cell lines that had been classified as SARC by CCN were classified as CAF by the scRNAseq classifier (Fig 2D, Supp Fig 3C), which suggests the possibility that these cell lines were derived from CAF or other mesenchymal populations, or that they have acquired a mesenchymal character through their derivation. The high level of agreement between scRNA-seq and bulk RNA-seq classification results shows that heterogeneity in the training data of general CCN classifier has little impact in the classification of SKCM cell lines.
In contrast, we observed a weaker correlation between GBM CCN classification scores and scRNA-seq GBM neoplastic CCN classification scores (Pearson correlation of 0.58) for GBM cell lines (Fig 2E, Supp Fig 3D). Of the 32 GBM lines that were not classified as GBM with CCN, 26 were classified as GBM neoplastic cells with the scRNA-seq classifier. Among the 27 GBM lines that were classified as SARC with CCN, 15 cell lines were classified as CAF (Fig 2F), and 10 of 15 lines were classified as both GBM neoplastic and CAF in the scRNA-seq classifier. Similar to the situation with SKCM lines that classify as CAF, this result is consistent with the possibility that some GBM lines classified as SARC by CCN could be derived from mesenchymal subtypes exhibiting both strong mesenchymal signatures and glioblastoma signatures or that they have acquired a mesenchymal character through their derivation40. The lower level of agreement between scRNA-seq and bulk RNA-seq classification results for GBM models suggests that the heterogeneity of glioblastomas41 can impact the classification of GBM cell lines, and that the use of scRNA-seq classifier can resolve this deficiency.
To experimentally explore some of our computational analyses, we performed immunofluorescence on three cell lines that were not classified as their labelled categories: the ovarian cancer line SK-OV-3 had a high UCEC CCN score (0.2345), the ovarian cancer line A2780 had a high Testicular Germ Cell Tumors (TGCT) CCN score (0.2255), and the prostate cancer line PC-3 had a high bladder cancer (BLCA) score (0.3895) (Supp Tab 1). We reasoned that if SK-OV-3 and A2780 were classified most strongly as UCEC, TGCT and BLCA, respectively, then they would express proteins that are indicative of these cancer types.
First, we measured the expression of the uterine-associated transcription factor HOXB642,43, and the UCEC serous ovarian tumor biomarker WT144 in SK-OV-3, in the OV cell line Caov-4, and in the UCEC cell line HEC-59. We chose Coav-4 as our positive control for OV biomarker expression because it was determined by our analysis and others10,14 to be a good model of OV. Likewise, we chose HEC-59 to be positive controls for UCEC. We found that SK-OV-3 has a small percentage (5%) of cells expressing the UCEC marker HOXB6 and a large portion (73%) of cells expressing WT1 (Fig 3A). In contrast, no Coav-4 cells expressing HOXB6, and 85% of cells expressing WT1. This suggests that SK-OV-3 exhibits both biomarkers of ovarian tumor and uterine tissue. From our computational analysis and experimental validation, SK-OV-3 is most likely an endometrioid subtype of ovarian cancer. This result is also consistent with prior classification of SK-OV-345, and the fact that SK-OV-3 lacks p53 mutations, which is prevalent in high-grade serous ovarian cancer46, but it does possess an endometrioid-associated ARID1A mutation10,45,47. Next, we measured the expression of markers of OV and germ cell cancers (LIN28A48) in the OV-annotated cell line A2780, which received a high TCGT CCN score. We found that 54% of A2780 cells expressed LIN28A whereas it was not detected in Coav-4 (Fig 3B). The OV marker WT1 was also expressed in fewer A2780 cells as compared to Caov-4 (48% vs 85%), which suggests that A2780 is a germ cell derived ovarian tumor. Taken together, our results suggest that SK-OV-3 and A2780 could represent OV subtypes of that are not well represented in TCGA training, which resulted in a low OV score and higher (yet still below our classification threshold) CCN score in other categories.

Immunofluorescence of selected cell lines. (A) Classification profiles (left) and IF expression (middle) of Coav-4 (OV positive control), HEC-59 (UCEC positive control) and SK-OV-3 for WT1 (OV biomarker) and HOXB6 (uterine biomarker). The bar plots quantify the average percentage of positive cells for WT1 (top-right) and HOXB6 (bottom-right). (B) Classification profiles (left) and IF expression (middle) of Coav-4, NCCIT (germ cell tumor positive control) and A2780 for WT1 and LIN28A (germ cell tumor biomarker). Classification of NCCIT were performed using RNA-seq profiles of WT control NCCIT duplicate from Grow et al77. The bar plots quantify the average percentage of positive cells for WT1 (top-right) and LIN28A (bottom-right) (C) Classification profiles (left) and IF expression (middle) of Vcap (PRAD positive control), RT4 (BLCA positive control) and PC-3 for FOLH1 (prostate biomarker) and PPARG (urothelial biomarker). The bar plots quantify the average percentage of positive cells for FOLH1 (top-right) and PPARG (bottom-right).
Lastly, we examined PC-3, annotated as a PRAD cell line but classified to be most similar to BLCA. We found that 30% of the PC-3 cells expressed PPARG, a contributor to urothelial differentiation50 that is not detected in the PRAD Vcap cell line but is highly expressed in the BLCA RT4 cell line (Fig 3C). PC-3 cells also expressed the PRAD biomarker FOLH149 suggesting that PC-3 has an PRAD origin and gained urothelial or luminal characteristics through the derivation process. In short, our limited experimental data support the CCN classification results.
Next, we explored the subtype classification of CCLs from three general tumor types in more depth, focusing first on UCEC. The histologically defined subtypes of UCEC, endometrioid and serous, differ in prevalence, molecular properties, prognosis, and treatment. For instance, the endometrioid subtype, which accounts for approximately 80% of uterine cancers, retains estrogen receptor and progesterone receptor status and is responsive towards progestin therapy51,52. Serous, a more aggressive subtype, is characterized by the loss of estrogen and progesterone receptor and is not responsive to progestin therapy51,52. CCN classified the majority of the UCEC cell lines as serous except for JHUEM-1 which is classified as endometrioid (Fig 4A). The preponderance CCLE lines of serous versus endometroid character may be due to properties of serous cancer cells that promote their in vitro propagation, such as upregulation in cell adhesion53. Some of our subtype classification results are consistent with prior observations. For example, HEC-1A, HEC-1B, and KLE were previously characterized as type II endometrial54. On the other hand, our subtype classification results contradict prior observations in at least one case. For instance, the Ishikawa cell line was derived from type I endometrial cancer (endometrioid histological subtype)54,55, however CCN classified a derivative of this line, Ishikawa 02 ER-, as serous. The high serous CCN score could result from a shift in phenotype of the line concomitant with its loss of estrogen receptor (ER) as this is a distinguishing feature of type II endometrial cancer (serous histological subtype)51. Taken together, these results indicate a need for more endometroid-like CCLs.

Subtype classification of CCLs. The heatmap visualizations represent subtype classification of UCEC CCLs (A), LUAD CCLs (B) and LUSC CCLs (C). The row names represent CCLs and column names represent cancer subtypes of UCEC, LUSC and LUAD. The bar plots to the right of the subclass heatmaps represent the general classification scores in cell lines’ annotated cancer category, and the color strips to the right of the subclass heatmaps represent subclass classification (left) and general classification (right). (D) Comparison of normalized citation counts and general CCN classification scores of CCLs. Labelled cell lines either have the highest CCN classification score in their labelled cancer category or highest normalized citation count. Each citation count was normalized by number of years since first documented on PubMed.
Next, we examined the subtype classification of Lung Squamous Cell Carcinoma (LUSC) cell lines (Fig 4C). We found that of the 22 lines unclassified or misclassified in the general classifier, 6 (27%) were classified as a subtype. Among the LUSC cell lines that were classified as unknown in the general classifier and classified with a subtype, several cell lines had general classification scores modestly below the threshold. All the LUSC lines with at least one subtype classification had an underlying primitive subtype classification. This is consistent either with the ease of deriving lines from tumors with a primitive character, or with a process by which cell line derivation promotes similarity to more the primitive subtype, which is marked by increased cellular proliferation26. Some of our results are consistent with prior reports that have investigated the resemblance of some lines to LUSC subtypes. For example, HCC-95, classified as classical and primitive subtype, has previously been characterized as classical26,56. Further, LUDLU-1, classified as a primitive subtype, has classification signal in classical subtype which was previously characterized as resembling classical56. Likewise, although EPLC-272H was also classified as primitive subtype, it has relatively high CCN score in the basal subtype, which corresponds to its previous characterization as basal56. Lung Adenocarcinoma (LUAD) cell lines had classification results similar to LUSC: most lines did not classify as LUAD in the general classifier (66 of 76) (Fig 4B). The cell lines that were classified as a subtype were either classified as proximal inflammation, proximal proliferation or a mix of the two. RERF-LC-Ad1 had the highest general classification score and the highest proximal inflammation subtype classification score. Taken together, these subtype classification results have revealed an absence of cell lines models for basal, classical, and secretory LUSC, and for the Terminal respiratory unit (TRU) LUAD subtype.
Finally, we sought to measure the extent to which cell line transcriptional fidelity related to model use. We used the number of papers in which a model was mentioned, normalized by the number of years since the cell line was documented, as a rough approximation of model usage. To explore this metric, we plotted the normalized citation count versus general classification score, labeling the highest cited and highest classified cell lines from each general tumor type (Fig 4D). For most of the general tumor types, the highest cited cell line is not the highest classified cell line except for Hep G2 and ML-1, representing liver hepatocellular carcinoma (LIHC) and thyroid carcinoma (THCA), respectively. On the other hand, the general scores of the highest cited cell lines representing BLCA, SKCM, BRCA, PRAD and COAD_READ fall below the classification threshold of 0.3. Notably, each of these tumor types have other lines with scores exceeding 0.7, which should be considered as more faithful transcriptional models when selecting lines for a study (Supp Tab 1 and http://www.cahanlab.org/resources/cancerCellNet_results/).
Evaluation of patient derived xenografts
Next, we sought to evaluate a more recent class of cancer models: PDX. To do so, we subjected the RNA-Seq expression profiles of 415 PDX models from 13 different types of cancer types generated previously17 to CCN. Similar to the results of CCLE, the PDXs exhibited a wide range of classification scores (Fig 5A, Supp Tab 3). By categorizing the CCN scores of PDX based on the proportion of samples associated with each tumor type that were correctly classified, we found that SARC, SKCM, COAD_READ and BRCA have higher proportion of correctly classified PDX than those of other cancer categories (Fig 5B). In contrast to CCLE, we found a higher proportion of correctly classified PDX in Stomach adenocarcinoma (STAD) and KIRC (Fig 5B). However, similar to CCLE, no ESCA PDXs were classified as such. This held true when we performed subtype classification on PDX samples: none of the PDX in ESCA were classified as any of the ESCA subtypes (Supp Tab 4). UCEC PDXs had both endometrioid subtypes, serous subtypes, and mixed subtypes, which provided a broader representation than in CCLE (Fig 5C). Many LUSC PDXs that were classified as a subtype were also classified as Head and Neck squamous cell carcinoma (HNSC) (Fig 5D). This could be due to the similarity in expression profiles of basal and classical subtypes of HNSC and LUSC26,57, which is consistent with the observation that these PDXs were also subtyped as basal and classical. No LUSC PDXs were classified as the secretory subtype. While eight of the LUAD PDX samples were classified as the unknown subtype class classification, the remaining six classified as proximal proliferative or proximal inflammatory (Fig 5E). Finally, similar to the CCLE, there were no TRU subtypes in the PDX cohort. In summary, we found that while individual PDXs can reach extremely high transcriptional fidelity to both general tumor types and subtypes, many PDXs were not classified as the general tumor type from which they originated.

Evaluation of patient derived xenografts. (A) General classification heatmap of PDXs. Column annotations represent annotated cancer type of the PDXs, and row names represent cancer categories. (B) Proportion of classification categories in PDXs across cancer types is visualized in the bar plot and ordered from the cancer type with highest proportion of correct and mixed correct classified PDXs to the lowest. Subtype classification heatmaps of UCEC PDXs (C), LUSC PDXs (D) and LUAD PDXs (E).
Evaluation of GEMMs
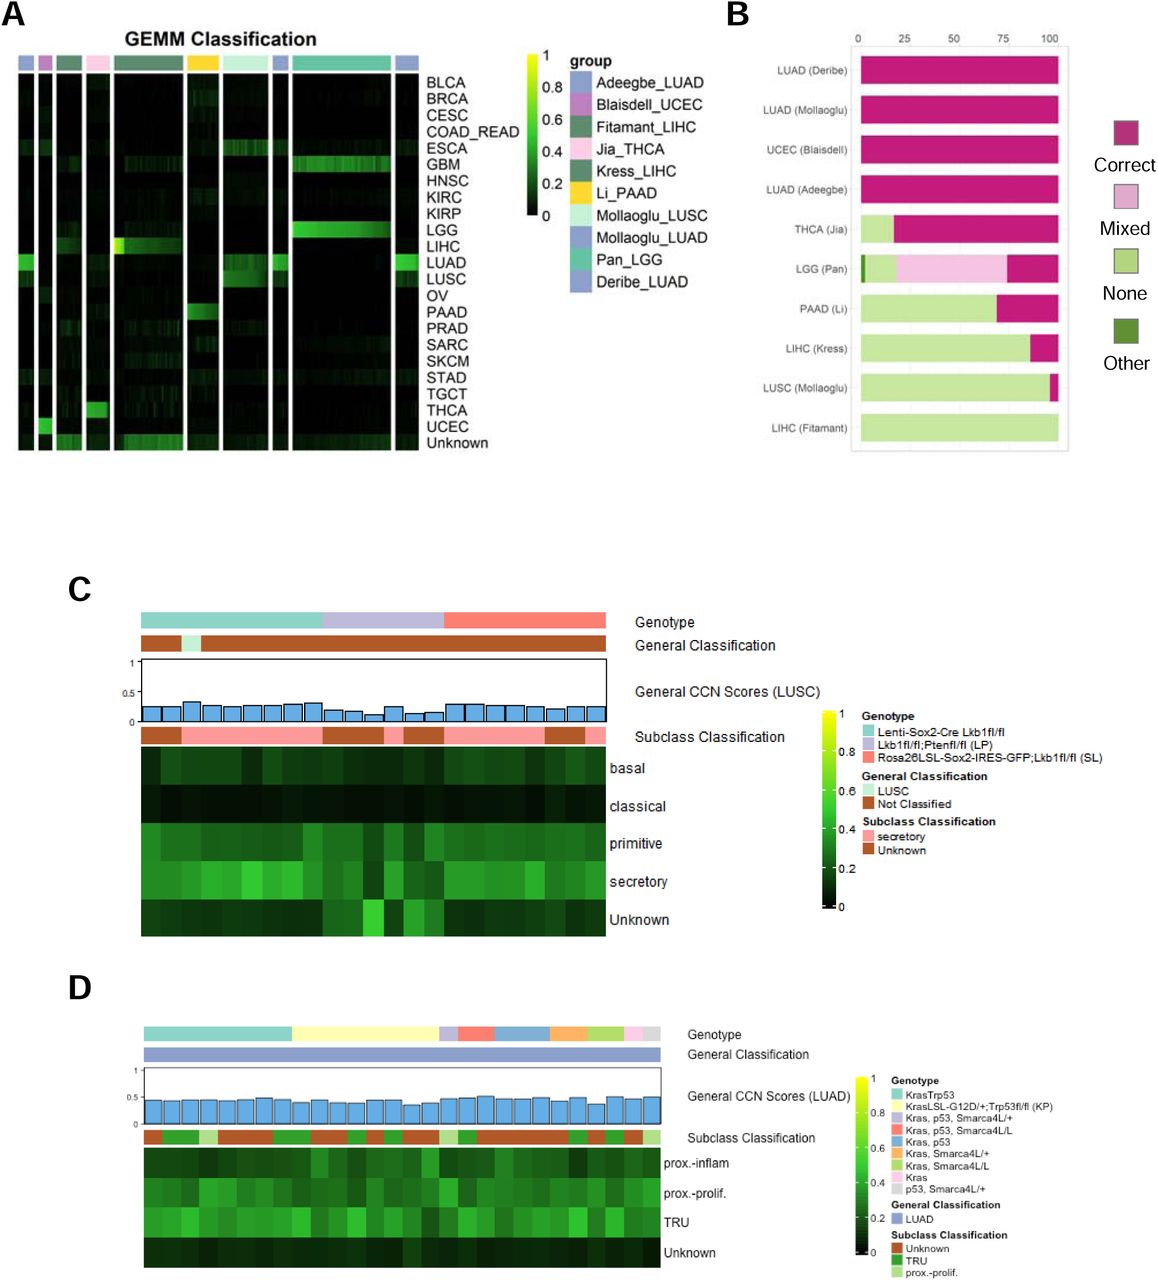
Next, we used CCN to evaluate GEMMs of six general tumor types from nine studies for which expression data was publicly available58–66. As was true for CCLs and PDXs, GEMMs also had a wide range of CCN scores (Fig 6A, Supp Tab 5). We next categorized the CCN scores based on the proportion of samples associated with each tumor type that were correctly classified (Fig 6B). In contrast to CCLs and PDXs, the GEMM dataset included multiple replicates per model, which allowed us to examine intra-GEMM variability. Both at the level of CCN score and at the level of categorization, GEMMs were highly invariant. For example, replicate of UCEC GEMMs driven by Prg(cre/+)Pten(lox/lox) received almost identical general and subtype classification profiles (Supp Fig 4, Supp Tab 6). GEMMs sharing genotypes across studies such as LUAD GEMMs driven by Kras mutation and loss of p5358,64,66 received similar general and subtype classification scores (Fig. 6A,B,D). Even GEMMs with mixed classifications received consistent CCN scores. For example, LGG GEMMs, generated by Nf1 mutations expressed in different neural progenitors in combination with Pten deletion65, consistently received mixed classification as both LGG and GBM (Fig 6A).

Evaluation of genetically engineered mouse models. (A) General classification heatmap of GEMMs. Column annotations represent annotated cancer type of the GEMMs, and row names represent cancer categories. (B) Proportion of classification categories in GEMMs across cancer types is visualized in the bar plot and ordered from the cancer type with highest proportion of correct and mixed correct classified GEMMs to the lowest. Subtype classification heatmap of LUSC GEMMs (C) and LUAD GEMMs (D).
To explore the extent to which driver genotype impacted subtype classification, we examined two general tumor types in which there were GEMMs with different tumor drivers: LUSC and LUAD. The LUSC GEMMs were generated using loss of Lkb1 and either overexpression of Sox2 (via two distinct mechanisms) or loss of Pten64. Although most of the lenti-Sox2-Cre-infected;Lkb1fl/fl and Rosa26LSL-Sox2-IRES-GFP;Lkb1fl/fl samples were classified as unknown, their general LUSC CCN scores were only modestly lower than the decision threshold and consistently throughout (Fig 6C). Those two models also classified mostly as secretory subtype of LUSC. The consistency is not surprising given both models overexpress Sox2 and lose Lkb1. Most of the Lkb1fl/fl;Ptenfl/fl GEMMs received unknown general classifications with general LUSC CCN scores substantially lower than those of lenti-Sox2-Cre-infected;Lkb1fl/fl samples and Rosa26LSL-Sox2-IRES-GFP;Lkb1fl/fl samples. Moreover, our subtype classification indicated that this GEMM was mostly classified as unknown, in contrast to prior reports suggesting that it is most similar to a basal subtype67. The lenti-Sox2-Cre-infected;Lkb1fl/fl samples received high secretory subtype scores, whereas the Rosa26LSL-Sox2-IRES-GFP;Lkb1fl/fl samples were classified as a more balanced mix of secretory and primitive subtypes. None of the three LUSC GEMMs have strong classical or basal sub-type CCN scores.
All of the LUAD GEMMs, which were generated using various combinations of activating Kras mutation, loss of Trp53, and loss of Smarca4L58,64,66, were correctly classified (Fig 6D). There were no substantial differences in general, or subtype classification across driver genotypes. Notably, the subtypes tended to have CCN scores in mixture of proximal proliferation, proximal inflammation and TRU. Taken together, this analysis suggests that there is a degree of similarity, and perhaps plasticity between the primitive and secretory (but not basal or classical) subtypes of LUSC. On the other hand, while the LUAD GEMMs classify strongly as LUAD, do not have strong particular subtype classification -- a result that does not vary by genotype.
Comparison of CCLs, PDXs, and GEMMs
Finally, we sought to estimate the comparative transcriptional fidelity of the three cancer models modalities, limiting our comparison to those five general tumor types for which there were at least two examples per modality: UCEC, Pancreatic adenocarcinoma (PAAD), LUSC, LUAD, and LIHC. We compared the general CCN scores of each model on a per tumor type basis (Fig 7A). In the case of GEMMs, we used the mean classification score of all samples with shared genotypes. We found that GEMMs had the highest median general classification scores in four out of the five tumor types. However, some PDXs achieved the highest classification scores. In UCEC, LUAD and LIHC, the maximum classification score of PDXs exceeded 0.75 and were thus comparable to the majority of scores on held out TCGA data, highlighting the potential for PDXs to mirror the transcriptional state of natural tumors (Fig 7A). Because the CCN score is based on a moderate number of gene pairs (i.e. 1647) relative to the total number of protein-coding genes, it is possible that a cancer model with a high CCN score might not have a high global similarity to a naturally occurring tumor. Therefore, we also calculated the GRN status, a metric of the extent to which tumor-type specific gene regulatory network is established18, for all models (Supp Fig 5). We observed high level of correlation between the two similarity metrics, which suggests that although CCN classifies on a selected set of genes, its scores are highly correlated with global assessment of transcriptional similarity.

Comparison of CCLs, PDXs, and GEMMs. (A) Box-and-whiskers plot comparing general CCN scores across CCLs, GEMMs, PDXs of five general tumor types. (B) Proportion of UCEC (top-left), PAAD (top-right), LUAD (bottom-left) and LUSC (bottom-right) subtypes across cancer model modalities and TCGA patient data. For GEMMs, all classification profiles of replicates with the same genotype from the same study are averaged into one classification profile when calculating the proportion.
We also sought to compare model modalities in terms of the diversity of subtypes that they represent (Supp Fig 6). As a reference, we also included in this analysis the overall subtype incidence, as approximated by incidence in TCGA. In models of UCEC, there is a notable difference in endometroid incidence, and the proportion of models classified as endometroid, with only PDX having any representatives (Fig 7B). The vast majority of CCLs and all of the GEMM models of PAAD have an unknown subtype classification. However, the majority of PDXs are subtyped as either a mixture of basal and classical, or basal and classical alone. LUSC have proximal inflammation and proximal proliferation subtypes modelled by CCLs and PDX, and TRU subtype modelled by GEMMs exclusively (Fig 7B). Likewise, LUAD have basal, classical and primitive subtypes modelled by CCLs and PDXs, and secretory subtype modelled by GEMMs exclusively (Fig 7B). Taken together, these results demonstrate the need to carefully select different model systems to more suitably model certain cancer subtypes.
DISCUSSION
A major goal in the field of cancer biology is to develop models that mimic naturally occurring tumors with enough fidelity to enable therapeutic discoveries. However, methods to measure the extent to which cancer models resemble or diverge from native tumors are lacking. This is especially problematic now because there are many existing models from which to choose, and it has become easier to generate new models. Here, we present CancerCellNet (CCN), a computational tool that measures the similarity of cancer models to 22 naturally occurring tumor types and 36 subtypes. Because CCN is platform- and species-agnostic, it can be applied across many model modalities, including CCLs, PDXs, and GEMMs, and thus it represents a consistent platform to compare models across modalities. Here, we applied CCN to 657 cancer cell lines, 415 patient derived xenografts, and 26 distinct genetically engineered mouse models. Several lessons emerged from our computational analyses that have implications for the field of cancer biology.
First, CancerCellNet indicates that GEMMs are transcriptionally the most faithful models of four out of five general tumor types for which data from all modalities was available. This is consistent with the fact that GEMMs are typically derived by recapitulating well-defined driver mutations of natural tumors, and thus this observation corroborates the importance of genetics in the etiology of cancer68. Moreover, in contrast to most PDXs, GEMMs are typically generated in immune replete hosts. Therefore, the higher fidelity of GEMMs may also be a result of the influence of a native immune system on GEMM tumors69. Second, PDXs and CCLs have lower scores that are comparable to each other. This is consistent with the observation that PDXs can undergo selective pressures in the host that distort the progression of genomic alterations away from what is observed in natural tumors70. Furthermore, the observation that a few PDXs have very high classification scores, approaching a level that is indistinguishable from held out TCGA data, suggests that under certain conditions, PDX can almost perfectly mimic natural tumors transcriptionally. It is unclear what are these conditions; it may be that these few PDXs were profiled prior to the acquisition of non-typical genomic alterations. Third, we have found that none of the samples that we evaluated here are transcriptionally adequate models of ESCA, and therefore this tumor type requires further attention to derive new models. Fourth, we found that in several tumor types, GEMMs tend to reflect mixtures of subtypes rather than conforming strongly to single subtypes. The reasons for this are not clear but it is possible that in the cases that we examined the histologically defined subtypes have a degree of plasticity that is exacerbated in the murine host environment. We have made the results of our analyses available online so that researchers can easily explore the performance of selected models or identify the best models for any of the 22 general tumor types and the 36 subtypes presented here.
Currently, there are several limitations to our CCN tool, and caveats to our analyses which indicate areas for future work and improvement. First, CCN is based on transcriptomic data but other molecular readouts of tumor state, such as profiles of the proteome71, epigenome72, non-coding RNA-ome72, and genome68 would be equally, if not more important, to mimic in a model system. Therefore, it is possible that some models reflect tumor behavior well, and because this behavior is not well predicted by transcriptome alone, these models have lower CCN scores. To both measure the extent that such situations exist, and to correct for them, we plan in the future to incorporate other omic data into CCN so as to make more accurate and integrated model evaluation possible. A second limitation is that in the cross-species analysis, CCN implicitly assumes that homologs are functionally equivalent. The extent to which they are not functionally equivalent determines how confounded the CCN results will be. This possibility seems to be of limited consequence based on the high performance of the normal tissue cross-species classifier and based on the fact that GEMMs have the highest median CCN scores. Finally, the TCGA training data is made up of RNA-Seq from bulk tumor samples, which necessarily includes non-tumor cells, whereas the CCLs are by definition cell lines of tumor origin. Therefore, CCLs theoretically could have artificially low CCN scores due to the presence of non-tumor cells in the training data. This problem appears to be limited as we found no correlation between tumor purity and CCN score in the CCLE samples. However, this problem is related to the question of intra-tumor heterogeneity. We demonstrated the feasibility of using CCN and single cell RNA-seq data to refine the evaluation of cancer cell lines contingent upon availability of scRNA-seq training data. As more sufficient training single cell RNA-seq data accrues, CCN would be able to not only evaluate models on a per cell type basis, but also based on cellular composition.
To ensure that CCN is widely available we have developed a free web application, which performs CCN analysis on user-uploaded data and allows for direct comparison of their data to the cancer models evaluated here. We have also made the CCN code freely available under an Open Source license and as an easily installed R package, and we are actively supporting its further development. The documentation describes how to analyze model(s) and compare the results to the panel of models that we evaluated here, thereby allowing researchers to immediately compare their models to the broader field in a comprehensive and standard fashion.
Online Methods
Training General CancerCellNet Classifier
To generate training data sets, we downloaded 8991 patient tumor RNA-seq expression count matrix and their corresponding sample table across 22 different tumor types from TCGA using TCGAWorkflowData, TCGAbiolinks73 and SummarizedExperiment74 packages. We used all the patient tumor samples for training the general CCN classifier. Later, we found the intersecting genes between TCGA dataset and all the query samples (CCLs, PDXs, GEMMs), and used TCGA dataset with intersecting genes as raw input for CCN. To train the top pair Random Forest classifier, we used a method similar to our previous method23. CCN first normalized the training counts matrix by down-sampling the counts to 500,000 counts per sample. To significantly reduce the time and resource of generating gene pairs for all possible genes, CCN then selected 30 up-regulated genes, 30 down-regulated genes and 30 least differentially expressed genes for each of the 22 cancer categories using template matching75 as the genes to generate top scoring gene pairs. In short, for each tumor type, CCN defined a template vector that labelled the training tumor samples in cancer type of interest as 1 and all other tumor samples as 0 CCN then calculated the Pearson correlation coefficient between template vector and gene expressions for all genes. The genes with strong match to template as either upregulated or downregulated had large absolute Pearson correlation coefficient. CCN chose the upregulated, downregulated and least differentially expressed genes based on the magnitude of Pearson correlation coefficient.
After CCN selected the genes for each cancer type, CCN generated gene pairs among those genes. Gene pair transformation was a method inspired by the top-scoring pair classifier76 to allow compatibility of classifier with query expression profiles that were collected through different platforms (e.g. microarray query data applied to RNA-seq training data). In brief, the gene pair transformation compares 2 genes within an expression sample and encodes the “gene1_gene2” gene-pair as 1 if the first gene has higher expression than the second gene. Otherwise, gene pair transformation would encode the gene-pair as 0. Using all the gene pair combinations generated through the gene sets across all cancer types, CCN then selected top 75 discriminative gene pairs for each category using template matching (with large absolute Pearson correlation coefficient) described above. To prevent any single gene from dictating the gene pair list, we allowed each gene to appear at maximum of three times among the gene pairs selected as features.
After the top discriminative gene pairs were selected for each cancer categories, CCN concatenate all the gene pairs into a vector and gene pair transformed the training samples into a binary matrix with all the discriminative gene pairs as row names and all the training samples as column names. Using the binary gene pair matrix, CCN randomly shuffled the binary values across rows then across column generating random profiles that should not resemble training data from any of the cancer categories. CCN then sampled 70 random profiles, annotated them as “Unknown” and used them as training data for the “Unknown” category.
Using gene pair binary training matrix, CCN constructed a multi-class Random Forest classifier of 2000 trees and used stratified sampling of 60 sample size to ensure balance of training data in constructing the decision trees. The specific parameters for the final CCN classifier using the function “broadClass_train” in the package cancerCellNet are in Supp Tab 7. The gene-pairs are in Supp Tab 8.
Validating General CancerCellNet Classifier
Two thirds of patient tumor data from each cancer type was randomly sampled as training data to construct a CCN classifier. After the classifier was built, 35 held-out samples from each cancer category were sampled and 40 “Unknown” profiles were generated for validation. CCN gene pair transformed the held-out data for assessment based on the top gene pairs selected to construct the classifier. The process of randomly sample training set from 2/3 of all patient tumor data, train classifier and validate using validation set was repeated 50 times to have a more comprehensive assessment of the classifier. We used precision-recall curve and area under the precision-recall curve (AUPR) as our metric of assessing the classifiers.
Classifying Query Data into General Cancer Categories
We downloaded the RNA-seq cancer cell lines expression profiles and sample table from (https://portals.broadinstitute.org/ccle/data), and microarray cancer cell lines expression profiles and sample table from Barretina et al 35. We extracted 2 WT control NCCIT RNA-seq expression profiles from Grow et al77. We received PDX expression estimates and sample annotations from the authors of Gao et al 17. We gathered GEMM expression profiles from 9 different studies58–66. To use CCN classifier on GEMM data, the mouse genes from GEMM expression profiles were converted into their human homologs. The query samples were gene pair transformed using gene pairs selected from the training step, and then inputted into Random Forest classifier for classification. Each query classification profile was labelled as one of the four classification categories: “correct”, “mixed”, “none” and “other” based on classification profiles. If a sample has a CCN score higher than the decision threshold (0.3) in the labelled cancer category, we assigned that as “correct”. If a sample has CCN score higher than the decision threshold in labelled cancer category and in other cancer categories, we assigned that as “mixed”. If a sample has no CCN score higher than the decision threshold in any cancer category or has the highest CCN score in ‘Unknown’ category, then we assigned it as “none”. If a sample has CCN score higher than the decision threshold in a cancer category or categories not including the labelled cancer category, we assigned it as “other”. We analyzed and visualized the results using R and R packages pheatmap78 and ggplot279.
Cross-Species Assessment
To assess the performance of cross-species classification, we downloaded 1003 labelled human tissue/cell type and 1993 labelled mouse tissue/cell type RNA-seq expression profiles from Github (https://github.com/pcahan1/CellNet). We first converted the mouse genes into human homologous genes. Then we found the intersecting genes between mouse tissue/cell expression profiles and human tissue/cell expression profiles. Limiting the input of human tissue RNA-seq profiles to the intersecting genes, we trained a CCN classifier with all the human tissue/cell expression profiles. The parameters used for the function “broadClass_train” in the package cancerCellNet are in Supp Tab 7. After the classifier was trained, we randomly sampled 75 samples from each tissue category in mouse tissue/cell data and applied the classifier on those samples to assess performance.
Cross-Technology Assessment
To assess the performance of CCN in applications to microarray data, we gathered 6,219 patient tumor microarray profiles across 12 different cancer types from more than 100 different projects (Supp Tab 9). We found the intersecting genes between the microarray profiles and TCGA patient RNA-seq profiles. Limiting the input of RNA-seq profiles to the intersecting genes, we created a CCN classifier with all the TCGA patient profiles using parameters for the function “broadClass_train” listed in Supp Tab 7. After the microarray specific classifier was trained, we randomly sampled 60 microarray patient samples from each cancer category, and applied CCN classifier on them as assessment of the cross-technology performance in Supp Fig 3A. The same CCN classifier was used to assess microarray CCL samples Supp Fig 3B.
Training and validating scRNA-seq Classifier
We extracted labelled human melanoma and glioblastoma scRNA-seq expression profiles38,39, and compiled the two datasets excluding 3 cell types T.CD4, T.CD8 and Meyloid due to low number of cells for training. 60 cells from each of the 11 cell types were sampled for training a scRNA-seq classifier. The parameters for training a general scRNA-seq classifier using the function “broadClass_train” are in Supp Tab 7. 25 cells from each of the 11 cell types from the held-out data were selected to assess the single cell classifier. Using the PR curve and maximizing Macro F1 measure, we selected the decision threshold of 0.255. We then applied the scRNA-seq classifier on SKCM CCLs and GBM CCLs.
Training Subtype CancerCellNet
We found 11 cancer types (BRCA, COAD, ESCA, HNSC, KIRC, LGG, PAAD, UCEC, STAD, LUAD, LUSC) which have meaningful subtypes based on either histology or molecular profile and have sufficient samples to train a subtype classifier with high AUPR. We also included normal tissues samples from BRCA, COAD, HNSC, KIRC, UCEC to create a normal tissue category in the construction of their subtype classifiers. Training samples were either labelled as a cancer subtype for the cancer of interest or as “Unknown” if they belong to other cancer types. Similar to general classifier training, CCN performed gene pair transformation and selected the most discriminate gene pairs for each cancer subtype. In addition to the gene pairs selected to discriminate cancer subtypes, CCN also performed general classification of all training data and appended the classification profiles of training data with gene pair binary matrix as additional features. The reason behind using general classification profile as additional features is that many general cancer types may share similar subtypes, and general classification profile could be important features to discriminate the general cancer type of interest from other cancer types before performing finer subtype classification. The specific parameters used to train individual subtype classifiers using “subClass_train” function of CancerCellNet package can be found in Supp Tab 7 and the gene pairs are in Supp Tab 8.
Validating Subtype CancerCellNet
Similar to validating general class classifier, we randomly sampled 2/3 of all samples in each cancer subtype as training data and sampled an equal amount across subtypes in the held-out data for assessing subtype classifiers. We repeated the process 20 times for more comprehensive assessment of subtype classifiers.
Cells culture, Immunohistochemistry and histomorphometry
Caov-4 (ATCC® HTB-76™), SK-OV-3(ATCC® HTB-77™), RT4 (ATCC® HTB-2™), and NCCIT(ATCC® CRL-2073™) cell lines were purchased from ATCC. HEC-59 (C0026001) and A2780 (93112519-1VL) were obtained from Addexbio Technologies and Sigma-Aldrich. Vcap and PC-3 (generously provided by Franklin W Huang’s lab). SK-OV-3, Vcap, and RT4 were cultured in Dulbecco’s Modified Eagle Medium (DMEM, high glucose, 11960069, Gibco) with 1% Penicillin-Streptomycin-Glutamine (10378016, Life Technologies); Caov-4, PC-3, NCCIT, and A2780 were cultured using RPMI-1640 medium (11875093, Gibco) while HEC-59 was in Iscove’s Modified Dulbecco’s Medium (IMDM, 12440053, Gibco). Both medium were supplemented with 1% Penicillin-Streptomycin (15140122, Gibco). All medium were added with 10% Fetal Bovine Serum (FBS).
Cells cultured in 48-well plate were washed twice with PBS and fixed in 10% buffered formalin for 24□hrs at 4 °C. Immunostaining was performed using a standard protocol. Cells were incubated with primary antibodies to goat HOXB6 (10 µg/mL, PA5-37867, Invitrogen), mouse WT1(10 µg/mL, MA1-46028, Invitrogen), rabbit PPARG (1:50, ABN1445, Millipore), mouse FOLH1(10 µg/mL, UM570025, Origene), and rabbit LIN28A (1:50, #3978, Cell Signaling) in Antibody Diluent (S080981-2, DAKO), at 4□°C overnight followed with three 5 min washes in TBST. The slides were then incubated with secondary antibodies conjugated with fluorescence at room temperature for 1□h while avoiding light followed with three 5 min washes in TBST and nuclear stained with mounting medium containing DAPI. Images were captured by Nikon EcLipse Ti-S, DS-U3 and DS-Qi2.
Histomorphometry was performed using ImageJ (Version 2.0.0-rc-69/1.52i). % N.postive cells was calculated by the percentage of the number of positive stained cells divided by the number of DAPI-positive nucleus within three of randomly chosen areas. The data were expressed as means ± SD.
Classifying Query Data into Subtypes
We assigned subtype to query sample if the query sample has CCN score higher than the decision threshold. If a query sample has CCN scores higher than decision threshold, which was chosen through maximizing Macro F1 measure. The table of decision threshold for subtype classifiers are in Supp Tab 10. If a query sample with no CCN score higher than decision threshold in any subtype or has the highest CCN score in ‘Unknown’ category, then we assigned that sample as ‘Unknown’. Analysis and visualizations were done in R and ComplexHeatmap package80.
Tumor Purity Analysis
We used the R package ESTIMATE81 to calculate the ESTIMATE scores from TCGA tumor expression profiles that we used as training data for CCN classifier. To calculate tumor purity we used the equation described in YoshiHara et al., 201381:
Tumour purity = cos (0.6049872018 + 0.0001467884 × ESTIMATE score)
Extracting Citation Counts
We used the R package RISmed82 to extract the number of citations for each cell line through query search of “cell line name[Text Word] AND cancer[Text Word]” on PubMed. The citation counts were normalized by dividing the citation counts with the number of years since first documented.

GRN construction and GRN Status
GRN construction was extended from our previous method18. 80 samples per cancer type were randomly sampled and normalized through down sampling as training data for the CLR GRN construction algorithm. Cancer type specific GRNs were identified by determining the differentially expressed genes per each cancer type and extracting the subnetwork using those genes.
To extend the original GRN status algorithm18 across different platforms and species, we devised a rank-based GRN status algorithm. Like the original GRN status, rank based GRN status is a metric of assessing the similarity of cancer type specific GRN between training data in the cancer type of interest and query samples. Hence, high GRN status represents high level of establishment or similarity of the cancer specific GRN in the query sample compared to those of the training data. The expression profiles of training data and query data were transformed into rank expression profiles by replacing the expression values with the rank of the expression values within a sample (highest expressed gene would have the highest rank and lowest expressed genes would have a rank of 1). Cancer type specific mean and standard deviation of every gene’s rank expression were calculated using training data. The modified Z-score values for genes within cancer type specific GRN were calculated for query sample’s rank expression profiles to quantify how dissimilar the expression values of genes in query sample’s cancer type specific GRN compared to those of the reference training data:

If a gene in the cancer type specific GRN is found to be upregulated in the specific cancer type relative to other cancer types, then we would consider query sample’s gene to be similar if the ranking of the query sample’s gene is equal to or greater than the mean ranking of the gene in training sample. As a result of similarity, we assign that gene of a Z-score of 0. The same principle applies to cases where the gene is downregulated in cancer specific subnetwork.
GRN status for query sample is calculated as the weighted mean of the (1000 – Zscore(gene i)mod) across genes in cancer type specific GRN. 1000 is an arbitrary large number, and larger dissimilarity between query’s cancer type specific GRN indicate high Z-scores for the GRN genes and low GRN status.

The weight of individual genes in the cancer specific network is determined by the importance of the gene in the Random Forest classifier. We later normalize the GRN status in respect to the GRN status of the cancer type of interest and the cancer type with the lowest mean GRN status.

Where “min cancer” represents the cancer type where its training data have the lowest mean GRN status in the cancer type of interest, and avg(GRN statusmin cancer) represents the average GRN status of cancer type with the lowest average GRN status in the “min cancer”. avg(GRN statuscancer type interest) represents average GRN status of the cancer type of interest in the training data.
Code availability
CancerCellNet code and documentation is available at GitHub: https://github.com/pcahan1/cancerCellNet
Supplementary Information

Assessment of CCN general classifier and subtype classifier. (A) Mean and range of CCN classifier’s PR curves from 50 cross validations. (B) AUPR of CCN classifier when applied to independent patient tumor data from ICGC. (C) AUPR of CCN human tissue classifier when applied to mouse tissue data. (D) The schematic of training a subtype classifier in CCN. CCN uses patient tumor expression profiles from cancer of interest as training data. CCN performs gene-pair transformation and selects the most discriminative gene pairs among the cancer subtypes from training data as features. CCN then applies the general classification on training data and uses the general classification profile as features in addition to gene pairs for training a Random Forest classifier. The weight of the general classification profiles as features can be tuned to maximize AUPR. (E) The mean and standard deviation of AUPR for 11 subtype classifiers based on 20 iterations of random sampling of training and held-out data, training subtype classifier using training data, classification of held-out data, and calculation of recall and precision.

Further validation of CCN and classification results. To validate the cross-platform classification performance of CCN, a new classifier specifically trained to classify microarray data was trained using RNA-seq data from TCGA as training data and intersecting genes between RNA-seq data and microarray data. (A) AUPR of CCN classifier when applied to primary microarray testing tumor data. (B) Classification heatmap of CCLs using microarray expression data. (C) Pearson correlation between CCN scores of CCLE lines generated from RNA-seq data and microarray data. (D) Comparison between CCLs’ CCN scores and the similarity metric from Yu et al14, median correlations of transcriptional profiles between CCLs and TCGA tumors from CCLs’ labelled cancer category. (E) Comparison of mean tumor purity of training data and mean CCN scores of CCLs for each cancer category.

Single-cell classification of SKCM and GBM cell lines. (A) Classification heatmap of held-out scRNA-seq data. (B) AUPR of the scRNA-seq classifier when applied to scRNA-seq held-out data. (C) Single-cell classification of SKCM CCLs. Red bar-plot (top) represents general CCN scores in SARC and blue bar-plot (bottom) represents general CCN scores in SKCM. (D) Single-cell classification of GBM CCLs. Red bar-plot (top) represents general CCN scores in SARC and yellow bar-plot (bottom) represents general CCN scores in GBM.

Cancer subtype classification heatmap of UCEC GEMMs.

Correlation between cancer type specific network GRN status and general CCN scores.

Proportion of cancer subtypes in different cancer models and TCGA tumor data across 11 general cancer types.
Supplementary Table 1 General classification profiles of CCLs.
Supplementary Table 2 Subtype classification profiles of CCLs.
Supplementary Table 3 General classification profiles of PDXs.
Supplementary Table 4 Subtype classification profiles of PDXs.
Supplementary Table 5 General classification profiles of GEMMs
Supplementary Table 6 Subtype classification profiles of GEMMs.
Supplementary Table 7 Specific parameters used for training of all classifiers.
Supplementary Table 8 Gene-pairs selected for final training of CCN general and subtype classifiers.
Supplementary Table 9 Accessions of tumor microarray data used in validation.
Supplementary Table 10 Decision thresholds for subtype classifiers.
Acknowledgements
This work was supported by the National Institutes of Health NCI Ovarian Cancer SPORE P50CA228991 via a Development Research Program award to PC. FWH was supported by a Prostate Cancer Foundation Young Investigator Award, Department of Defense W81XWH-17-PCRP-HD (F.W.H.), the National Institutes of Health/National Cancer Institute P20 CA233255-01 (F.W.H.) U19 CA214253 (F.W.H.). We would like to thank John Powers, Hao Zhu, Tian-Li Wang, and Kaloyan Tsanov for comments on the manuscript and helpful discussions.
Footnotes
REFERENCES
- 1.↵
- 2.↵
- 3.↵
- 4.↵
- 5.↵
- 6.↵
- 7.↵
- 8.↵
- 9.↵
- 10.↵
- 11.↵
- 12.
- 13.↵
- 14.↵
- 15.↵
- 16.↵
- 17.↵
- 18.↵
- 19.↵
- 20.↵
- 21.↵
- 22.↵
- 23.↵
- 24.↵
- 25.
- 26.↵
- 27.
- 28.
- 29.
- 30.
- 31.
- 32.
- 33.
- 34.↵
- 35.↵
- 36.↵
- 37.↵
- 38.↵
- 39.↵
- 40.↵
- 41.↵
- 42.↵
- 43.↵
- 44.↵
- 45.↵
- 46.↵
- 47.↵
- 48.↵
- 49.↵
- 50.↵
- 51.↵
- 52.↵
- 53.↵
- 54.↵
- 55.↵
- 56.↵
- 57.↵
- 58.↵
- 59.
- 60.
- 61.
- 62.
- 63.
- 64.↵
- 65.↵
- 66.↵
- 67.↵
- 68.↵
- 69.↵
- 70.↵
- 71.↵
- 72.↵
- 73.↵
- 74.↵
- 75.↵
- 76.↵
- 77.↵
- 78.↵
- 79.↵
- 80.↵
- 81.↵
- 82.↵


