

Abstract
Three-dimensional microscopy of large biological samples (>0.5 cm3) is transforming biological research. Many existing techniques require trade-offs between image resolution and sample size, require clearing or use optical sectioning. These factors complicate the implementation of large volume 3D imaging. Here we present Multi-fluorescent High Resolution Episcopic Microscopy (MF-HREM) which allows 3D imaging of large samples without the need for clearing or optical sectioning.
MF-HREM uses serial-sectioning and block-facing wide-field fluorescence, without the need for tissue clearing or optical sectioning. We detail developments in sample processing including stain penetration, resin embedding and imaging. In addition, we describe image post-processing methods needed to segment and further quantify these data. Finally, we demonstrate the wide applicability of MF-HREM by: 1) quantifying adult mouse glomeruli. 2) identifying injected cells and vascular networks in tumour xenograft models; 3) quantifying vascular networks and white matter track orientation in mouse brain.
Introduction
Immunohistochemistry has traditionally been the primary method used to image specific proteins and structures in large (>1cm3) tissue samples. However, the two-dimensional nature of conventional histological slices means that the complete, and often complex, three-dimensional structure of biological tissues generally cannot be captured and investigated. Numerous efforts have been made to simplify the three-dimensional (3D) alignment of serial histological sections, but have proved to be non-trivial due to the significant distortions and misalignments that occur during sectioning and processing (1). To meet this need, several 3D fluorescent imaging techniques have been developed that are now providing data over length scales from single cells to tissues, organs and organisms (2).
As with many fluorescent imaging techniques, multiplexed fluorescence staining is a particularly powerful tool for evaluating spatial relationships between features, often enabling function to be inferred (3–5).
All 3D microscopy techniques must overcome the opacity of biological tissue caused by optical scatter of tissue structures. Approaches to this can be grouped into two categories: clearing-based, where the tissue is rendered optically transparent through de-lipidation and refractive index matching (6–8)(9); and serial sectioning, where the entire sample is physically cut.
Cleared samples can be imaged using techniques such as light-sheet microscopy (2,4,7) and optical projection tomography (OPT) (10,11). However, clearing requires often complex, lengthy and costly tissue preparation, with variable efficacy (9,12), and widely acknowledged morphological changes to the sample (9,13). Additionally, sample size is limited by the working distance of the microscope objective lens (7) and the objective lens must be protected from the often corrosive clearing solutions. Resolution is also limited by the need for broader light sheets to penetrate greater tissue depth (14).
Block-facing serial-sectioning, overcomes slice alignment issues by imaging the surface of the exposed sample after each successive cut thereby creating an inherently aligned image stack and removing the need to retain the structural integrity of individual slices (Figure 1B). However, block-face imaging can suffer from loss of optical resolution in the z-axis, due to contamination by out of focus light from below the block surface (shine-through) (15). The addition of optical-sectioning capabilities such as two-photon and structured illumination into serial sectioning instruments has aimed to overcome this issue (3), (14), (16) (13,17), but at the cost of dramatically increasing the technical requirements for the imaging instrument require high powered lasers and often they are custom built.

The MF-HREM acquisition pipeline. A) Shows the MF-HREM sample preparation, acquisition and image post-processing timeline for a typical multi-stained sample. For animal models, the sample is collected following perfusion fixation. In some cases the sample is collected following perfusion fixation, in some cases the sample is stained in vivo, prior to fixation. The sample is fixed overnight in PFA before being whole-mount stained (small mount stain or antibody). As almost all candidate resins are immiscible with water, samples must be dehydrated before polymerisation. Once staining is complete, the sample is dehydrated using a series of organic solvents, followed by infiltration with a three-part glycol methanlacrylate acrylic (GMA) resin. Finally, the sample is set within the final resin block in the desired orientation and attached to a chuck for mounting to the instrument. Sample imaging with multiple wavelength channels is automated. B) The Optical HREM instrument (Indigo Scientific, UK) consists of a fluorescent stereomicroscope with 1x objective lens (NA:0.25), and a variable zoom which provides fields of view ranging from 25 mm down to 2.3 mm. Biological samples are held within a removable sample holder under the microscope objective on a z-translational stage to enable sections to be cut with a horizontally-aligned, automated sectioning blade. Single-use tungsten carbide blades allow large samples to be cut. The sample is illuminated by a mercury vapour lamp, with separate excitation and emission filters for multiple wavelength imaging. C) Comparison of previously developed optical HREM, Episcopic fluorescent microscopy and MF-HREM on subcutaneously grown xenograft colorectal cancer tumours. Optical HREM uses Eosin B for contrast, Episcopic fluorescent microscopy uses tissue autofluorescence, while MF-HREM has used multiplexed staining of tumour vasculature and injected cells. In the case of Optical HREM, it is difficult to definitively identify any particular tumour features due to the widespread binding of Eosin B. In the autofluorescence case, blood has been left in the tumour to enhance vessel autofluorescence; whilst this appears to have been effective, it is difficult to conclusively identify bright structures and blood vessels, and only one fluorescence channel can be imaged. MF-HREM demonstrates clear vascular structure as stained by i.v administered lectin and initially injected cells can be clearly identified via the medium-term cell tracing dye CM-DiI. Scale bars are 500μm on 2D slices.
The HREM method was originally developed as a high-throughput platform for phenotyping transgenic mouse models (18–20). It was subsequently used to map gene expression (via lacZ) (21), and for analysis of human tissue (22,23), and developed into a commercial instrument – Optical HREM (Indigo Scientific, UK). In these studies, the source of image contrast was eosin blocking (i.e. the property of eosin, when bound to eosinophilic proteins, to inhibit the fluorescence of unbound eosin in the embedding resin). This produces images with an appearance similar to the inverse of a traditional eosin staining in histology (shown in Figure 1C). Previously, studies have also embedded samples in (non-fluorescent) resin and used the native autofluorescence of the tissue as a source of contrast (20). This technique has only been published as applied to mouse embryos and has no potential to target specific structures or multiplex stains (shown in Figure 1C). Moreover, the resolution is far coarser than Eosin stained HREM as no post-processing solutions to recover the axial resolution have been developed (24).
Here, we describe the development of multi-fluorescent high resolution episcopic microscopy (MF-HREM), this technique allows multiplexed fluorescent imaging of large tissue samples, at high resolution, without the need to perform tissue clearing, optical sectioning or custom build an instrument. MF-HREM is a block-facing serial sectioning imaging technique (21,25), in which samples are embedded in resin and sectioned within the body of a microscope using an automated microtome blade. Wide-field multi-channel fluorescent images of the block face are acquired after every section, resulting in an inherently aligned stack of 3D fluorescent images (See Figure 1B).
MF-HREM offers a convenient solution to the difficulties associated with the alignment of traditional histological sections, and has enabled, for the first time, the extension of HREM to provide multiplexed fluorescence images with targeted labelling. This included the development of a MF-HREM tissue-processing, acquisition and post-processing pipeline, with the use of an opacifying agent and image deconvolution to recover axial image resolution. As MF-HREM does not need tissues to be optically cleared, it is advantageous for imaging tissue morphology (13) and can be used in conjunction with lipophilic dyes that cannot be used in solvent based clearing (26,27). For MF-HREM, lateral resolution is determined directly by the microscope objective, while axial resolution is related to both section thickness and light penetration into the block. As the block is physically sliced there is no inherent link between sample depth and resolution. A diagram of the MF-HREM pipeline is shown in Figure 1A.
Having developed a pipeline for preparing samples, acquiring data and image post-processing we then used MF-HREM to investigate the structure of three biological systems: 1) glomeruli in adult mouse kidneys; 2) blood vessels in a mouse tumour xenograft model; and 3) cerebral vasculature and white matter tract orientation in a mouse brain. We show here that these developments greatly broaden the potential applications of HREM and provide a large-volume 3D imaging platform that is accessible to a wide range of researchers.
Results
Comparison of embedding resins for MF-HREM
MF-HREM requires samples to be embedded within a hard resin, to provide mechanical stability (stiffness) during sectioning. Various commercially-available resins are used in histology, however as these resins are designed to be manually cut and subsequently stained, they are not optimised for automated, thin sectioning, fluorescence preservation or, in many cases, large samples (28,29). We selected five commercial resins based on the literature which covered the three broad chemical categories for hard resins: methacrylate resins – Technovit 7100, Technovit 8100 and Lowicryl HM20; epoxy resin – Spurr; and arcylic resins – LR White (28,30–32).
For each resin chemical setting options rather than heat or UV were used (see methods for more details). For resins requiring low oxygen to set (Technovit 8100) both setting under vacuum and setting under a mineral oil layer were investigated (see methods for further details).
Resins were initially assessed for the time taken to set with and without an opacifying agent Orasol Black (see Supplementary table). LR White and Lowicryl HM20 were excluded from further testing due to expansion during setting and slow setting (>120 hrs) respectively. For the remaining resins — Technovit 8100, 7100 and Spurr — automated cutting consistency and image quality were assessed. During automated cutting with the HREM, Spurr blocks either chipped or broke. Comparisons of cut quality with embedded tissue for Technovit 7100 and 8100 showed Technovit 7100 to have an increased incidence of ‘flaky’ resin (i.e. where resin had not fully set in the centre of the block or voids were evident) (see Figure 2B).

Characterisation of potential resins and optimisation of embedding procedure. A) Hardness measurements for 3 candidate resins (Technovit 7100, Technovit 8100 and Spurr with Technovit 8100 under two different oxygen exclusion conditions: oil or vacuum. Hardness measurements were made using a Shore Duromenter A at two axial positions: top surface and block centre, and at 3 lateral positions for each axial: centre, mid and edge (as indicated in the diagram. Measurements were made in triplicate on two independent samples for each case (mean and standard deviation shown. Comparing the two graphs show that all samples had greater hardness at the centre of the block than the top of the block and at each axial position there was a gradient of decreasing hardness for Spurr resin from the centre to the edge. Technovit 8100 set under oil had the lowest hardness at the top of the block but in the centre all resins had similar measured hardness. B) Diagram showing the simple procedure for embedding samples in known orientation with Orasol Black whilst ensuring the correct FOV can be set at imaging. C) Hardness measurements for Technovit 8100 set under vacuum with three different amounts of secondary catalyst (0.3, 0.4 or 0.5 mL per 15 mL of infiltration soln.) and Orasol Black (2,4,8 mg/mL). Hardness was measured on the top of the block (axially) and in the centre of the block (laterally) with 2 replicate measures on two independent samples in each case. Results show a significant increase in hardness with increasing secondary catalyst and decreasing concentration of Orasol Black (Two-way anova p=0.0059 for secondary catalyst p=0.0011 for opacifying agent concentration.) D) Representative images of two samples embedded in Technovit 8100 and Technovit 7100, showing the flaky resin/voids that can be encountered more so for Technovit 7100 (scale bar =1mm).
Hardness testing of Technovit 8100 (oil or vacuum), 7100 and Spurr (Figure 2A) showed that the top of the block was less hard than the centre of the block for all resins. For Technovit 8100 blocks were harder when set with vacuum by comparison to mineral oil. It was also notable that Spurr resin demonstrated a gradient of hardness from the edge of the section to the centre.
Based on the above results Technovit 8100 was chosen as the candidate resin and the final stage of resin optimisation focused on quantifying and tuning the properties of Technovit 8100 based on the amount of secondary catalyst and Orasol Black (see Figure 2C).
Increasing the volume of secondary catalyst or decreasing the concentration of opacifying agent significantly increased hardness (Two-way anova p=0.0059 for secondary catalyst p=0.0011 for opacifying agent concentration.)
Based on these results, embedding protocols for various adult murine tissues, in Technovit 8100, were established and are shown in Table 1.
Showing optimised timings for sample dehydration and embedding for a range of sample sizes
Minimisation of shine-through artefact with an opacifying agent
In MF-HREM, the focal plane of the microscope is the block surface, however when excitatory light is incident on the block surface some light penetrates the block and excites fluorophores deeper in the sample. Emission from these fluorophores beneath the surface is captured as out of focus light and blurs the image particularly in the axial plane. This is the same process which causes blurring for any optical imaging of thick samples, the difference for HREM (and any other serial sectioning block facing technique) being that this light comes only from below the focal plane rather than above and below (see Figure 3A). This leads to a characteristic comet-tail like artefact in the axial imaging plane as seen in Figure 3B. To reduce excitation of fluorophore beneath the block surface, we investigated the addition of an opacifying agent (Orasol Black) to the embedding resin to minimise light transmission through the block.

Characterisation of Orasol black as an opacifying agent to reduce shine-through. A) Diagram demonstrating the origin of shine through. B) Showing a representative image of cells in an in vitro 3D culture stained with HCS Nuclear Mask with 16mg/ml of Orasol Black. The comet tail artefact can be seen in the xz plane image, (scale bar is 100 μm). C) Graph showing the measured transmission spectrum of Orasol Black, as well as two tested commercial stains HCS Nuclear Mask and HCS Cell Mask (spectrum from manufacturer). It can be seen that Orasol Black has low transmission in the 400-625 nm range which rises steeply in the 625-700 nm range. The HCS Cell mask spectrum falls almost entirely within the low transmission band of Orasol Black whereas the emission of HCS Nuclear mask falls in the section of steep increase in transmission. D) Showing a single exponential fit to the mean intensity profiles for 10 xz plane ROIs taken of single cells in 3D in vitro cell culture stained with HCS Nuclear Mask of increasing Orasol Black concentration (2,4,8,16,32 mg/ml) R2 values (0.976,0.994,0.989,0.982,0.803) respectively. E) Values of, exponential decay constant (, initial intensity (I0), and half-value layer (T1/2, in microns) are shown for each of the concentrations and show the expected increase in decay constant and half-value layer with increasing Orasol Black concentration. There is also a large decrease in intensity at 8 mg/ml and higher Orasol Black concentrations. F) Shows the same fitting parameters in a comparison between HCS Cell Mask stained sample and HCS Nuclear mask stained sample at 16 mg/ml Orasol Black. As expected from the transmission spectrum the decay constant and half-value layer are smaller in the HCS Cell Mask case than the HCS Nuclear Mask case.
Orasol Black 45X (Stort Chemicals Ltd, Bishops Stortford, UK) is a carbon-based product used as a dye in printing industries. It was found to be soluble in all resins and organic solvents tested and did not affect the expected staining pattern for any tested stains. The powder was mixed with the resin at the last stage of resin infiltration, prior to positioning and setting the sample within the final block. Once in the block, the dye decreases shine-through by absorbing both incident, excitation light and emitted fluorescence beneath the block’s surface.
The transmission spectrum of a relatively low concentration of Orasol Black (see Methods) is shown in Figure 3C. It has a broad absorption in the 450nm to 650nm range, with a steep increase in transmission in the near infrared range (>700nm). We investigated the decrease in shine-through with increasing Orasol Black concentration at a wavelength of 705nm and 600nm, using 3D cell cultures as standardised samples (Figure3B). Analysis of pixel intensity for ROI’s drawn around isolated cells allowed fitting of a single exponential decay model (Eq. 1) to the z distance-intensity plot (Figure 3D). estimation of the fit parameters – decay constant (τ), initial intensity (I0) and the calculation of the half-value layer T1/2 = −log(2)/τ, could then be calculated as well as goodness-of-fit.

With increasing concentration of Orasol Black, the comet tail artefact appeared reduced and can be quantified by the decrease in both τ and T1/2 (see Figure 3E). The initial intensity I0 also shows a sharp decrease at 8mg/ml, and this can be seen qualitatively in the images as a decrease in the signal and a reduced signal to noise ratio.
The highest Orasol Black concentration (32 mg/ml) provided the greatest decrease in shine-through, but as previously discussed this affected resin polymerisation, causing the resin to set quickly, in some cases, prior to the addition of the secondary catalyst. A balance between minimising shine-through, having good signal to noise and optimum resin setting must therefore be found.
As expected from the transmission spectrum, shine-through was lower for HCS Cell Mask (Em 600 nm) than for HCS Nuclear Mask (Em 705 nm), for the same concentration of Orasol Black (Figure 3F).
Minimisation of shine-through artefact with image deconvolution
To further eliminate shine-through, and maximise the multiplexing potential in MF-HREM, we investigated post-processing strategies to deconvolve the collected signal.
For any image, I(x,y,z), we may write:
 where O(x,y,z) the object, is convolved with a point-spread function (PSF), h(x,y,z), and additive noise, n(x,y,z).
If the PSF is known and the noise well-estimated the original image can be calculated. The PSF may be: experimentally measured using sub-resolution fluorescent beads, synthetically generated it from known system parameters or estimated via blind deconvolution methods (33).
Deconvolution has traditionally been applied to widefield or confocal microscopy where light contamination comes from both above and below the focal plane. For MF-HREM, only light below the focal plane contaminates the image. Thus, the PSF is highly asymmetric, and not well estimated by blind deconvolution techniques or synthetically generated from widely used models. Whilst experimentally measuring the PSF is an option (15), the process is time-consuming and sometimes impossible, as it must be acquired for all wavelengths and magnifications and depends upon having high signal-to-noise ratio with small point-like sources and high similarity between the PSF measuring sample and the actual sample.
This is impracticable for many MF-HREM experiments and hence we have used small structures from within the image stack to parameterise a synthetically generated PSF. As opposed to directly using the extracted PSF from the image we use the small object to parameterise a symmetric synthetic PSF, using either Gaussian or diffraction kernels (dependent on the magnification). Zeroing the lower half of these synthetic PSFs then provided a good PSF estimation for deconvolution with high signal to noise ratio. The approach was successfully applied to a number of image stacks at different magnifications, wavelengths and concentrations of Orasol Black. Figures 4B and 4C show the approach for Gaussian kernel extraction and deconvolution for a small section of brain microvasculature, with a diffraction kernel.

The Image processing pipeline. A) Showing the increase in signal-to-noise ratio achieved by pre-processing, using a rolling-ball algortihm to remove autofluorescence (upper row) and spectral unmixing to remove cross talk in multi-fluorescent image stacks (lower row). B) Showing the pipeline for the extraction of a PSF from an image stack of a subcutaneous tumour with microsvasculare stained via injection of Lectin-Dyelight649. A suitable point-like source is found in the image stack, this is cropped from the image and a model PSF (in this case 3D gaussian) is fitted to the data. The parameter fits are used in the construction of a synthetic (symmetric) PSF using open source PSF generation with DeconvolutionLab2 (59) and ImageJops (60). This PSF is then half zeroed to create the final PSF. C) The deconvolution of the pre-processed image stack using the PSF. A Richardson-Lucy method with 35 iterations (60) is used to deconvole the stack creating images that can then be segmented and quantified using various methods dependent on the biological context. In this case a MOST tracing algorithm impemented in Vaa3D (40)-(42), (48) is used to segment and skeletonise vascular networks.
Pre-processing to improve signal to noise
The Richardson-Lucy algorithm used to deconvolve the image stacks requires high signal-to-noise ratio for effective deconvolution. Previous researchers have used pre-processing techniques to remove background and reduce noise prior to deconvolution, and this was found to be an important step to achieve effective deconvolution for MF-HREM images (34). The pre-processing methods chosen were motivated by the importance to have processing that could be efficiently applied to large image stacks (>20GB). Median filtering with (1 pixel neighbourhood) was used to remove salt and pepper noise and background subtraction via a rolling-ball algorithm (35,36) was used to remove background from autofluorescence. In addition to these two steps, spectral unmixing was performed for multiplexed staining, prior to deconvolution.
Multiplexing fluorescent stains relies on having distinct spectral excitations and emissions, and appropriate microscope filters to differentiate them. In practice, owing to the broad wavelengths over which most fluorophores are excited and emit and the imperfect nature of bandpass filters, spectral cross-talk will occur. Spectral unmixing may be used to effectively separate the contributions, improving image signal-to-noise ratio. Figure 4A shows the improvement in the signal-to-noise for a mouse brain sample that was dual stained for microvascular (Lectin – DyeLight649) and white matter (CMDiI) (emission at 625 nm). Spectral unmixing and background subtraction were performed using freely available ImageJ plugins (further details in Methods) (36). Quantification of line profile signal intensities show the improved signal-to-noise ratio.
Compatibility of fluorescent stains with MF-HREM sample preparation
To standardise and increase the speed of testing of fluorescent stains, we used a standardised 3D tissue culture (see Methods for details) to test the compatibility of commercial cell counterstains with the MF-HREM processing steps. Embedding cells in a 3D extra-cellular matrix, and imaging at each stage of dehydration and resin infiltration, allowed straightforward observation of fluorescence quenching or stain-target dissociation in a controllable system. Stains were assessed regularly over a 12-hour period, as it was found that fluorescence quenching often only became apparent after a prolonged period in dehydratant/resin. Table 2 provides a list of tested stains and their compatibility with organic solvents. Counter-stains for cell nucleus, cytoplasm and membrane have been identified. The testing of Neurofilament A antibody shows the importance of correct dehydratant selection, as it can be successfully imaged with an ethanol dehydration but not through acetone dehydration. Also of note is the lipophilic stain CMDiI which is compatible with MF-HREM: this highly useful stain is incompatible with many clearing techniques due to the de-lipidation step (27). Where the standard 3D culture could not easily be used, e.g. for in vivo staining routes or specific antibodies, compatibility was tested on cryosections from stained organs (12).
Detailing trialled stains and their compatibility with ethanol or acetone dehydration
Optimisation of stain penetration into tissue samples
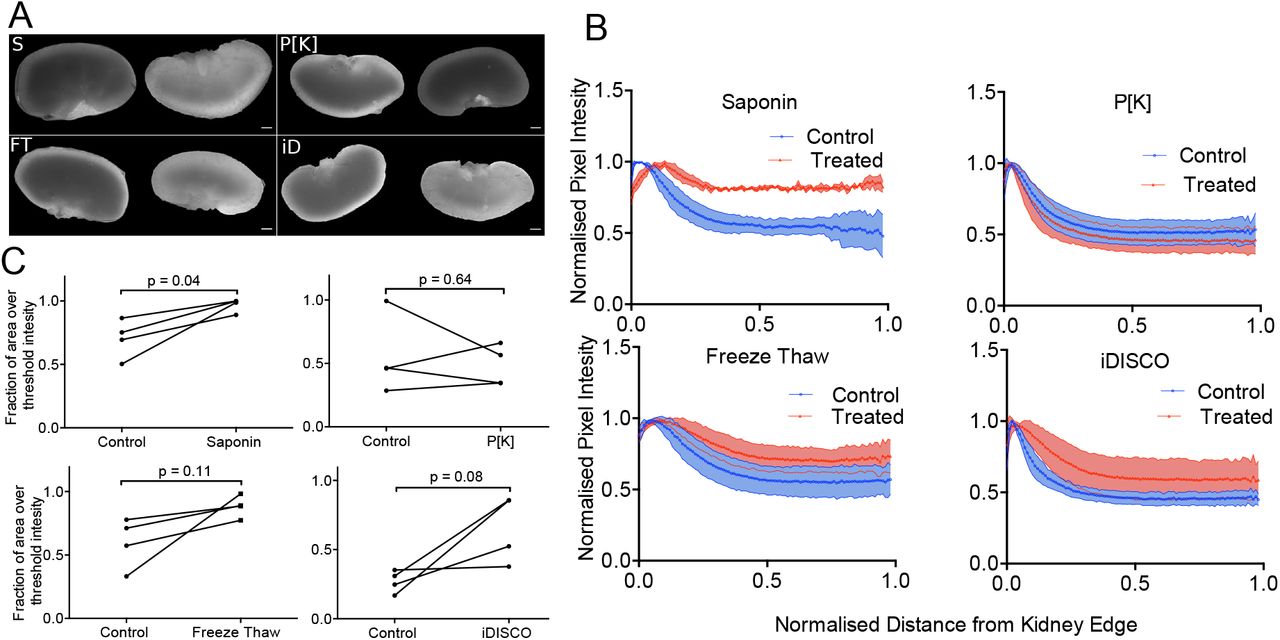
Optical imaging techniques that rely on whole-mount staining (such as MF-HREM), require homogenous and rapid stain penetration, which can be enabled by increasing tissue permeability. We investigated four methods to increase the permeability of tissue samples for use with MF-HREM based on the literature (6,10,37,38): freeze-thaw, proteinase K (P[K]) digestion, iDISCO (which combines several mild detergents (6)) and saponin (N=4). Figure 5 shows the comparison of the four methods and reveals that saponin-treated samples showed significantly greater stain penetration, compared with the control case (p=0.04). The iDISCO method increased stain homogeneity (p=0.055) compared to control kidneys.

Optimisation of stain penetration in adult mouse kidney samples. Four methods for improving stain penetration are compared: saponin treatment, proteinase [K] digestion, freeze-thaw and iDISCO. For each method, four treated and four control kidneys were investigated, where one kidney from each animal was used as a control for the contralateral kidney. A) shows representative images of the kidneys with the control (contralateral kidney on the left and the treated kidney on the right (scale bar, 1 mm). B) shows the normalised PC-HREM signal intensity profile as a function of radial distance from the kidney centre. C) shows the fractional area of the kidney section image, above a threshold value (the same threshold was used for each treated kidney and matched control). Results of paired t-test analysis demonstrates that saponin treatment significantly increased stain penetration (p<0.05).
Alternative staining routes, in particular i.v. or via transcardiac perfusion, are additional and potentially far faster routes for stain administration in animal models. For vascular staining, use of i.v. injection of fluorescently-conjugated lectins is widely used to stain vasculature throughout the mouse body (8). This technique is transferrable to MF-HREM and in Figure 6, Figure 7 and Figure 8, we show the use of fluorescently conjugated lectin administered via tail vein i.v. in mouse kidney, xenograft tumour and brain respectively. Additionally, using the post-processing tool box we segment and quantify vascular structures in all three cases.

Showing the Lectin-Dyelight649 channel of a multi-stained murine kidney and quantification of glomeruli. A) From left to right 2D slices showing: the original image, the segmentation produced by gradient vector flow algorithm, and finally, the manual correction to remove structures that are segmented (white/red arrows) but fall outside the kidney cortex (red line). Scale bars 500 μm for all 2D slices. B) 3D details of the image processing. The original image stack with inset showing the detail which can be seen on the kidney surface (scale bar 200 μm), then the segmentation via gradient flow algorithm in Vaa3D (40)-(42) and manual exclusion of points not in the cortex. The final step is the outcome of the connected components analysis and hence quantification of glomeruli number, and volume distribution. These data show the expected distribution and size of glomeruli for heathy WT mouse as compared with other techniques(39), (43).

Xenograft tumour model analysis. A) Showing a single representative slice with the two stains: CMDiI for injected cell tracking (white), and Lectin-Dyelight 649 conjugate for microvascular staining (magenta). The inset shows a digitally zoomed in portion of the image where small approx. circular structures of cell size are indicated by yellow arrows. B) A 3D rendering of the two channels shows the tumour in its totality with a cut through to show the spatial arrangement of the injected cells within the vascular network. The highly perfused rim can be clearly seen. C) Showing a 3D rendering of the CMDiI channel only and the extent of the cell migration from the initial injecting. The inset shows the same group of cells as in A, deconvolved and rendered in 3D. The yellow arrows indicate the same structures as the 2D case which can more clearly be seen to be single cell or small clusters. The 3D position of these clusters is available from such image data. D) The 3D rendering of the vascular network. E) The extraction and segmentation of a section of the vascular network following the PSF extraction described earlier. In this case the APP2 algorithm from the Vaa3D neuron tracing plugin set was used to segment and skeletonise the deconvolved image stack (40)-(42), (45). F) Shows the histogram of the vessel radii from E.

MF-HREM of Two brain samples, one stained with CMDiI Ex/Em 553/570nm and Lectin-Dyelight 649 (Ex/Em 649/700) and a second stained with CMDiI and HCS Nuclear Mask (Ex/Em 638/686). A) Showing the volume overlay of both the CMDiI (Magenta) and the Lectin (yellow). Colour bars show pixel intensity. B) Shows a high resolution sub-volume of the vasculature channel successfully segmented and skeletonised using the MF-HREM processing pipeline and the MOST tracing algorithm implemented in Vaa3D. C) Shows the histogram of radii distributions. D) Shows the same sub-volume in the CMDiI-white matter channel, here an orientation analysis has been performed via calculation of the structure tensor of the image using a Gaussian gradient and 8pxl window size. The hue, saturation and brightness denote the orientation, coherence and original image brightness respectively. The colour bar shows the angle represented by the hue. E) Shows a polar histogram of D where all orientations with a coherence greater than a threshold value of 0.2 are displaced. It can be seen there appears to be an even distribution of local orientations over this sub volume. F) Shows a volume overlay of the CMDiI channel (White) and the HCS nuclear mask channel (magenta) for a different brain sample. G) shows a single slice imaged at higher resolution in which nuclei can be clearly seen. H) demonstrates white matter orientation over the whole brain. It was computed as in D but using a smaller window size of 4pxls. The orientation can be seen to clearly follow the expected white-matter tracts.
Imaging glomeruli in adult mouse kidney with MF-HREM
Having developed the sample processing, image acquisition and post-processing pipeline, we imaged a range of samples to demonstrate the potential utility of MF-HREM and to provide comparison to other 3D optical imaging modalities. The three-dimensional structure of glomeruli, networks of small vessels in the cortex of the kidney, have been shown to be a biomarker of renal and cardiovascular disease (39). Using a lectin-Dyelight649 conjugate (Ex/Em 649/670 nm) to stain glomeruli, we acquired MF-HREM data in wild-type, adult mouse kidneys (Figure 6). After image processing steps described above, glomeruli were segmented using a gradient vector flow segmentation technique implemented in Vaa3D(40–42). This algorithm is a widely used extension to a traditional active contour segmentation technique, where the external energy term in the traditional active contour algorithm is replaced with the gradient vector flow field. After segmentation, the kidney cortex was manually labelled (Figure 6A) and any structures segmented that were not within the cortex were removed. The final step used a connected components analysis and filters any small objects from the data.
The MF-HREM analysis revealed a glomeruli distribution that was consistent with their known spatial distribution and with other measures for wild-type (WT) adult mice performed with light sheet or in vivo MRI (39,43) MF-HREM pixel size was 2.17 μm lateral and 2.58 μm axial, enabling identify glomeruli which had a minimum volume of 24×105 μm3.
Imaging tumour blood vessels and cell invasion with MF-HREM
Tumours have notoriously complex blood vessel networks, and three-dimensional imaging has become a useful method to image their complexity and to study drug delivery (8). Additionally, understanding tumour cell invasion has implication for understanding tumour metastasis and potential treatment targets (44). Figure 7 shows MF-HREM imaging of a subcutaneous xenograft tumour mouse model, initiated from the FaDu human breast cancer cell line. Tumour cells were labelled prior to injection with CM-DiI, a medium-term fluorescent cell-tracking dye that endures for approximately four cell divisions, and is transferred through cell division but not cell-cell contact, (Ex/Em 553/570 nm). Tumour vasculature was stained by i.v. administration of fluorescent Lectin-Dyelight649 (Ex/Em 649/670 nm) conjugate. Figure 7A and B show a representative 2D slice with the both stains visible and the 3D reconstruction of the data in both channels.
These data reveal the dense, branching vasculature at the periphery of the tumour, and the labelled cells primarily in the tumour centre, which appeared to be non-perfused. The inset to Figure 7A shows yellow arrows marking what seem to be individual or small clusters of cells in a section of tumour where a group of cells is slightly separate from the main tumour bulk.
This section of tumour when analysed in 3D with the full MF-HREM pre-processing pipeline (Figure 7C) allows the individual cells to be clearly located (yellow arrows) and their x,y,z locations described. Whilst it is unclear whether labelled cells are viable (which would require a different reporter strategy) these results demonstrate the ability of MF-HREM to quantify the 3d location of injected cells in tissue volumes ~1cm3 several weeks after injection.
For the vascular channel, Figure 7D, E and F show the MF-HREM image processing pipeline, with the final vessel segmentation and skeletonisation being carried out using the APP2 algorithm from the Vaa3D neuron tracing plugin (40–42,45). The chaotic nature of the vasculature can be seen from this analysis and such vascular networks can be used in simulations of drug delivery (8) and for understand tumour vessel growth mechanism (46).
Imaging brain microvasculature and white matter tracts in a mouse brain with MF-HREM
The three-dimensional spatial distributions of many brain structures including vasculature cells and white matter are of key importance for understanding healthy brain function and changes in these features are used as biomarkers for a large number of neurological pathologies such as Alzheimer’s (4,47).
Probing these structures in 3D with MF-HREM can provide insight into many of these conditions and may also provide validation for other clinical imaging tools such as MRI. Figure 8 shows the application of MF-HREM in two instances: where a brain is dual labelled with CMDiI as a white matter-marker and lectin-Dyelight649 as a microvascular stain (figure 8A-E); and where a brain is dual labelled with CMDiI as a white-matter marker and HCS Nuclear Mask as a marker for cell distribution (Ex/Em 638⁄686) (Figure 8F-8H). Figure 8B shows a high-resolution sub-volume of the vasculature segmented using the MF-HREM processing pipeline and the MOST tracing algorithm implemented in Vaa3D is used. This algorithm is a rayburst sampling algorithm implemented in a marching fashion (48). The microvasculature can be seen to have a large population of vessels with similar radius (1-4 μm) and a small number of descending vessels with larger radius (~10 μm). This distribution is similar to the mean radius measured in other serial sectioning modalities e.g. MOST (49) and for clearing techniques (50) although no large vessels (>10 μm) are present in MF-HREM data, due to the preferential binding of lectin to microvasculature over larger vessels as noted previously (50).
Another important feature of brain microstructure is tissue orientation particularly for white matter which is routinely measured in clinical settings using diffusion weighted MR (DW-MR). This technique measures brain microstructure based on the constrained diffusion of water within the tissue structures. Despite its widespread use for white-matter tractography, the validation of DW-MR is a much discussed issue (51–53). Performing validation requires high-resolution images over large fields of view which must be registered to MR images if quantitative validation is to be performed. Previously CMDiI has been used on individual histological sections of mouse brain to validate tractography from DW-MR (52,54). Whilst this approach is somewhat successful, it is difficult or even impossible to fully align 2D section with the corresponding MR sections. Figure 8D and 8H show white matter orientation. Orientation is calculated from the structure tensor of the image. A Gaussian gradient and 8pxl window size were used in 8D while a 4pxl window size was used in Figure 8H to reflect the different pixel sizes of the images. The hue, saturation and brightness denote the orientation, coherence and original image brightness respectively. The colour bar shows the angle represented by the hue. Figure 8E shows a polar histogram of the orientation in Figure 8D where all orientations with a coherence greater than a threshold value of 0.2 are displayed. It can be seen there appears to be an even distribution of local orientations over this sub volume.
CMDiI effectively stains white matter tracts due to its lipophilic nature and MF-HREM allows orientation analysis on the entire 3D volume.
Such images, particularly the whole brain in Figure 8H, are ideal for validation of MRI tractography data. Tissue clearing techniques are also often unsuitable for this application as lipophilic dyes are often not retained through the de-lipidation stage of clearing protocols (27).
In addition to white matter, cell distributions are important markers for development and disease. Figure 8G shows a single slice at a higher magnification from the imaging volume in Figure 8F, cell nuclei can be clearly seen and show Nuclear staining has successfully been retained through processing. Further segmentation requires montaging of higher resolution images.
Discussion
In this work, we have shown the development of MF-HREM though sample preparation, imaging and image post-processing and quantification. We have demonstrated its applicability in adult mouse organs through a range staining and quantification approaches. Further improvements to MF-HREM are possible in several areas of the imaging pipeline.
The resin embedding and staining protocol can be improved by optimisation to a specific biological problem, e.g. a custom mould can be used for staining where the orientation and organ are the same for a large number of samples. Additionally, whilst dehydration and embedding times cannot be easily decreased without compromising the final imaging, automation of the process using an automated histological sample processor could improve consistency and enable faster protocol optimisation for a specific application. Despite the increased stain penetration with saponin treatment, difficulties in segmentation remain primarily due to inhomogeneous staining. Diffusion staining alone will always struggle to achieve homogenous stain penetration in a timely manner but the use of smaller staining molecules such as nanobodies (2) or the use of genetically encoded reporters such as SNAP-CLIP (55), may improve this. Making more use of i.v. staining routes could vastly decrease the time needed for overall sample preparation, however, the large volumes of stain needed for these approaches may be a limiting factor (2).
Solving the shine-though artefact is a key challenge for MF-HREM and we have demonstrated two approaches: the inclusion of Orasol Black to physically limit light transmission thorough the sample; and deconvolution using a half zeroed PSF, generated from measurement of the sample stack.
Our post-processing method to remove shine-through provides a sample specific PSF, whilst circumventing the problem of poor signal-to-noise that would occur if PSF’s were used directly from the image stack. It removes the onerous and impractical requirement to measure the PSF using sub resolution beads for each sample, as wavelength, staining, tissue autofluorescence and many other features are likely to change for each sample. Our method provides a fast and easy to implement alternative that can be effective, as shown in our application to brain and tumour microvasculature.
To aid in deconvolution and segmentation, other image-processing approaches such as spectral unmixing (to remove contributions due to spectral overlap in multichannel imaging) and background subtraction via rolling-ball algorithm (to reduce background autofluorescence) were found to improve signal-to-noise ratio, ultimately enabling deconvolution and segmentation. The optimisation of the deconvolution itself is an area that could benefit from further optimisation. In this first instance of MF-HREM use we have used the widely-adopted Richardson-Lucy algorithm with no additional constraints to aid in regularisation, such as a Total-Variation Richardson-Lucy approach, and settled on iteration number via our ability to further segment the data. A fuller investigation into all the parameters and models for deconvolution could further improve and aid in the wider adoption of MF-HREM. In order to make this possible, where specialised post-processing and segmentation algorithms were used, all were from open source software platforms (36,41).
Three-dimensional (3D) optical microscopy has been the focus of a substantial body of research, with several new technologies coming to prominence in recent years. This has enabled numerous new biological insights to be made in neuroscience, developmental biology, cancer and immunology (2,6,8,12).
Despite the obvious utility of large-volume, high-resolution 3D optical microscopy, there remain many challenges. Clearing protocols can often be complex and lengthy, and the technicality of serial sectioning instruments as well as the long imaging times limit their widespread adoption (3,12). All of these factors cause delays in optimising new protocols, restricts studies to small group sizes and often require specialised imaging facilities. This has created a bottleneck in answering the plethora of potentially important scientific questions which could benefit from 3D imaging.
Making large volume high resolution 3D imaging widely available will create faster progress on a range of biological questions and will result in protocols and biological conclusions that are more robust.
In this study, we have developed a pipeline for performing MF-HREM, which enables three-dimensional, multiplexed fluorescence imaging of large tissue samples (> 0.5 cm3), at high resolution. MF-HREM is a block-facing technique, using a commercially available system (Optical HREM, Indigo Scientific, UK), that overcomes shine-through with a combination of a resin opacifying agent (Orasol Black) and image deconvolution. This technique could find wide application through its avoidance of optical sectioning, tissue clearing or the need for a custom built instrument.
Methods
Animal models
All animal studies were licensed under the UK Home Office regulations and the Guidance for the Operation of Animals (Scientific Procedures) Act 1986 (Home Office, London, United Kingdom) and United Kingdom Co-ordinating Committee on Cancer Research Guidelines for the Welfare and Use of Animals in Cancer Research (56)
Perfuse fixation
All animals were euthanized via i.p. injection of 100 mg kg−1 sodium pentobarbital (Animalcare, Pentoject) diluted in 0.1 ml phosphate buffered saline (PBS). Once anaesthesia was confirmed, surgical procedures for cardic perfusion were performed for systemic clearance of blood. Heparinized saline (20ml) (0.2 ml, with 1,000 IU ml−1, maintained at 37 °C) was administered with a perfusion pump (Watson Marlow, 5058) at a flow rate of 3 ml min−1 to mimic normal blood flow. After the complete drainage of blood, mice were perfused with 20 ml of 4% paraformaldehyde (PFA, VWR chemicals 4°C). Organs were then removed and fixed for 2-24h in 4% PFA at 4 °C.
Murine tumour xenograft model
Eight-to ten-week-old, female, immune-compromised nu/nu nude mice (background CD1) were used (Charles River Laboratories). Cells from the FaDu human breast cancer cell line (gifted from Dr Craig Murdoch (Sheffield University)) were cultured in complete medium (Dulbecco’s minimum essential medium Eagle with L-glutamine (DMEM) (Lonza) + 10% fetal bovine serum (Invitrogen)) in the ratio 1:10 (vol/vol) and incubated at 37 °C and 5% CO2. To prepare for injection, cells were washed with Dulbecco’s phosphate buffered saline and detached with trypsin-EDTA (7-8 min, 37 °C, 5% CO2) (Sigma). Cells were labelled with CMDiI (Thermofisher UK). Stain was dissolved from stock concentration (1mg/ml in Ethanol) in D-PBS to a working solution of 1 μM. Cells were incubated in the working solution for 5 minutes at 37°C, and then for 15 minutes at 4°C. Cells were then washed and re-suspended in PBS for injection. A 100 μl bolus of 1 × 10⁶ cells was injected subcutaneously into the left flank above the hind leg of each mouse (N=5), Non-prestained cells were injected into the right flank. Tumour growth was measured daily with callipers, every day after tumour became palpable, and were grown until total tumour volume was 1500mm3 or three weeks post-injection has elapsed.
For blood vessel staining, 200 μl Lectin (Tomato) bound to DyeLyte-649 (Vector UK) (1 mg/ml) was administered via tail vein injection and allowed to circulate for 10 minutes before perfusion fixation to allow sufficient binding to the vascular endothelium (8).
Stain penetration
A variety of mice which had not had procedures that would affect this experiment (e.g. mice with failed subcutaneous tumour induction or those that had been used for MRI sequence tests) were used in order to reduce the number of animals used. All mice were between 10-23 weeks old. They were perfuse fixed as above and both kidneys were removed. Each animal was randomly assigned to one of the four groups (saponin, freeze-thaw, iDISCO and proteinase [K] digestion) and for each animal one kidney was randomly assigned to treatment and the contralateral kidney retained as a matched control. In the saponin, iDISCO and proteinase [K] groups, the control kidney was maintained in PBS and at the same temperature as the treated kidney. For the freeze-thaw group, the control kidney was dehydrated and rehydrated through the same methanol series but with no freeze-thaw cycles applied.
Freeze-Thaw
Kidneys were dehydrated through a methanol in dH2O series: 20%, 40% 60%, 80%, 100% for 1 hr in each (7ml per kidney). Kidneys were freeze-thawed 3 times for 20 mins each time at −80 °C. Kidneys were then rehydrated through methanol series 80%,60%,40%,20%, 0% (1 hr each).
iDISCO
Kidneys were washed in PTX.2 1hr two times at room temp. Kidneys were incubated overnight at 37°C in a solution containing 1xPBS, 0.2% Triton-X (Sigma UK), 20% DMSO (Sigma UK). Kidneys were then incubated overnight at 37°C in a solution of 1xPBS, 0.1% Tween-20 (Sigma UK), 0.1% Triton-X, 0.1% Deoxycholate (Sigma UK), + 0.1% NP40 (Sigma UK), 20% DMSO.
P[K]
Tris Buffer containing 1.21 g Tris (Sigma UK), 0.147 g CaCl2.H2O, (Sigma UK), 65 ml dH2O, 30 ml glycerol (Sigma UK) was made and 40 μg/mL proteinase [K] (Sigma UK) was added. The sample was incubated at room temp for 10 mins, with constant agitation before being washed on PBS x3 for 10 mins each.
Saponin
A solution containing 2 g of gelatin (VWR) in 1 L PBS was made and filtered immediately. After allowing the solution to chill, 5 mL of Triton X-100, 0.1 g of sodium azide (Sigma UK) and 10 mg/ml saponin (Sigma UK) was added to the solution. Kidneys were incubate for (72 hrs) in 3 ml of solution (PBS for control kidneys) at room temp. with constant agitation.
After treatment, all kidneys were stained for 94 hrs in HCS Nuclear mask (Thermo Fisher UK) in 40 μl/10ml PBS at room temperature and with constant agitation.
Spectroscopy
The transmission spectrum of Orasol Black was measured using an HG4000CG-UV-NIR (Ocean Optics) fibre-fed spectrometer. Samples of Technovit 8100 base sol. plus catalyst 1, with a low concentration (0.1 mg/mL) of Orasol Black, were measured in a PMMA semi-micro cuvette over a 4 mm path length, from 350 nm to 95 nm with a QTH10/M (Thorlabs) continuum lamp. The transmission spectrum (Figure 3) has been compensated for the cuvette reflectivity and PMMA absorption.
3D standard cell culture samples
Compressed type I collagen hydrogels (RAFT UK) were used as standardized samples for testing stain compatibility with tissue processing and for quantification of shine-through. Samples were prepared in a 24 wellplate using the protocol described by the manufacturer, with the addition of SW1222 colorectal cancer cells at 100,000 cells/mL (57). Samples were fixed with 4% PFA for 20 mins. Post-fixation, cell nuclei were stained with the addition of HCS nuclear mask deep red 2 μL/mL in PBS incubated for 30 mins. Samples were then processed for MF-HREM as described in Table 1.
Resin testing
Multiple candidate resins were tested for setting time, compatibility with opacifying agents final block hardness and quality of cut. Resins used were Technovit 7100 (Heraeus Kulzer, Germany), Technovit 8100 (Heraeus Kulzer, Germany), Spurr resin (Polysciences Inc, USA), LR White (Sigma-Aldrich, USA) and Lowicryl HM20 (Polysciences Inc, USA). Technovit 7100 is a 2-hydroxyethyl methacrylate-based plastic resin, and was prepared using 1 g Technovit 7100 hardener 1 dissolved in 100 mL Technovit 7100 resin. Technovit 7100 hardener 2 was used the catalyze the polymerisation reaction, added in a ratio of 1:15 Hardener 2 to resin.
Technovit 8100 had a similar composition: 0.5 g of Technovit 8100 Hardener 1 dissolved in 100 mL Technovit 8100 resin. The catalyst, Technovit 8100 Hardener 2, was added in a ratio of 1:30 catalyst to resin.
Spurr is an epoxy resin, and was prepared using 4.1 g ERL, 1.43 g diglycidyl ether of polypropylene glycol, 5.9 g nonenylsuccinic anhydride and 0.1 g dimethylaminoethanol accelerator.
LR White is an acrylic resin and was prepared using 2 g benzoyl peroxide accelerator per 100 mL resin.
Lowicryl HM20, a methacrylate resin, was prepared with 0.6% (w/w) benzoyl peroxide accelerator.
Hardness testing was conducted on blocks after they had set using either a Shore durometer D or Shore durometer A. Cut quality was assessed by imaging a block with a mouse kidney embedded using Optical HREM (Indigo Scientific, UK) and counting the number of slices which had areas of flaky resin or voids.
Image post-processing and analysis
Image analysis was carried out using a combination of ImageJ (Fiji distribution)(36), Vaa3D (40–42), Python and Amira.
Shine-through analysis
Shine through analysis was performed in Fiji and Matlab as follows:
Gel image stacks were down-sampled in xy to create isotropic voxels, background subtraction using rolling-ball algorithm with 50 pxl radius, and sliding parabola was used to remove autofluorescent background. Image stacks were resliced into xz stacks. Single isolated cells were manually found in the stack and an ROI was drawn to fully enclose all pixels with intensity above the background. The intensity profile of the ROI was calculated by averaging the intensity over the ROI columns (z-direction). This average signal was truncated at the maximum intensity and fit to a single exponential model in Matlab using a non-linear least squares approach, with start values of 0.5 for I0 and τ and limits of ± ∞ (other start values were checked and no difference to final fit parameters was found).
Post processing of image stacks
Spectral unmixing was performed via the Fiji plugin as per the documentation (58). Background subtraction was performed using a rolling-ball algorithm with sliding parabola using a window size dependent on the smallest features of interest in the image stack. Median filtering was performed using the 3D Median filter plugin in Fiji with 1 pxl window size (36).
Fitting of a manually extracted PSF to the model was performed in Matlab using the fitting tool box for the case of Gaussian fits. For diffraction kernel PSFs (higher magnification images) FWHM (x,y,z) were measured in the extracted PSFs. To provide a measure of the lateral spread of the PSF the area of the diffraction pattern in the xy plane t two z slices were divided by one another. The first z slice was at the FWHM (z), the second slice was the z slice just before the abrupt change to zero, (i,e. the comet end of the comet-tail artefact). This is the ratio top/bottom used in DeconvolutionLab (59) to parameterise a variety of their synthetic PSFs).
The diffraction limited PSF was then generated using ImageJ ops (60) from microscope and sample parameters: sample refractive index RIsample = 1.5 for the sample (refractive index of Technovit 8100), RIimmersion = 1.0, NA of 0.25, offset 0 μm working distance 150 μm (default), xy spacing-dependent on sample pixel size, z spacing – dependent on cut thickness, wavelength – sample dependent. This PSF was measured as above and small (50 nm) manual variation in wavelength was used to iteratively optimise the PSF to match the sample.
Once a PSF was synthetically generated at the same size as the image stack to be deconvolved the PSF was zeroed in the lower half and background subtracted (pixel intensities less than 0.001 in 32 bit images were zeroed). This PSF was then used in the RL deconvolution algorithm of ImageJ ops using a border size of ¼ the image size in each dimension respectively. Iteration number was tested for each sample and 20 iterations for high magnification to produce adequate deconvolution without noise enhancement. For lower magnification samples 35 iterations was necessary to produce adequate deconvolution and prevent noise enhancement.
Kidney Glomeruli segmentation
Vessel tracing was performed in Vaa3D Gradient Vector Flow algorithm (40–42), with diffusion iteration of 5. Connected component analysis was performed in Amira with a threshold minimum size of 10000 μm3 based on literature estimates for glomeruli (43). No deconvolution was necessary owing to the size of the structures being imaged, by comparison to the pixel size.
Tumour vasculature segmentation
Tumour images used Gaussian PSF’s for deconvolution with parameters of σx = σy = 4 and σz = 80 for the Lectin-Dyelight649 channel and σx = σy = 4 and σz = 40 for the CMDiI channel. Both used 35 iterations of the Richardson-Lucy deconvolution.
For tumour vasculature following deconvolution, vascular segmentation was performed using the APP2 algorithm of Vaa3D described previously (40–42,45). Parameter values were Threshold =1(auto thresholding), CNN=3, GSBT was used and other parameters were used at their default values.
Brain Structures
Brain microvasculature was deconvolved using a diffraction kernel with parameters specified above including xy pixel size of 570 μm and z pixel size of 1720 μm and wavelength of 700 nm. Segmentation was in Vaa3D via the MOST tracing algorithm, (40–42,48) using a threshold determined by Otsu threshold of 20, seed size 6 and slip size 20. White matter orientation analysis was performed using the OrientationJ plugin of Fiji with a Gaussian gradient and kernel sizes of 8 or 4 for Figures 8D and 8E respectively. HSB images were created with orientation, coherence and original image brightness as the three channels respectively.
HREM imaging
All MF-HREM imaging is carried out using the Optical-HREM instrument (Indigo Scientific, UK). Samples are mounted into the instrument and initially the block are sectioning without imaging to ensure a block surface exactly perpendicular to the optical axis. Once a flat surface is achieved, the desired slice thickness, x,y resolution, focus, total imaging depth, and exposure and gain for each wavelength are set. An air blower and vacuum are positioned to remove serial slices as they are sectioned. Imaging then proceeds in a fully automated manner until the total imaging depth has been achieved.
Competing Interests
The authors have no competing interests to declare
Acknowledgements
We would like to thank Craig Murdoch for the kind gift of the FaDu cell line.
Footnotes
Figure sizes revised to aid readability
References


