

Abstract
Transfer RNAs (tRNA) are crucial adaptor molecules between messenger RNA (mRNA) and amino acids. Recent evidence in plants suggests that dicistronic tRNA-like structures can also act as mobile signals for mRNA transcripts to move between distant tissues. Co-transcription is not a common feature in the plant nuclear genome and, in the few cases where polycistronic transcripts have been found, they include the expression of non-coding RNA species such as small nucleolar RNAs and microRNA clusters. It is not known, however, the extent to which dicistronic transcripts of tRNA and mRNAs are expressed in field-grown plants, or the factors contributing to their expression. To address these questions, we analysed tRNA-mRNA dicistronic transcripts in the major horticultural crop grapevine (Vitis vinifera) using a novel pipeline developed to identify dicistronic transcripts from high-throughput RNA sequencing data. We identified dicistronic tRNA-mRNA in grapevine leaf and berry samples from 22 commercial vineyards covering six sub-regions of the Barossa wine growing region, Australia. Of the 124 tRNA genes that were expressed in both tissues, 18 tRNA were expressed forming part of 19 dicistronic tRNA-mRNA molecules. The presence and the abundance of dicistronic molecules was tissue and geographic sub-region specific. In leaf tissue, the expression patterns of dicistronic tRNA-mRNAs significantly correlated with tRNA expression, suggesting that transcriptional regulation of their expression might be linked. We also found evidence of evolutionary conservation of dicistronic candidates in grapevine, and previously reported dicistronic transcripts in Arabidopsis, indicating a syntenic genomic arrangement of tRNAs and protein coding genes between species.
Introduction
Polycistronic mRNAs are RNA molecules that contain two or more open reading frames (ORFs). These are usually found in viruses, bacteria, archaea, protozoans and invertebrates (Karginov et al. 2017). Polycistronic transcripts are synthesized when multiple genes forming an operon are coexpressed from a single promoter. These transcripts are then translated into protein from two or more translation initiation sites. This strategy has been described as an efficient mechanism to coordinate gene expression (Karginov et al. 2017). Although polycistronic transcripts are less common in plants, several chloroplast genes are organized in clusters and are co-transcribed in polycistronic primary transcripts and subsequently processed to form mature RNAs (Sugita and Sugiura 1996), reflecting their prokaryotic ancestry (Barkan 2011). The majority of nuclear-encoded genes in plants are monocistronic with a few exceptions, such as certain classes of polycistronic microRNAs (miRNAs) (Merchan et al. 2009) and small nucleolar RNAs (snoRNAs), which are organized in genomic clusters and are transcribed from a common promoter (Kruszka et al. 2003; Leader et al. 1997). These precursor transcripts are processed to mature snoRNA and miRNA molecules. There are also a few reports of dicistronic transcripts encoding genes that are not functionally related to each other such as tRNAs-snoRNA, snoRNA-miRNAs and tRNA-mRNA in some plant species (Kruszka et al. 2003; Michaud et al. 2011; Qu et al. 2015; Zhang et al. 2016); however, the molecular and physiological significance of cotranscription for many of these transcripts is still poorly understood.
Recent work in model plants, Arabidopsis thaliana and tobacco, has shed light on the function of dicistronic tRNAs-mRNAs (Zhang et al. 2016). Using transgenic lines, Zhang et al. (2016) demonstrated that tRNA-like structures (TLSs), when co-transcribed with mRNA transcripts, could act as mobility signals, triggering the systemic movement of the mRNA between roots and shoots. Notably, the mRNA components of the dicistronic transcripts were also shown to be translated into functional proteins. Endogenously produced tRNA-mRNA dicistronic transcripts have also been detected in A. thaliana suggesting that functional tRNA and tRNA-like structures could act as non-autonomous signals in plants able to deliver functional mRNAs to distantly located tissues. Beyond their canonical role in protein translation, tRNAs have been also demonstrated to function in other chemical transformations, for example, delivering amino acids during lipid modification and antibiotic biosynthesis (Banerjee et al. 2010; Francklyn and Minajigi 2010).
In grapevine (Vitis vinifera), the effect of growth environment on gene expression has been extensively studied (Dal Santo et al. 2013; Liu et al. 2012; Pontin et al. 2010; Sun et al. 2015a). Several studies have identified small non-coding RNAs (sRNAs) in grapevine that can influence development in response to environmental stimuli. Among these sRNAS, miRNAs respond to low temperature treatment (Sun et al. 2015b), application of exogenous gibberellin (Han et al. 2014) and viral infection (Alabi et al. 2012). In addition, studies have shown that miRNAs present tissue specificity in grapevine (Pantaleo et al. 2010; Wang et al. 2011). Bester et al. (2017) identified sRNA species in grapevine phloem. Notably, this study also showed the nonrandom manner in which tRNA-derived sRNAs originated (Bester et al. 2017). A study looking at the effect of grafting in grapevine identified more than 3000 genes transporting mRNA across graph junctions including genes for response to abiotic stress and signal transduction (Yang et al. 2015). Moreover, there is evidence of both passive and selective mechanisms of mRNA trafficking in grapevine (Yang et al. 2015) and Zhang et al. (2016) confirmed that 11% of the mobile mRNA also had TLS motifs in their coding sequence or 3’ UTR.
We hypothesized that dicistronic tRNA-mRNA transcripts would be transcribed differentially between different grapevine tissues and in growing regions with different environments. As a first step towards identifying such transcripts, we present DiRT (Dicistronic RNA Transcripts), a computational pipeline to detect dicistronic transcripts from short-read RNA-seq data that can be adapted for use in any organism. Using this pipeline, we analysed dicistronic tRNA-mRNA transcripts in commercial, field-grown grapevine and assessed the effect of regionality on their expression profile.
Results
RNA-sequencing of Vitis Vinifera cv. Shiraz
To identify tRNA-mRNA dicistronic transcripts in Vitis Vinifera cv. Shiraz, we performed RNA-seq of libraries from two different tissues, leaf and berry, collected at budburst (E-L 7) and veraison (E-L 35) (Coombe 1995) respectively, from 22 vineyards from the Barossa wine growing region, South Australia, Australia (Figure 1). The region divides into six sub-regions, each with unique combinations of growing environments with factors such as temperature, rainfall, soil type and elevation contributing to differences in plant growth, berry composition and wine characteristics (Robinson and Sandercock 2014).
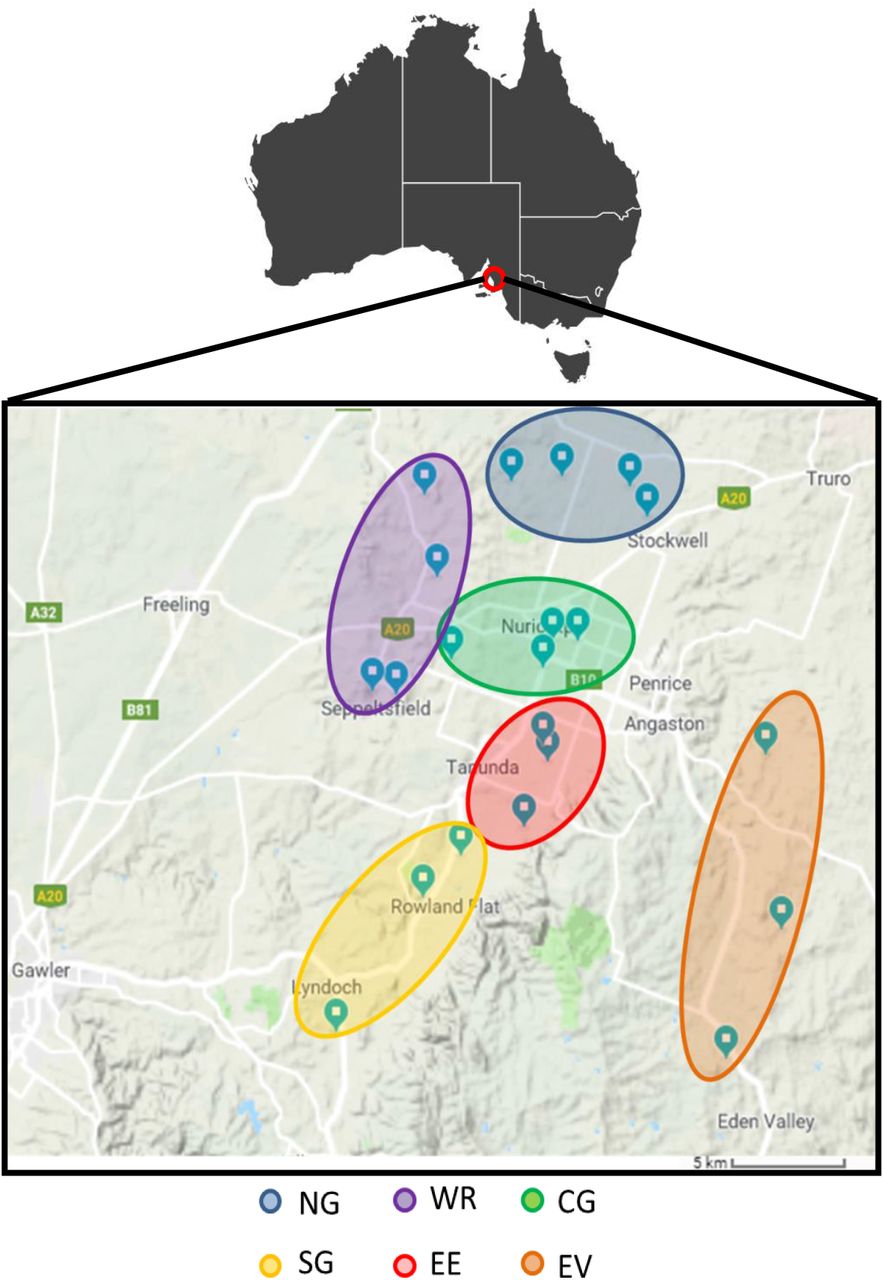
Geographical location of grapevine tissue samples analysed in this study. Leaf and berry samples were harvested from selected vineyards from the Barossa wine region, Australia. Northern Grounds (NG, blue) Central Grounds (CG, green), Southern Grounds (SG, yellow), Western Ridge (WR, purple), Eastern Edge (EE, red) and Even Valley (EV, orange).
Sequencing reads were aligned to the V. vinifera reference genome (IGGP_12X from EnsemblPlants) with an average mapping percentage of 90% for leaf and 87% for berry samples. We obtained an average of 23 million and 21 million paired-end (2×75 nucleotide) Illumina reads for each leaf and berry sample (three plants per sample, three samples per vineyard) (Supplemental Table S1).
Identification of putative dicistronic tRNA-mRNA transcripts
We searched for combinations of tRNA and adjacently located protein coding mRNA genes that were expressed forming one continuous transcript. With that objective, we developed DiRT, a bioinformatic pipeline to systematically analyse high-throughput, short read-based RNA-sequencing data for actively co-transcribed tRNA-mRNA loci (Figure 2). The pipeline takes into consideration reads mapping in the tRNA, mRNA and the intervening intergenic region to predict dicistronic tRNA-mRNA candidates. Biological replicates were used to estimate background noise and improve the accuracy of the predictions.

Schematic workflow of the DiRT pipeline to identify dicistronic candidates from RNA-seq data. tRNA gene and protein coding gene coordinates were retrieved from GtRNAdb and Ensembl Plants respectively. tRNA-protein coding gene pairs that occupied contiguous spaces in the genome were assembled and selected for subsequent analysis if they were transcribed based on RNA-seq reads (Raw read >= 1 for tRNAs and raw read >= 10 in PCGs). Dicistronic tRNA-mRNA are identified by assessing active transcription of the intergenic region. Candidate tRNA-mRNA are selected if the intergenic regions had significantly higher expression (FDR < 0.05) than the closest two introns. Pairs of tRNA-gene are classified as putatively dicistronic tRNA-mRNA if the intergenic region showed continuous sequencing coverage between the tRNA and the mRNA of the protein coding gene.
The Genomic tRNA Database predicts 609 tRNA genes in the V. vinifera genome based on the tRNAscan-SE tool (Chan and Lowe 2016). From these, 116 tRNA genes overlapped with protein coding genes (PCGs) (5’ or 3’ untranslated regions or introns) and were removed from further analysis since such reads could not be unambiguously assigned to either the tRNA or the PCG.
Using DiRT, we detected 124 and 90 transcribed tRNA genes (read count ≥ 1) in leaf and berry tissue samples, respectively, across all sub-regions. Individual tRNA genes displayed a wide-range of transcript abundances covering the 20 isoacceptor families in both leaves and berries, showing a distinct tRNA expression profile across the six regions analysed (Supplemental Fig S1 and Supplemental Table S2). We assembled combinations of tRNA-PCGs and identified 81 expressed tRNA-mRNA combinations (Figure 3A) in leaves and 50 in berries. As the intergenic region between the transcribed tRNA and mRNA for sequence reads would be indicative of cotranscription, we tested the significance of reads in the intergenic region to eliminate background noise attributable to DNA contamination or spurious transcription events that would not be observed in biological replicates. tRNA-mRNA combinations were selected for further analysis only if the coverage of their intergenic region was significantly higher (t-test, FDR < 0.05) than reads detected in the two closest introns (Figure 3B). Finally, candidates that passed both tests were tested for continuous read coverage in the intergenic region indicating transcriptional read-through of the region between the tRNA and the mRNA (Figure 3C). DiRT identified 16 dicistronic tRNA-mRNA transcripts in leaves and nine in berries, of which six were present in both tissues (Table 1) across 13 of the 19 V. vinifera chromosomes. Sequencing coverage was significantly higher (t-test, FDR < 0.05) in intergenic regions than in the first two introns of dicistronic tRNA-mRNA pairs. Conversely, no significant difference in coverage was observed for tRNA-mRNA pairs deemed non-dicistronic (Supplemental Fig S2).

Assessing active transcription of intergenic region of putative dicistronic tRNA-mRNAs transcripts from RNA-seq data. A) Gene model of dicistronic tRNA-mRNA transcript in which the intergenic region was expressed B) Average read coverage of the intergenic region versus the closest two introns of a tRNA-mRNA combination that passed B) (tRNAGly-GCC-1-6 VIT_08s0058g00460) and failed C) (tRNATyr-GTA-4-1 VIT_00s0505g00030) the t-test (p-value < 0.05). C) Genome browser view of a candidate dicistronic tRNA-mRNA formed by tRNAGly-TCC-1-6 and VIT_13s0064g00200 identified using the DiRT pipeline.
Dicistronic tRNA-mRNA candidates identified from RNA-seq data in leaves and berries of grapevine.
In total, 19 individual tRNA genes, representing 13 isoacceptor families were found to be dicistronic with the neighbouring protein coding genes, among which, glycine tRNA genes were the most common. We validated, through RT-PCR, two randomly selected tRNA-mRNA dicistronic candidates (i.e. tRNAValCAC-VIT_15s0046g02860 and tRNAProTGG2.9-VIT_18s0001g09050) identified using DiRT. Primers were design to perform PCR amplification from the tRNA to the intergenic region from cDNA of leaf samples (Figure 4A). For the two candidates tested, a single band of the expected product size was obtained (Figure 4B). Sanger sequencing of the PCR product confirmed the amplification of the intergenic regions (Figure 4C, Supplemental Table S3).

RT-PCR confirmation of identified dicistronic transcripts. Model of putative dicistronic tRNA-mRNA transcript showing primers used for cDNA synthesis (cDNA rev.) and for the PCR reaction (RT-PCR For and RT-PCR Rev). Confirmation of actively transcribed intergenic region through RT-PCR for candidates A) tRNA ValCAC-VIT_15s0046g02860 (376 bp) and B) tRNAProTGG-VIT_18s0001g09050 (172 bp). +RT: cDNA as template, gDNA: genomic DNA was used as a control, -RT: RT-PCR negative control, EF1a: Elongation Factor 1-alpha was used as a positive control (150 bp), -Ctr: PCR negative control. Alignment of the sequenced PCR product for candidate C) tRNAValCAC-VIT_15s0046g02860 and D) tRNAProTGG-VIT_18s0001g09050 to the expected PCR product confirmed active transcription of the intergenic region.
Characteristics of grapevine dicistronic tRNA-mRNA candidates
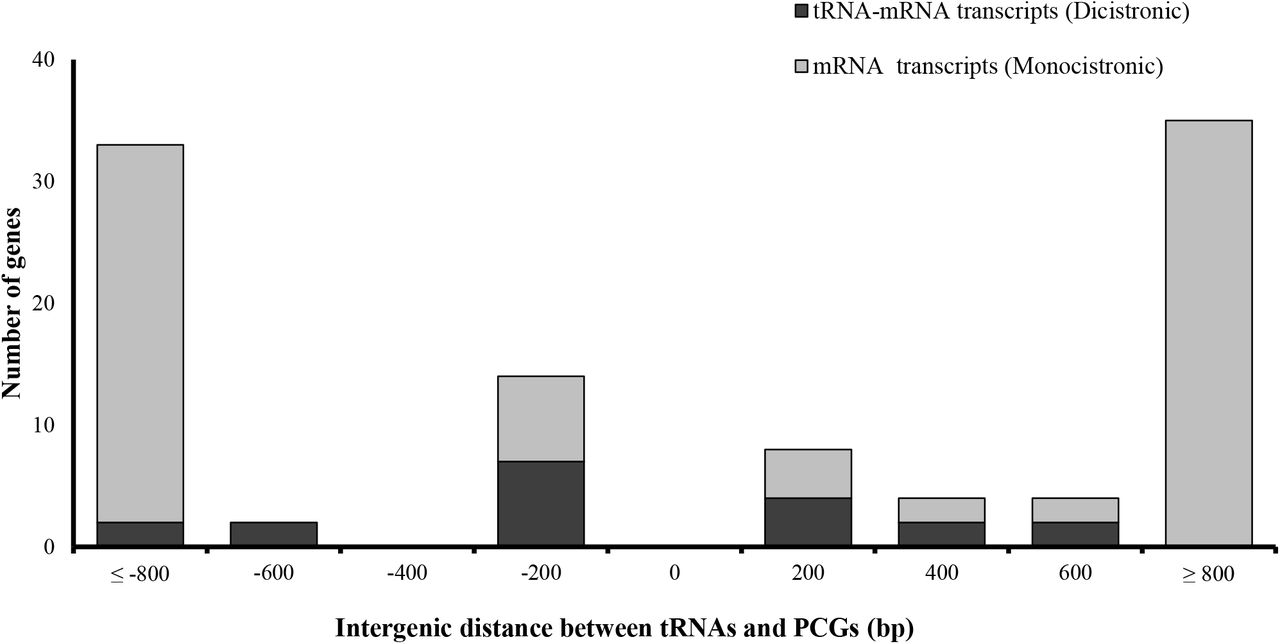
The genomic distance between expressed tRNA and PCGs that formed dicistronic transcripts was no longer than 1065 base pairs (bp), with a median intergenic distance of 133 bp (Figure 5). The observed frequency of mRNAs forming dicistronic transcripts decreased with distance both upstream and downstream from the tRNA component of the dicistronic pair. We next analysed the upstream and downstream sequences of the dicistronic tRNA in search of cis-acting signals that might explain transcriptional read-through to the adjacent PCG. Sequence analysis of 20 bp upstream and downstream of the dicistronic tRNA revealed the presence of canonical motifs associated with tRNA transcription efficiency (Supplemental Fig S3) (Michaud et al. 2011; Yukawa et al. 2000). This included a high proportion of A nucleotides upstream of the transcription start site, important for maintaining high tRNA expression, and a short stretch of downstream T nucleotides for RNA Polymerase III transcription termination. We did not identify any novel conserved sequence between the dicistronic candidates that could act as a mediating signal for the co-transcription of the tRNA and PCG.

Genomic distance between protein coding genes (PGCs) and tRNA for dicistronic and monocistronic transcripts. Vertical bars show the number of neighbouring tRNAs and PCGs pairs forming putative dicistronic tRNA-mRNA transcripts (red), or monocistronic transcripts (blue).
When we compared the expression of both mRNAs and tRNA deemed to be dicistronic in this study against the background of all expressed genes, we found that dicistronic tRNA-mRNAs’ expression did not correlate with high abundance genes in either leaf or berry tissue (Supplemental Fig S4). Most values of gene and tRNA expression were between the 25th and 75th % of the distribution of the total gene expression.
Of the nineteen PCGs that formed dicistronic transcripts, fourteen have annotated functions and five are described as uncharacterised in the EnsemblPlants release 45 database (Kersey et al. 2018) (Supplemental Table S4). Six of the fourteen characterised genes are associated with functions relating to nucleic acid binding or processing activity and three are involved in the flavin biosynthesis pathway. A BLAST search in the Arabidopsis thaliana genome revealed 11 of the 19 Vitis dicistronic PCGs have a closely related A. thaliana ortholog that is either dicistronic (4/11) (Zhang et al. 2016) or the mRNA has been demonstrated to be mobile (8/11, PlaMoM database) (Guan et al. 2017) (Supplemental Table S4). Notably, the common A. thaliana dicistronic PCGs are also co-transcribed with the same tRNA isodecoder as in grapevine.
Regional patterns of dicistronic expression
We next assessed if the geographical origin of the samples had an effect on the expression of dicistronic transcripts. We first analysed the expression of all tRNAs expressed in each tissue and we used hierarchical clustering to group sub-regions according to their tRNA expression patterns in leaves and berries. Both tissues presented two main clusters containing three subregions each (Figure 6). The tRNA expression in Eastern Edge and Northern Grounds clustered together in both tissues, while the clustering of the four other subregions were tissue dependent. We then analysed the expression of the tRNA genes, the intergenic regions and PCGs forming dicistronic transcripts independently. We used RNA-seq reads mapping specifically to the intergenic region as a proxy to estimate expression patterns of dicistronic candidates, as reads mapping to the flanking tRNA and PCG loci could originate from both monocistronic and dicistronic transcripts (Figure 6). Sub-regional clusters for tRNAs forming part of dicistronic constructs were similar to those observed for all expressed tRNAs in both tissues (Figure 6). In leaf, one of the main clusters (SG, EE and NG) was the same for all expressed tRNAs and tRNAs that were part of dicistronic constructs. While in berry, EE/NG and CG/WR clusters were the same in all expressed tRNAs and dicistronic tRNAs. EE/NG and CG/WR clustered together in both tissues, while SG and EV clustering was tissue dependant. When the expression of the intergenic regions and dicistronic PCGs was used rather than tRNA, sub-regional clustering was tissue and dicistronic construct component specific (intergenic region or PCG) (Figure 6).

Effect of region of origin on the expression of dicistronic tRNA-mRNAs. Top panel: Schematic representation of RNA-seq reads mapping when originated from a dicistronic transcript (purple bars), a monocistronic tRNA transcript (blue bars) and a monocistronic protein coding gene (red bars). Bottom panel: Heatmap of the expression (logCPM) of all expressed tRNAS, dicistronic tRNAs, intergenic region and dicistronic protein coding genes (rows) for each sub-region from the Barossa Wine growing region (columns) for leaf and berry samples. Dendrograms represent the hierarchical clustering analysis of the sub-regions according to each genomic feature expression pattern.
Local Fisher Discriminant Analysis (LFDA) on expression patterns of all expressed tRNAs and the dicistronic construct components (i.e. dicistronic tRNAs, PCG and intergenic regions), showed that PCGs’ expression patterns occupying and a unique eigen space, while dicistronic tRNAs and and intergenic regions shared the eigen space occupied by all expressed tRNAs (Supplemental Fig S5). Consistent with this observation, correlation analyses of the expression of the different part of the candidates dicistronic transcripts showed that the absolute values of Pearson correlation coefficients were generally higher between the expression of dicistronic tRNAs and the expression of the intergenic region than between the expression of PCGs and the expression of the intergenic regions on both tissues (Supplemental Table S5). These correlations were only significant (Pearson correlation, p-value < 0.05) between dicistronic tRNAs and intergenic regions in leaves (Supplemental Table S5).
Discussion
In this study, using an RNA-seq approach, we found that 15.3% (19/124) of all expressed tRNAs in grapevine leaf and berry samples were putatively expressed in a dicistronic manner, with neighbouring protein coding genes. We developed DiRT, a customised, computational pipeline to specifically detect co-transcribed tRNA and mRNA candidates using stringent criteria. Using DiRT we were able to identify dicistronic transcripts in two different grapevine tissues (i.e. leaf and berry) sampled from commercial vineyards. Validation of the pipeline to accurately predict dicistronic candidates was confirmed through RT-PCR detection and Sanger sequencing of dicistronic candidates in leaf samples.
Interestingly, of the 12 tRNA isoacceptor families (representing 15 distinct anticodons) found to be dicistronic in Vitis vinifera, 11 tRNA families have also found to be dicistronic in A. thaliana, suggesting conservation amongst plant tRNAs that form dicistronic transcripts. Furthermore, the 11 tRNA families in A. thaliana were dicistronically associated with transcripts that were demonstrated to be mobile between roots and shoots (Thieme et al. 2015; Zhang et al. 2016). Among these tRNA coding for GlyGCC and MetCAT were able to mobilise mRNA transcripts to different tissues as part of a fusion construct and translate into functional proteins in grafted A. thaliana plants indicating that these tRNA were able to confer mobility to these transcripts. (Zhang et al. 2016). This suggests a non-autonomous role for dicistronic tRNAs in delivering mRNA transcripts to distantly located tissues. A recent study also revealed that mobile RNA transcripts are enriched in the modified base 5-methylcytosine (m5C), indicating a role of RNA cytosine methylation in systemic RNA movement (Yang et al. 2019). In plants, tRNA and mRNA m5C methylation is mediated by the methyltransferases DNMT2 and TRM4B (Burgess et al. 2015; Cui et al. 2017; David et al. 2017) and loss of these enzymes was demonstrated to impair transcript mobility (Yang et al. 2019). Future studies will need to be undertaken to determine if the dicistronic tRNAs identified in this study also confer mRNA mobility and to assess the role of cytosine methylation in mRNA transport in grapevine.
Interestingly, for four of the 19 dicistronic candidates we also observed sequence conservation between A. thaliana and V. vinifera for the protein coding gene and the adjacently co-transcribed tRNA genes. The dicistronic activity at these conserved loci may provide an explanation of why such syntenic clusters are conserved through evolution and suggests that these transcripts may have an important functional role.
Of the 19 dicistronic tRNA genes identified in the Vitis vinifera genome, 18 were located fewer than 1000 base pairs from the co-transcribed protein coding gene (median distance 133 bp). Our findings suggest that tRNA genes and protein coding genes need to be closely positioned in the genome in order to form dicistronic transcripts. Similar observations were obtained in A. thaliana, where the majority of the previously identified PCGs forming part of mobile dicistronic transcripts were located less than 200 bp from their partner tRNA (Zhang et al. 2016). This genomic proximity rule has been found to extend to the dicistronic tRNA-snoRNA genes that have been identified in higher plants (A. thaliana, M. truncatula, P. trichocarpa, O. sativa and B. distachyon) in which the intergenic region ranged between 1 to 16 base pair (Michaud et al. 2011).
Previous studies have indicated that a large proportion of mobile transcripts are also highly abundant (Calderwood et al. 2016; Thieme et al. 2015). This suggests that passive diffusion of these transcripts through the phloem may contribute to their mobility. A significant proportion (11.4%) of these transcripts was subsequently shown to be dicistronically associated with tRNA (Zhang et al. 2016). However, when we assessed the expression levels of mRNA and tRNA that formed dicistronic transcripts in grapevine, we did not observe higher abundance of these transcripts in either tissue analysed. Thus, in our study, the expression level of the tRNA and mRNA was not a good indicator of the formation of dicistronic transcripts.
In eukaryotes, tRNA and mRNA are transcribed by different types of RNA polymerase. RNA polymerase II (Pol II) transcribes protein coding genes and RNA polymerase III (Pol III) for a variety of genes that generally encode for RNAs with catalytic activity such as tRNA (Schramm and Hernandez 2002). Results from Kruszka et al. (2003) suggested that, in A. thaliana, dicistronic tRNA-snoRNA are transcribed by Pol III from the tRNA gene promoter. However, Pol III transcribes genes shorter than 400 base pairs (Schramm and Hernandez 2002) and the dicistronic transcripts identified in our study were considerably longer (between 1486 to 6002 bp) suggesting Pol III may not be co-transcribing these transcripts. A comparative analysis of flowering species showed a poly-T stretch immediately downstream of ≥ 90% of tRNA genes (Michaud et al. 2011). Additionally, this study reported that the few tRNAs lacking poly-Ts were capable of forming dicistronic transcript with snoRNAs. The authors hypothesized that the lack of the poly T transcriptional termination signal could be a possible explanation for why these transcripts were transcribed as a single unit by Pol III. Sequence analysis of the upstream and downstream sequences of the dicistronic tRNAs identified in our study revealed canonical elements previously associated with transcription start and termination (Michaud et al. 2011; Yukawa et al. 2000). In particular, all dicistronic tRNA transcripts we identified had a poly-T termination signal suggesting the transcriptional read-through mechanism for these transcripts is different from tRNA-snoRNAs. It remains to be determined whether one of, or both polymerases are involved in transcribing tRNA-mRNA dicistronic transcripts.
The expression patterns of all genomic features studied (i.e. tRNAs, PCGs, and intergenic regions (considered a proxy for dicistronic tRNA-mRNA transcripts) were found to be organ specific and sensitive to regional environmental differences. The effect of organ and environment on PCG and tRNA gene expression has been extensively studied before in grapevine (Bester et al. 2017; Dal Santo et al. 2013; Liu et al. 2012; Pontin et al. 2010; Sun et al. 2015a). Special effort has been put into deciphering the effect that the growing environment has on fruit quality traits associated with wine regionality (Jackson and Lombard 1993; van Leeuwen 2009; Zsófi et al. 2011). However, the effect that the environment and tissue have on tRNA expression and on dicistronic transcript expression has not been previously described. Our results show that the expression patterns of dicistronic transcript-forming tRNA genes mimic those of all expressed tRNA (Supplemental Fig S5). We also found that the expression of dicistronic tRNA-mRNAs, measured as the expression of the intergenic region, showed a higher correlation with that of dicistronic tRNA than with that of dicistronic PCGs in both tissues. Although this correlation was only statistically significant in leaves, the lack of statistical significance in berry samples could be due to the low number of dicistronic transcripts identified in berries compared to leaves (9 vs 16 respectively). Taken collectively, our results suggest that environmentally induced dicistronic tRNA-mRNA expression is, at least partially, directed by the mechanisms regulating tRNA expression.
Prior to this work, dicistronic transcripts had been found in a handful of plant species grown under laboratory conditions. Comparative analysis of dicistronic transcripts in grapevine and A. thaliana indicate that the genomic clustering of the tRNA and protein coding gene is evolutionarily conserved between both species. A better understanding of their prevalence across the plant kingdom is needed to begin to understand the biological roles that these types of transcripts may play in plants. We provide here the first evidence for discistronic transcription in a commercially important crop species grown in field conditions, and highlight that differential tRNA expression could be relevant for differential dicistronic transcript formation. Our approach can be utilized to survey distribution patterns of dicistronic transcripts in different plant species and tissues which will help elucidate the molecular function of these transcripts in plant signalling.
Material and methods
Sampling material
Tissues were sampled from own-rooted grapevines (Vitis vinifera) cv. Shiraz from 22 commercial vineyards located in the Barossa wine zone (South Australia, Australia). Vineyards were selected as part of a larger study of Barossa Terroir (Xie et al. 2017). Vineyards were chosen to be representative of the climate, soil and management practices that are used in the different Barossa sub-regions. These sub-regions are the Eden Valley (EV) (3 vineyards), Northern Grounds (NG) (4 vineyards), Central Grounds (CG) (4 vineyards), Southern Grounds (SG) (3 vineyards), Eastern Edge (EE) (4 vineyards) and Western Ridge (WR) (4 vineyards).
Leaf and a berry bunches were collected from nine plants in each of three rows in each vineyard (total of 198 plants) during the 2016 growing season. The first fully expanded leaf at budburst (E-L 7) (Coombe 1995) was collected from three nodes per plant and pooled into a single sample per plant. Berries were collected at veraison (E-L 35) (Coombe 1995) from three different bunches per plant (i.e. three berries per bunch). All samples were taken before dawn (between 10:00 pm and sunrise) to minimise variability associated with differences in plant water status (Williams and Araujo 2002). Samples were snap-frozen in liquid nitrogen in the vineyards and stored at −80°C.
RNA extraction and RNA-seq library preparation
Total RNA was extracted from each sample using the Spectrum Plant Total RNA kit (Sigma-Aldrich) following the manufacturer’s instructions and including DNAse treatment. Three samples per vineyard were generated by pooling 2 μg of total RNA from three plants from the same row in the vineyard for a total of 66 pools. Ribosome was depleted in 6 μg of RNA from each pool using the Dynabeads mRNA purification kit (Ambion, Invitrogen) following the manufacturer’s instructions. Ribosomal depleted RNA (25 ng per pool) was used as input for library preparation using the NEBNext Ultra RNA Library Prep Kit for Illimina (New England Biolabs Inc). Libraries were sequenced using Illumina NextSeq High Output 75 bp pair-end (Illumina Inc., San Diego, CA, United States) at the Australian Genome Research Facility (Adelaide, SA, Australia). Reads were trimmed and filtered using AdapterRemoval v2.2.1 (Schubert et al. 2016) using default settings. Alignment of trimmed reads to the Vitis vinifera genome reference IGGP_12X obtained from EnsemblPlants 36 was performed using Hisat2 v2.1.0 (Kim et al. 2015). BAM files from samples from the same vineyard were merged, sorted and indexed using SAMtools v1.8 (Li et al. 2009). Mapped reads were counted to genomic features using featureCounts v1.5.2 (Liao et al. 2014), with the minimum mapping quality score for a read to be assigned to a feature was set to 10 (Liao et al. 2013). The merged, sorted and indexed BAM files were then directly input into the R environment in order to identify the dicistronic tRNA-mRNA transcripts.
In silico detection of dicistronic tRNA-mRNA transcripts
DiRT (Dicistronic RNA Transcripts) is a custom pipeline implemented in the R environment and source codes are available at GitHub (https://github.com/CharlotteSai/DiRT). While the pipeline was developed for analysing grapevine RNA-seq data, it can be adapted for use in other species provided a genomic tRNA annotation is available. Firstly, protein coding gene (PCG) information and coordinates were downloaded from Ensembl Plants (release 45) (http://plants.ensembl.org/Vitis_vinifera/Info/Index) and the chromosomal coordinates of tRNA genes were extracted from the Genomic tRNA database using tRNAscan-SE based on predicted structure analysis (http://gtrnadb.ucsc.edu/GtRNAdb2/genomes/eukaryota/Vvini/). We used BEDTools version 2.25 (Quinlan and Hall 2010) to determine the relative location of PCGs in relation to all tRNA genes. Predicted tRNAs overlapping with PCGs were discarded for further analysis. tRNAs expressed (i.e. above 1 raw read) in leaf and berry samples were identified using GenomicRanges (Lawrence et al. 2013). To infer putative co-transcription, first we filtered the RNA-seq data for genomic regions where both tRNA loci and closest neighbouring gene were transcribed (Raw read >= 1 for tRNAs and raw read >= 10 in PCGs), independently of their DNA-strand. In order to identify region-specific putative dicistronic transcripts, each Barossa sub-region was interrogated separately.
The selected candidate tRNA-mRNA transcripts were then scanned for dicistronic transcripts. We demanded that, first; the sequencing coverage of the intergenic region must be significantly higher than the intron closest to the intergenic region and the second intron closest to intergenic region. To achieve this, reads for each base of the intergenic region, the closest intron and the second closest intron were counted by the coverage method from the GenomicRanges package (Lawrence et al. 2013) using merged BAM files for each region to obtain total coverage for each region. Then significant differences in average coverage between the intergenic region and the two closest introns were determined by a t-test including all regions as biological replicates. The complete set of p-values were adjusted using the Benjamini-Hochberg false discovery rate (FDR) (Benjamini and Hochberg 1995) and intergenic regions with higher mean coverage than both introns, and an FDR-adjusted p-value < 0.05 were included for subsequent steps of the pipeline.
tRNA-mRNA transcripts passing the first condition were further filtered for those with uninterrupted sequencing coverage spanning the tRNA, the intergenic region and the mRNA by selecting candidates with at least one count for every base in the intergenic region. This condition was implemented to make sure that at least one entire molecule of the dicistronic transcript had been potentially produced.
Finally, dicistronic candidates with continuous coverage in the intergenic region were manually inspected using IGV (Robinson et al. 2011) for visual validation of continuous coverage. The candidates passing both of the t-tests and continuously coverage examination were deemed putative tRNA-mRNA dicistronic transcripts. Multidimensional scaling (MDS) were analysed in the R environment using the function plotMDS from the limma package (Ritchie et al. 2015).
RT-PCR confirmation
Complementary DNA was synthesized from the same total RNA used for the RNA-seq using SuperScript IV first strand synthesis system (Invitrogen, 18091050) following the manufacturer’s instructions. Complementary DNA was synthesised using gene specific reverse primers that aligned to the second exon for each candidate gene (15s0046g02860-Reverse and 18s0001g09050-Reverse) (+RT) and the reverse primer of the gene Elongation Factor 1-alpha (EF1a) as a positive control. Negative controls for the cDNA synthesis (-RT) in which reverse transcriptase enzyme was omitted were included for each of the dicistronic candidate. Resulting cDNA was diluted 1:10 and 2 μl was used for RT-PCR. The RT-PCR reaction was conducted using Kappa Taq PCR Kit (Kappa Biosystem, KK1020) following manufacture instructions. The amplification program used was 95°C for 3 min, 37 cycles at 95°C for 30 sec followed by 60°C for 30 sec and 72°C for 50 sec and finally 72°C per 2 min. For the candidate tRNAValCACL1.7-VIT_15s0046g02860 we used primers tRNA-Val-forward and Intergenic-tRNAVal-reverse (376 bp). For candidate tRNAProTGG2.9-VIT_18s0001g09050 primers tRNA-Pro-forward and Intergenic-tRNAPro-reverse (172 bp) were used. Negative control for the PCR reaction (-Ctr) contained all components for the reaction except the cDNA template. RT-PCR products were analysed by agarose gel electrophoresis and SYBR Safe DNA gel staining (ThermoFisher Scientific, S33102). RT-PCR products were purified using PCR Clean-up (Macherey-Nagel, 740609.250) following the manufacturer’s instructions. Sanger sequencing was performed at the Australian Genome Research Facility. Oligonucleotides used for RT-PCR are listed in Supplemental Table S6. Matching of the sequencing results for both putative dicistronic pairs and the expected sequence of each locus was confirmed using BLAST (blastn) with default settings (Zhang et al. 2000).
Regional effect on the expression of dicistronic tRNA:mRNAs
To determine the effect of the region of origin on dicistronic tRNA:mRNAs, we independently compared the expression levels of all three components of the identified dicistronic transcripts (i.e. tRNAs, intergenic regions and PCGs). Similarly, the regional expression levels of all expressed tRNAs were compared. Briefly, mapped reads for each selected genomic feature obtained from featureCounts, were analysed in the R environment for plotting the gene expression through heatmaps. The expression of all tRNA, dicistronic tRNAs, intergenic region and the dicistronic genes (logCPM) were plotted using the pheatmap (Kolde 2015). Local Fisher LFDA was performed in the R environment using the package lfda (Sugiyama 2006) to the expression (logCPM) values of all tRNA, dicistronic tRNAs, intergenic region and the dicistronic genes. In order to determine whether primary mRNA or the tRNA is driving the expression of candidate dicistronic tRNA-mRNA transcripts, we carried out Pearson correlation analyses between the expression of tRNA vs intergenic region and PCGs vs intergenic region for each dicistronic candidate identified. Pearson correlation analysis (p-value < 0.05) was performed using the R function cor.test(). Read counts of the intergenic regions were used as a proxy to define the expression of dicistronic transcripts. The rationale behind this lies on the assumption that reads mapping to the intergenic region can only be the result of the sequencing of a dicistronic RNA molecule, while reads mapping to tRNA genes and PCGs could result both from the expression of monocistronic and dicistronic transcripts (i.e. tRNA genes and PCGs pairs forming two independent RNA molecules or a single RNA molecules respectively) (Figure 6).
Gene analyses
A bar plot was made to represent the distance (bp) between the tRNA and its proximal gene. Pairs of expressed tRNA-mRNA were split in two groups depending if they formed dicistronic or monocistronic transcripts. A non-overlapping sliding window approach (200bp) was used to count the number of pairs of genes of each type. Expression of the dicistronic genes and dicistronic tRNA was assessed by plotting their expression values against the distribution of the total gene expression for each tissue from the RNA-seq data. Gene annotation for dicistronic genes was obtained from EnsemblPlants release 45 (http://plants.ensembl.org/Vitis_vinifera/Info/Index), BLASTP search from NCBI (https://blast.ncbi.nlm.nih.gov/Blast.cgi), from the grapevine V1 annotation of PN40024 (Jaillon et al. 2007) and from the Additional file 1 of Cramer et al. (2020). Protein information and gene ontology terms were obtained from UniProt (https://www.uniprot.org/uniprot). GO enrichment analysis was performed from Gene Ontology Consortium (http://geneontology.org/) with default settings.
Motif analysis
Upstream and downstream sequence from the dicistronic tRNA was obtained from Genomic tRNA data and analysed in Weblogo (Crooks et al. 2004) for sequence analysis using default settings.
Availability of data and materials
The full sequencing data are available on SRA database under the accession number PRJNA591273.
Acknowledgments
This study was funded through a Pilot Program in Genomic Applications in Agriculture and Environment Sectors jointly supported by the University of Adelaide and the Australian Genome Research Facility Ltd. PJF was supported by Graduate Research Scholarships from Wine Australia (PH1503) and the University of Adelaide. NS was supported by a summer scholarship from the ARC Centre of Excellence in Plant Energy Biology (CE1400008). Dr Lopez is currently partially supported by the National Institute of Food and Agriculture, U.S. Department of Agriculture, Hatch Program number 2352987000. We thank the Barossa Grounds Project and the growers who allowed us to collect samples and supplied information about their vineyards. We thank Kendall Corbin for performing the DNA extraction of the leaf samples. We thank Cassandra Collins for the experimental design and collection of the plant material. We thank Roberta DeBei, Sandra Milena Mantilla, Annette James, and Valentin Olek who helped with the sample collection. We thank Stephen Tyerman for his contribution in the development of DiRT. We thank Timothy Cavagnaro and Andrew Metcalfe for their contribution in the experimental design.
Footnotes
↵a Joint senior authorship
References


