

Abstract
Pathogenic germline mutations in PIGV lead to glycosylphosphatidylinositol biosynthesis deficiency. Individuals with pathogenic biallelic mutations in genes of the glycosylphosphatidylinositol anchor pathway show cognitive impairments, a motor delay and in many cases epilepsy. Thus far, the pathophysiology underlying the disease remains unclear and suitable rodent models that mirror human pathophysiology have not been available. We therefore generated a mouse model using CRISPR-Cas9 to introduce the most prevalent hypomorphic missense mutation in European patients, at a site that is also conserved in mice, Pigv:c.1022C>A (p.A341E). Reflecting the human pathology mutant Pigv341E mice showed deficits in motor coordination and cognitive impairment with poorer long-term spatial memory than wild-type mice, as well as alterations in sociability and sleep patterns. Furthermore, immunohistochemistry showed decreased synaptophysin-immunoreactivity and electrophysiology recordings demonstrated reduced hippocampal synaptic transmission in Pigv341E mice that may underlie impaired memory formation. To gain a deeper and broader molecular understanding of the consequences of glycosylphosphatidylinositol anchor deficiency, we performed single-cell RNA sequencing on acutely isolated hippocampal cells of Pigv341E and wild-type mice. We found that hippocampal cells from adult Pigv341E mice exhibited changes in gene expression, most prominently in a subtype of microglia and subicular neurons. A significant reduction of Abl1 transcripts in several cell clusters suggests a link to the signaling pathway of glycosylphosphatidylinositol-anchored ephrins. We also observed increased levels of Hdc that might affect histamine metabolism with consequences in circadian rhythm. In summary, we present here the first mouse model with a patient-specific hypomorphic mutation that mirrors the human phenotype and shows a hippocampal synaptic defect. This new mouse model will not only open the doors for further investigation into the pathophysiology of glycosylphosphatidylinositol biosynthesis deficiency in future studies, but will also deepen our understanding in the role of glycosylphosphatidylinositol-anchor related pathways in brain development.
Introduction
The glycosylphosphatidylinositol (GPI) anchor is essential for anchoring a remarkable number of proteins (GPI-linked proteins) to the cell membrane. GPI-linked proteins are essential for signal transduction, cell-cell adhesion, axonal outgrowth, synapse formation and plasticity, as well as for the regulation of the complement system (Paulick and Bertozzi, 2008; Um and Ko, 2017). Paroxysmal nocturnal hemoglobinuria (PNH) was the first disorder to be characterized as a GPI anchor biosynthesis deficiency (GPIBD) (Takeda et al., 1993). However, PNH is an exception in two regards. First, it is the only GPIBD that is acquired and it is due to somatic mutations that cause a complete loss of function. In inherited GPIBDs there is a residual function of GPI anchor synthesis and maturation. Second, the prevalence of inherited GPIBDs is at least ten-fold higher than of PNH. To date, the recessive phenotypes for 21 genes of the GPI anchor pathway have been reported and Bellai-Dussault discussed the clinical variability in detail for the first 19 GPIBDs (Bellai-Dussault et al., 2019). However, most patients, including the recently described cases that are due to GPIBD20 and GPIDB21, exhibit intellectual disability, psychomotor delay and epilepsy (Knaus et al., 2019; Murakami et al., 2019). Furthermore, due to residual function of GPI anchor synthesis, patient-derived fibroblasts display a reduced number of GPI-linked proteins on the cell surface (Knaus et al., 2016).
Mouse models prior to the discovery of congenital GPIBDs, focused on chimeric knock outs acknowledging that a complete loss of GPI anchors is embryonic lethal (Kawagoe et al., 1996; Tarutani et al., 1997). In recent years, mice with constitutional GPIBDs could be identified in mutation screens that are probably viable because the mutations are only hypomorphic or affect isoforms that are limited to certain tissues and thus only explain partial aspects of most inherited GPIBDs (McKean and Niswander, 2012; Lukacs et al., 2019). Lukasz et al. showed that Pgap2 has a tissue-specific expression pattern at different embryonic developmental stages, in contrast to other GPI anchor genes. The authors suggested that the compromised transcript of Pgap2 observed in neural crest cells may lead to the craniofacial phenotype in mutants. Furthermore, McKean et al. observed a holoprosencephaly-like phenotype in two mouse models with a frame-shift mutation in Pign and an in-frame deletion in Pgap1. The craniofacial features in humans are usually more subtle most likely due to the milder mutational spectrum and the similarities in facial gestalt have been discussed for some GPIBDs (Knaus et al., 2018). However, none of the existing mouse models are suitable to study the cognitive and physical deficits, which represent the main clinical challenge in patients with GPIBDs. For this purpose, we engineered a mouse model using CRISPR-Cas9 with the missense mutation c.1022C>A, p.A341E in Pigv, which is also one of the most frequently encountered pathogenic alleles in humans (Krawitz et al. 2010). PIGV encodes the mannosyl transferase II that is essential for the attachment of the second mannose to the GPI anchor (Ji et al., 2005). Due to the residual function of Pigv341E, mutant mice are viable with a normal life span that made it possible to complete behavioral experiments testing motor, social and cognitive abilities.
Material and Methods
Animals
Pigv341E mice were generated by diploid or tetraploid aggregation (Supplementary Fig. 1A) and maintained by crossing them with C57Bl.6/J mice (Eakin and Hadjantonakis, 2006). Mice were genotyped by PCR using the primers mPigvEx4_fw and mPigvEx4_rv. PCR amplicons were subsequently digested by BcuI restriction enzyme (Thermo Fisher Scientific). For restriction analysis agarose gel electrophoresis was performed and genotypes were determined (Supplementary Fig.1D). All animals were handled according to government regulations as approved by local authorities (LaGeSo Berlin) under the license (G0365/17, G0346/13, G0176/19, G0247/13, G0243/18). Moreover, experiments were carried out following the 3R guidelines for animal welfare. Mice were housed in groups with mixed genotypes in single ventilated cages with an enriched environment. Furthermore, mice were housed in a pathogen free animal facility with a 12 h dark/light cycle. Mice had food and water ad libitum unless otherwise indicated. Mice used for experiments were 8 weeks to 6 months old unless otherwise indicated. Pigv341E and wild-type mice had the same age for each experiment. In addition, littermates were assigned equally to both experimental groups according to their genotype and sex in order to avoid bias effects. The experimenter was blinded except during behavioral testing, since Pigv341E mice were physically smaller. Moreover, experiments were randomized.
Flow cytometry of mouse embryonic fibroblasts
Isolation of mouse embryonic fibroblasts (MEFs) from E13.5 embryos (Wt (n=4), het-Pigv341E (n=4), hom-Pigv (n=5)) is described elsewhere (McKean and Niswander, 2012). MEFs were maintained in Dulbecco’s modified eagle’s medium (DMEM) supplemented with 10% fetal calf serum (FCS), 1% ultra-glutamine and 1% penicillin/streptomycin. For flow cytometry, cells were detached with cold ethylenediaminetetraacetic acid (EDTA) diluted in 1x phosphate buffered saline (PBS) and a cell scraper. Afterwards, cell suspension was pipetted several times to get a single cell suspension. Cells were stained with fluor-proaerolysin (FLAER) [Af-488] in 1x PBS supplemented with 2% FCS for 30 min. Cells were then centrifuged at 400g for 5 min and washed in 1x PBS supplemented with 2% FCS two times. FLAER-stained cells were analyzed using the MACSQuant® VYB flow cytometer and the FlowJo™ v. 9.8.2 software.
Behavioral testing
Mice were habituated to the room adjacent to the testing room 30 min before starting behavioral experiments. The equipment was cleaned with 70% ethanol before the experiments. In between animals and trials, the equipment was cleaned with 5% ethanol. Behavioral experiments were conducted during the light phase (approx. 4 hours after the dark cycle ended). For the motor tests (rope grip, grip strength, beam walking, rotarod, foot print) nest construction test, home cage scan (HCS, CleverSys) recording and the social activity monitoring (first approach) (SAM, PhenoSys) one cohort, Wt (female n=8, male n=4) Pigv341E (female n= 4, male n=2), was phenotyped at two consecutive time points (8 weeks and 16 weeks unless otherwise indicated). For cognitive tests (Barnes maze, y-maze), affective tests (open field, dark-light-box, elevated plus maze), social tests (three-chamber, social proximity), the marble burying tests and the buried food test two cohorts of the same age were used (first cohort: Wt (female n=4, male n=5) Pigv341E (female n=2, male n=2), second cohort: Wt (female n=5 male n=6) Pigv341E (female n= 2, male n=5)). For the SAM (second approach) only the second cohort was used. The behavioral experiments were conducted in the same order in both cohorts. For the hindlimb clasping test a separate cohort was used (Wt (female n=3, male n=5), het-Pigv341E (female n=4, male n=4), hom-Pigv341E (female n=4, male= n=6). For a detailed description of the behavioral tests see the supplementary material and methods part.
Synaptophysin-staining
Paraffin-embedded sections were rehydrated as already described (see supplementary material and methods) and washed twice in 1x PBS for 3 min. Afterwards, antigen retrieval of sections was performed in 10 mM citrate buffer for 5 min at 60 °C and washed twice in 1x PBS for 3 min. Sections were permeabilized and blocked in 0.2% Triton-X and 3% bovine serum albumin (BSA) for 30 min at room temperature. Sections were then washed twice for 3 min in 1x PBS and stained with Anti-synaptophysin antibody (1:800, Abcam, ab32127) that was diluted in 1x PBS supplemented with 3% BSA at 4°C overnight. Afterwards, sections were washed in 1x PBS and secondary antibody (anti-rabbit-488Af, 1:1000) was applied in 1x PBS supplemented with 3% BSA for 1h. Sections were washed with 1x PBS for 3 min and stained with 4’,6-Diamidin-2-phenylindol (DAPI) (1:1000) for 10 min. Finally, sections were washed three times for 3 min and embedded in fluoromount.
For each biological replicate (Wt(female n=3, male n=2) Pigv341E(female n=2, male n=4), age: P23-25) three sections were analyzed. Furthermore, three images were taken for each section per area (Cornu Ammonis 1 - Stratum Radiatum (CA1-SR), Cornu Ammonis 3 - Stratum Radiatum (CA3-SR), Cornu Ammonis 1 - molecular layer of dentate gyrus (CA1-ML)) at 63x magnification with the ZEISS LSM 700 confocal microscope. 6 Z-stacks were recorded and transformed to one image with the ZEISS Zen Blue Software. Images were then analyzed with FIJI imageJ for quantification of synaptophysin-immunoreactivity/μm2=Pixel(green)/μm2.
Schaffer-Collateral recordings
Acute hippocampal brain slices were prepared as described elsewhere (Stempel et al., 2016) (see supplementary material and methods). Recordings were performed in a submerged recording chamber (Warner instruments RC-27L), filled with artificial cerebrospinal fluid (ACSF) with solution exchange speed set to 2.5 ml/min at room temperature (22-24°C). Low resistance stimulation electrodes were placed in the Stratium Radiatum near CA3 (CA3-SR) to stimulate Schaffer Collaterals and the recording electrode was placed in the Stratium Radiatum of the CA1 (CA1-SR) field. Basal stimulation was applied every 10 sec. In order to analyze the input-output relationship, stimulation intensities were adjusted to different fiber volley (FV) amplitudes (0.05 mV increments) and were correlated with the corresponding field excitatory postsynaptic potential (fEPSP) amplitudes. Paired pulse ratios (PPR) were determined by dividing the amplitude of the second fEPSP (50 ms inter-stimulus interval) with the amplitude of the first (average of ten repetitions). Four high frequency trains (100 pulses, 100 Hz) were applied every 10 sec and the amplitude of the following fEPSP was normalized to the baseline (post-tetanic potentiation, PTP). For each animal, several measurements were conducted. The mean was calculated including all measurements of all animals. (Wt(female n=2, male n=2) Pigv341E(female n=2, male n=2).
Single-cell RNA sequencing, preprocessing and analysis
From the prepared single-cell suspensions (see supplementary material and methods), sequencing libraries were generated using the Chromium Single-cell Gene Expression Solution v3 (10X Genomics, Inc.) according to manufacturer’s protocol and sequenced with the Illumina NovaSeq 6000. Both the pooled Pigv341E and wild-type sample were sequenced on the same lane. Demultiplexed sequencing data was provided by the core facility. Quality assurance of raw sequencing reads was performed with FastQC. For alignment to reference genome GRCm38.96 and quantification of single-cell gene expression, the zUMI pipeline with internal usage of the STAR aligner was employed. Both exonic and intronic reads were considered for downstream analysis.
Further processing and analysis of the generated gene expression count table was conducted in R, mainly using the single-cell genomics toolkit Seurat. Based on the distribution of cells, a total of 19 out of 15,949 cells with ≤ 100 genes, ≤ 100 UMIs or ≥ 30% of UMIs mapping to mitochondrial genes was removed by filtering (Supplementary Fig. 11). Gene expression values of the remaining 8,836 Pigv341E mutant cells and 7,094 wild-type cells were normalized using the sctransform procedure developed by Hafemeister and Satija (2019), including the percentage of unique molecular identifiers (UMIs) mapping to mitochondrial genes as regression variable (Hafemeister and Satija, 2019). After principal component analysis (PCA), the first 11 principal components were selected for dimensionality reduction based on the amount of captured variance (Supplementary Fig. 12). They were used as input to clustering of cells as well as to UMAP for two-dimensional visualization. We assigned cellular identities by analyzing the differentially expressed genes between the clusters. Candidate genes were compared with the adult mouse brain atlas (http://dropviz.org/) and insitu hybridization data from the Allen brain atlas (https://mouse.brain-map.org/search/index) (Saunders et al., 2018) (Supplementary Fig. 14). Distribution of cells across defined cellular subgroups was compared between genotypes via Pearson’s Chi-squared test. For differential expression testing between groups of cells, the default settings in Seurat were applied. Genes with an absolute average log2 fold change of at least 0.25 and a Bonferroni-adjusted p-value below 0.01 were considered significantly differentially expressed. Genes with significant differential expression between groups of interest were examined for overrepresentation of Gene Ontology (GO) terms compared to the background of all genes expressed in our data set using the clusterProfiler package; terms with an FDR-adjusted p-value below 0.05 were considered significantly enriched.
Statistical analysis
For all experiments at least three animals per genotype were used. One animal was defined as one biological replicate and represented one data point except for electrophysiology recordings (see section: Schaffer-Collateral recordings). The mean was calculated for each genotype group unless otherwise indicated. Data was statistically analyzed with GraphPad Prism (Version 7) or R (R Core Team (2019)) and results are demonstrated with a mean ± standard deviation. Statistical tests were performed for each experiment as indicated in table 1. Results with a p-value<0.05 were considered significant unless otherwise indicated.
Data availability
The single-cell RNA sequence data are freely available from the Gene Expression Omnibus (GEO) repository under accession number GSE147722. Other data is available from the corresponding author on a reasonable request.
Results
General characteristic features and alterations in sleep patterns in Pigv341E mice
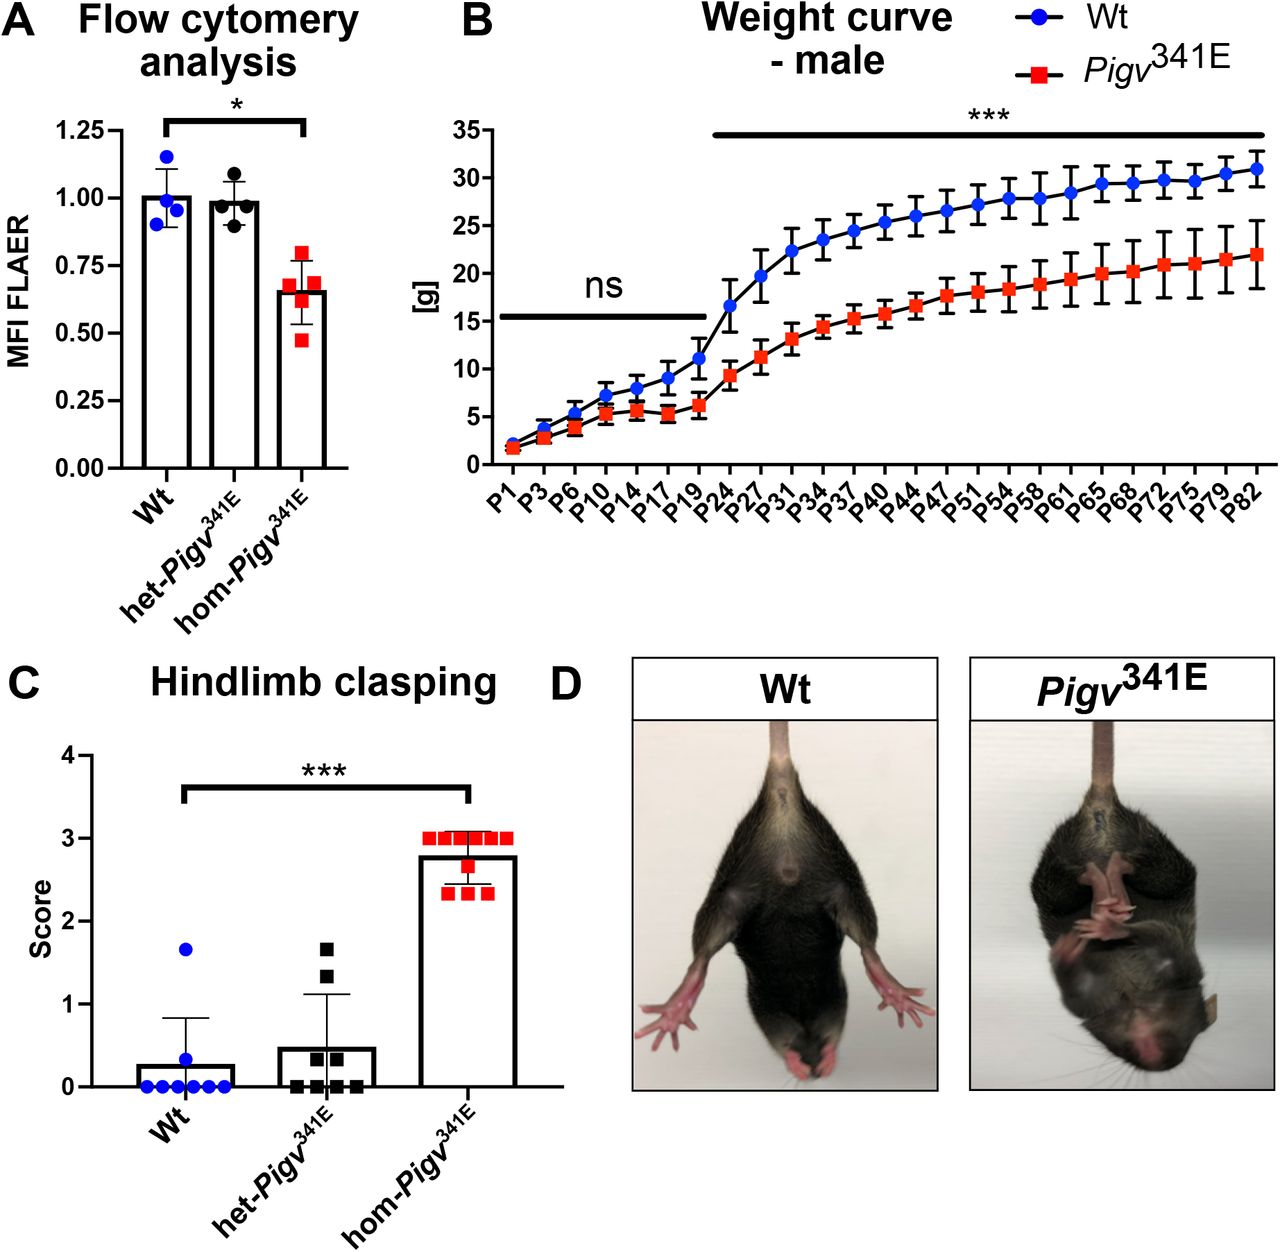
In order to validate the GPI anchor defect in Pigv341E mice, we first analyzed GPI anchor proteins on the cell surface of MEFs by flow cytometry. Hom-Pigv341E MEFs showed a reduced number of GPI-linked proteins displayed by a decreased mean fluorescent intensity of FLAER (Fig. 1A). FLAER is able to recognize GPI anchor proteins through their GPI motif and is used to diagnose PNH (Brodsky et al., 2000). Furthermore, we observed a reduced weight (Fig. 1B, Supplementary Fig. 1F) and hindlimb clasping behavior in Pigv341E mice (Fig.1C, D).

(A) Flow cytometry analysis of hom-Pigv341E mouse embryonic fibroblasts (MEFs) isolated from embryos (E13,5) revealed a reduced mean fluorescence intensity (MFI) in fluor-proaerolysin (FLAER). MFI was normalized to wildtype (B) Male Pigv341E mice showed a reduced weight from postnatal day (P) 1-82. (C) hom-Pigv341E mice displayed a hindlimb clasping behavior. (D) Representative posture of hindlimb clasping behavior in hom-Pigv341E mice. In contrast, wild-type mice spread their hindlimbs when picked up by their tail.
Hom-Pigv341E=homozygous for Pigv p.Ala341Glu, het-Pigv341E=heterozygous for Pigv p.Ala341Glu, wt=wild-type. Animals used for the weight curve: Wt(male=3), hom(male=4). Animals used for the hindlimb clasping test were 6 weeks old: Wt(female n=3, male n=5), het-Pigv341E(female n=4, male n=4), hom-Pigv341E(female n=4, male= n=6).The data from the weight curve was analyzed by two-way of variance (ANOVA) followed by Bonferroni’s multiple comparisons test. The data from the flow cytometry and hindlimb clasping test was analyzed with a non-parametric t-test (Mann-Whitney). *P<0.05, **P<0.01, ***P<0.001.
Human patients show a heterogeneous spectrum of symptoms, however, motor and intellectual disabilities are consistent features in GPIBDs (Horn et al., 2011, 2014; Knaus et al., 2016, 2018). Because of the large array of disabilities displayed by human patients, we tested a broad spectrum of motor, cognitive, social and affective functions in Pigv341E mice. Since patients are also impaired in their everyday life and in subtle ways not yet properly defined, we prospectively investigated which spontaneous home cage behaviors our mouse model would show in while living undisturbed in their home cage (singly or group housed). We monitored Pigv341E mice for 23h in the HCS at two different time points (time point 1=8 weeks, time point 2= 16 weeks). Among the 19 behaviors accurately detected by the post-analysis of the HCS data, three behaviors appeared consistently altered in Pigv341E mice and at both time points. Pigv341E mice hung less often to the top of the cage (total occurrences) and for shorter durations (total duration and duration per hour) than wild-type, groomed more often (total occurrences) and for longer durations (total duration and duration per hour) and slept less (total duration and duration per hour) (Fig. 2A, B; Supplementary Fig. 2A). Only at a younger age (time point 1), Pigv341E mice spent more time walking (duration per hour) during the dark phase of the day than wild-type mice (Fig. 2B, top graph). Furthermore, hanging behavior appeared as an important variable to differentiate genotypes along the dimensions of a PCA and at both time points (Supplementary Fig. 3, Supplementary Fig. 4A-F).

(A) Duration of selected behaviors from the home cage scan (HCS). Pigv341E mice revealed increased grooming, decreased hanging and sleeping behavior at both time points. (B) Duration of selected behaviors per hour from the HCS. The dark phase took place between the two dashed vertical lines. Pigv341E mice showed increased grooming, hanging and decreased sleeping at both time points. Pigv341E mice showed increased walking at time point 1. (C) The social activity monitor (SAM) revealed an increased distance traveled in total in Pigv341E mice when separated by their genotype (nonmixed). When housed in mixed genotypes (mixed) there was no significant difference in total distance traveled between genotypes. (D) Pigv341E mice displayed an increased distance traveled per phase when separated by their genotype (non-mixed). When housed in mixed genotype (mixed) there was no significant difference in distance traveled per phase between genotypes. (E,F) Pigv341E mice traveled longer distances per day and per hour when separated by their genotype (non-mixed).
Pigv341E=homozygous for Pigv p.Ala341Glu, wt=wild-type. Animals used for the HCS (wt: female n=8, male n=4; Pigv341E: female n= 4, male n=2) were phenotyped at two different consecutive time points, tp1 at the age of 8 weeks, tp2 at the age of 16 weeks. Animals used for the SAM: wt(female n=4, male n=6) Pigv341E(female n= 2, male n=5). The data from the HCS (total duration) and SAM (total distance, mean distance traveled per phase and per day) was analyzed with Wilcoxon rank sum test (non parametric). The data from the HCS (duration per hour) and SAM (distance traveled per hour) was analyzed with a generalized linear mixed-effects models (glmm) using a Markov chain Monte Carlo (MCMC). *P<0.05, **P<0.01, ***P<0.001.
Spontaneous home cage activity while living in a group setting was also assessed in Pigv341E mice using the SAM. For this test, we implanted a RFID transponder into the mice and put the home cage with mixed genotypes on a grid box that could locate the individual animals and their position in the cage at all times (continuous 24h/d recording). Because the animals are undisturbed in their home cage for this assessment, the SAM analysis can be done several times without the animals noticing. For the first two time points, SAM analysis revealed no difference in total distance traveled over 14 days between genotypes (Supplementary Fig. 4G), but an unexpected switch in diurnal/nocturnal activity for both genotypes was observed. The mice were more active during the light (normal sleeping time) than during the dark phases of their days (Supplementary Fig. 5A, C, confirmed by Markov chain Monte Carlo generalized linear mixed-effects models (MCMCglmm), p=0.001). This observation added to the fact that Pigv341E mice slept for shorter durations than wild-type in HCS and that some patients affected with other GPI anchor deficiencies suffer from disturbed sleep (Knaus et al., 2016; Sakaguchi et al., 2018). Therefore, we thought that Pigv341E mice are more active during the light phase and disturb control mice during resting phases. In order to answer this question, we performed a second experiment in which we evaluated the spontaneous activity of the Pigv341E and wild-type mice separately (nonmixed vs. mixed genotype cages). When Pigv341E and wild-type mice lived together in the same cage (i.e. mixed genotype), we reproduced our previous results. Mice of different genotype showed no difference in total distance traveled over days (Fig. 2C, left graph), per phase (Fig. 2D, left graph), per day (Supplementary Fig. 2C) and per hour (Supplementary Fig. 2D) but they still showed higher activity levels (larger variability) during the light vs. dark phase (Supplementary Fig. 2D, confirmed by Markov chain Monte Carlo generalized linear mixed-effects models (MCMCglmm), p=0.001). However, in non-mixed housing conditions, Pigv341E mice walked more distance over 4 days (Fig. 2C, right graph), per phase (Fig. 2D, right graph) and per day and hour (Fig. 2E, F) than wild-type and again, Pigv341E mice were found to be more active during the light than during the dark cycle at day 1 and 2 (Fig. 2E).
Pigv341E mice show motor dysfunction and alterations in sociability and social recognition
Patients with GPIBD are known to suffer from psychomotor delay, muscular hypotonia and/or sometimes from ataxia (Horn et al., 2011, 2014; Knaus et al., 2016, 2018). Interestingly, extensive testing of different motor functions in Pigv341E mice revealed a clear and elaborated dysfunctional motor phenotype. Pigv341E mice had a reduced balancing ability and motor coordination displayed by a decreased latency to fall off the rotarod (Fig. 3A). This was confirmed by an increased latency to traverse an elevated beam (Fig. 3B). Grip strength and climbing ability were assessed using the grip strength and rope grip test. In the rope grip test, Pigv341E mice showed an increased latency to climb on the rope and had a lower hanging score than wild-type (Fig. 3C, Supplementary Fig. 6A right graph). In the grip strength test, Pigv341E mice revealed a reduced grip strength (Fig. 3D). The altered walking pattern of the Pigv341E mice was evaluated using the footprint test (Fig. 3E). Pigv341E mice displayed an increased distance between forepaw and hindpaw (S) in paw placement of the stride (Fig. 3F). This is remarkable since walking mice usually place their hind paws at the same position as the forepaws (Fig. 3E, see wt).

(A-B) Pigv341E mice revealed a reduced motor coordination displayed by a decreased latency to fall off the rotarod and an increased latency to traverse the beam (15 diameter). (C) Pigv341E mice exhibited a decreased climbing performance showed by a decreased time to climb on the rope. (D) Pigv341E mice showed a reduced grip strength in the grip strength meter. [g] was normalized to the weight of the animal. (E) Representative image of walking pattern between genotypes. SL-FL=stride length-forelimb, SL-HL=stride length-hindlimb, FBW=fore base width, HBW=hind base width, S=distance betweed forepaw and hindpaw. (F) Pigv341E mice have an altered walking pattern displayed by an increased distance between forepaw to hindpaw and decreased fore base width.
Pigv341E=homozygous for Pigv p.Ala341Glu, wt=wild-type. Wt(female n=8, male n=4) Pigv341E(female n= 4, male n=2). Animals were 7 weeks old. The data was analyzed with a non-parametric t-test (Mann-Whitney). *P<0.05, **P<0.01, ***P<0.001.
Along with motor dysfunction, some GPIBD patients also display autistic features (Knaus et al., 2016, 2018). Therefore, we evaluated social behavior in Pigv341E mice in the social proximity and three-chamber test. In the social proximity test, Pigv341E mice showed a decreased number of “rear up” behavior and an increased number of nose-to-anogenital contacts with the stranger mouse (Fig. 4A, B). A decreased number of “rear up” behavior suggested reduced social avoidance in Pigv341E mice. However, no differences in number of nose-tip-to-nose-tip, nose-to-head-contact, “crawl over” and “crawl under” behavior were observed between genotypes (Fig. 4C, D, Supplementary Fig. 7C, left and right graph). In the three-chamber test, Pigv341E mice spent more time with the stranger than with the empty cage (Fig. 4E). Furthermore, the discrimination ratio, stranger over empty cage, was higher in Pigv341E mice than in wild-type (Supplementary Fig. 7A, left graph). However, Pigv341E mice did not distinguish between the familiar (stranger 1) and unfamiliar mice (stranger 2) in contrast to wild-type (Fig.4F). In summary, these results indicated that Pigv341E mice revealed an enhanced social approach behavior displayed by an increased number of nose-to-anogenital contacts with the stranger mouse in the social proximity test and an increased preference for the stranger mouse over an empty cage in the three-chamber test.

(A-D) Pigv341E mice showed an enhanced social approach behavior displayed by a decreased “rear up” behavior and an increased number of nose-to-anogenital contacts when put together with a stranger mouse in the social proximity test. No differences in number nose-tip-to-nose-tip and nose-tip-to head contact were observed between genotypes. (E) The three-chamber test (first 5 minutes) indicated in Pigv341E an enhanced social approach behavior displayed by spending more time with the stranger than with the empty cage compared to wild-type. (F) In contrast to wild-type, Pigv341E mice were not able to distinguish between stranger 1 and 2 since there was no significant difference in spending time with stranger 1 and 2 in the three-chamber test (first 5 minutes).
Pigv341E= homozygous for Pigv p.Ala341Glu, wt=wild-type. Animals used for the social proximity test: Wt(female n=9, male n=11), Pigv341E(female n=4, male n=7). Animals used for the three-chamber test: Wt(female n=9, male n=11), Pigv341E(female n=4, male n=6). Stranger mice had the same age and sex for each testing mouse. The data from the social proximity test was analyzed with a non-parametric t-test (Mann-Whitney). The data from the three-chamber test was analyzed by two-way of variance (ANOVA) followed by Bonferroni’s multiple comparisons test. *P<0.05, **P<0.01, ***P<0.001.
Pigv341E mice show cognitive deficits in spatial long-term memory and species-specific, hippocampus-dependent functions
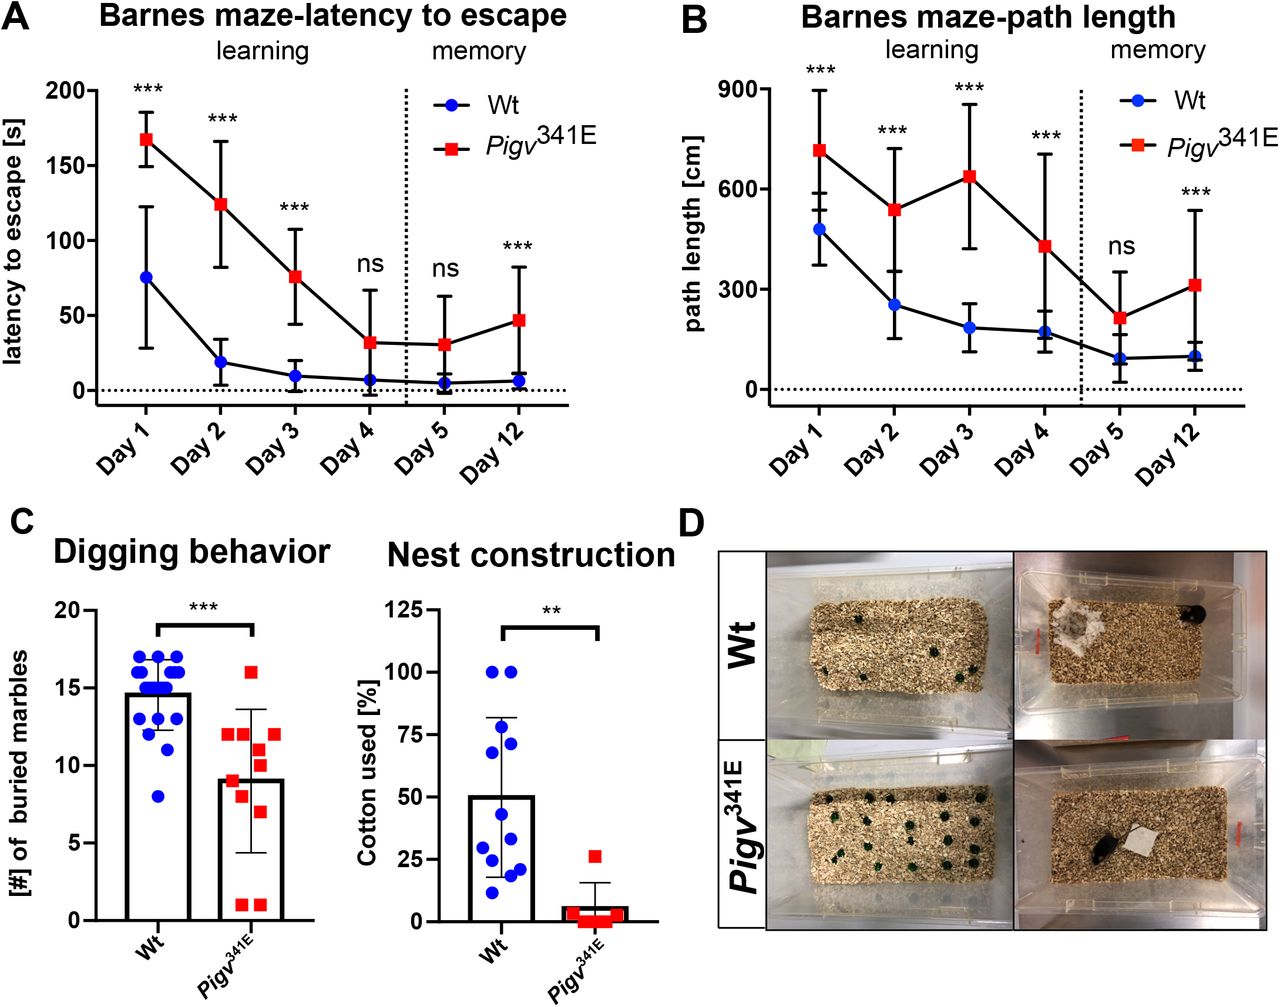
To identify the cognitive and affective profile of the Pigv341E mice, a battery of tests was performed to assess aspects of spatial and non-spatial learning and memory (Barnes maze, Y maze, marble burying, nest building behavior) and their spontaneous response to novel, open and elevated or bright environments (Open Field, Elevated Plus maze and Dark/light box). In the Barnes maze test, Pigv341E mice were delayed in spatial learning as indicated by an increased latency to escape during day 1-3 (Fig. 5A). Despite this delay in spatial learning during day 1-3, Pzgv341E mice proved to have learnt the location of the escape box at day 4 and did show normal short-term memory (day 5) abilities but impaired long-term spatial memory at day 12 (Fig. 5A). However, the increased latency to escape could include a confounder since Pigv341E mice show motor dysfunction. Therefore, we measured the path length as well. Pigv341E mice showed an increased path length for the days 1-4 and 12 but not day 5 (Fig. 5B). Pigv341E mice also spent less time in the target quadrant than wild-type mice at day 12 confirming deficits in long-term spatial memory (Supplementary Fig. 8B, right graph). In the y-maze test, similar spontaneous alternation behavior between genotypes suggested normal short-term spatial working memory in Pigv341E mice (Supplementary Fig. 8A). In the non-spatial although hippocampus-dependent tests of marble burying and nest construction (Jirkof, 2014), Pigv341E mice showed a decrease in number of buried marbles and in the quality of their nests (Fig. 5C,D).

(A-B) Pigv341E mice show cognitive deficits in learning and long term memory displayed by an increased latency to escape and path length during day 1-3 (learning) and day 12 (long term memory in the Barnes Maze. (C) Pigv341E mice revealed a decreased burying and nest construction behavior. (D) Representative image of burrowing behavior (left) and nest construction behavior (right) of wild-type and Pigv341E mice.
Pigv341E=homozygous for Pigv p.Ala341Glu, wt=wild-type. Animals used for the Barnes maze: Wt(female n=8, male n=11) Pigv341E(female n=4, male n=6). Animals used for the marble burying test: Wt(female n=9, male n=11) Pigv341E(female n=4, male n=7). Animals used for the nest construction test were 7 weeks old: Wt(female n=8, male n=4) Pigv341E(female n=4, male n=2). The data from the nest construction and marble burying test was analyzed with a non-parametric t-test (Mann-Whitney). The data from the Barnes maze (latency to escape, path length) was analyzed by two-way of variance (ANOVA) followed by Bonferroni’s multiple comparisons test. *P<0.05 **P<0.01, ***P<0.001.
Furthermore, Pigv341E mice behaved similar to wild-type mice in the dark/light-box and elevated plus maze (Supplementary Fig. 9A, B). In the open field test, Pigv341E mice spent less time in the center and more time in the periphery than wild-type (Supplementary Fig. 9C). Moreover, the path length and number of visits to the center were decreased in Pigv341E mice during the open field test (Supplementary Fig. 9D, E).
Pigv341E mice reveal a synaptic defect in synaptic transmission
Since Pigv341E mice showed a cognitive defect in spatial long-term memory, we hypothesized a hippocampal defect. A decreased burrowing and nest building behavior (hippocampusdependent) in Pigv341E mice supported this notion and we decided to analyze the hippocampus in more detail. For this purpose, we performed a NISSL staining. However, we did not observe any morphological abnormalities in the hippocampus of Pigv341E mice (Supplementary Fig. 10C). Since it is known that a valuable number of GPI linked proteins play a crucial role in synapse formation and plasticity with deficits already shown in cell culture, we performed an immunostaining to visualize synaptophysin a presynaptic marker (Yuan et al., 2017). In fact, we observed a decreased immunoreactivity for synaptophysin in CA1-SR of Pigv341E mice (Fig. 6A). In contrast, there were no significant differences in CA3-SR and CA1-ML between genotypes (Supplementary Fig. 10A, B). To test whether synaptic connectivity defects accompany the observed behavioral abnormalities, electrophysiology recordings were conducted specifically in the CA1-SR region where synaptophysin appeared to be reduced in Pigv341E mice. We tested input-output functions in the CA1 region and observed a lower amplitude of EPSPs at different stimulation intensities in Pigv341E mice (Fig. 6B). In the paired pulse facilitation (PPF), Pigv341E mice revealed an increased PPR (Fig. 6C). Moreover, the PTP showed a higher slope of EPSP in Pigv341E mice (Fig. 6D).

(A) Representative images of immunofluorescence staining show less synaptophysin immunoreactivity (green) in Pigv341E mice in CA1-SR, 4’,6-Diamidin-2-phenylindol (DAPI) (blue) (left). Synaptophysin immunoreactivity was quantified with Fiji ImageJ and reveal significantly reduced immunoreactivity/μm2 in CA1-SR in Pigv341E mice (right). (B) Input-output: EPSP amplitude is reduced in Pigv341E mice at different pre-synaptic fiber volleys (PFV). (C) Paired pulse facilitation revealed an increased paired pulse ratio (PPR) in Pigv341E mice. (D) post-tetanic potentiation (PTP) is increased in Pigv341E mice.
Pigv341E=homozygous for Pigv p.Ala341Glu, wt=wild-type. Animals used for the synaptophysin-staining were 3 weeks old: Wt(female n=3, male n=2) Pigv341E(female n=2, male n=4) Animals used for the electrophysiology recordings: Wt(female n=2, male n=2) Pigv341E(female n=2, male n=2). The data from the synaptophysin immunofluorescence staining was analyzed with a parametric student t-test. *P<0.05 **P<0.01, ***P<0.001.
Shift in relative cell count of hippocampal cellular subgroups in Pigv341E mice
We were able to prove a synaptic defect in the CA1-SR region of Pigv341E mice that potentially resulted in impaired spatial long-term memory. In order to identify the cell types most affected by GPIBDs, we performed single-cell RNA sequencing on hippocampal cells of mice after cognitive behavioral tests. Based on the gene expression profiles of around 8,800 Pigv341E and 7,100 wild type single-cells, we defined 17 cellular subgroups (Fig. 7A). Cells from both Pigv341E and wild-type mice were present in all subgroups, but the distribution differed between genotypes (X2 = 267.61, df = 14, p < 2.2 * 10−16). While the fractions of granule cells, oligodendrocytes and a microglia subpopulation (microglia 3) were decreased in the pooled samples from Pigv341E mice, the fractions of subicular neurons, gabaergic (inhibitory) interneurons and fibroblast-like cells were increased compared to the pooled wild type samples (Fig. 7B).

(A) Hippocampus cells from both Pigv341E and wild-type mice cluster into 17 cellular subgroups, (B) with a skewed distribution of cells across subgroups in the Pigv341E sample in comparison to wild type. Percentages below 3% are not shown. (C) Differential expression testing between Pigv341E and wild-type cells within each cellular subgroup yielded a number of differentially expressed genes with an absolute log2 fold change of at least 0.25 and an adjusted p-value below 0.01. The most extensive changes in gene expression were observed for the third subgroup of microglia cells and the first subgroup of subicular neurons. For sets with less than 20 differentially expressed genes, gene counts are not shown. (D) The global comparison between all Pigv341E and wild-type cells highlights the hippocampus-wide effect on the genes Abl1, Hdc, Cyp4×1 and Gm14216, for which a significant change in expression was detected within each cellular subgroup. The dashed horizontal line is located at an adjusted p-value of 0.01, the dashed vertical lines at an absolute log2 fold change of 0.25 and the dotted vertical lines at an absolute log2 fold change of 0.7. For genes with an absolute log2 fold change above 0.7, gene symbols are shown. Within the subgroups of microglia 3, neurons subiculum 1 and pyramidal neurons (CA3), GO enrichment analysis revealed a number of overrepresented biological process terms (E), cellular component terms (F), and molecular function terms (G) in the sets of differentially expressed genes between Pigv341E and wild-type cells within the cellular subgroups. For each set of genes with significantly increased or decreased expression between genotypes, up to 3 terms with the lowest adjusted p-value after removal of redundant gene ontology terms are shown. The gene ratio, i.e. the number of genes annotated with a term divided by the respective number of differentially expressed genes, is encoded by point size. Cellular subgroups with no significantly enriched terms were omitted. GO terms enriched in both differentially expressed genes with increased and decreased expression within a subgroup are contracted into a single star-shaped symbol. DE genes, differentially expressed genes; FC, fold change; GO, Gene Ontology; Padj, adjusted p-value. Pooled samples (wt(male=4), Pigv341E(male=4)). n=1 per Genotype.
De-regulation in gene expression related to synapse organization and signaling transduction in Pigv341E hippocampal cells
Expression analysis of single-cell RNA sequencing data yielded a number of differentially expressed genes between Pigv341E and wild-type cells within each cellular subgroup (Fig. 7C), with a robust decrease in expression of the non-receptor tyrosine kinase Abl1 and increase of the histidine decarboxylase Hdc, the cytochrome P450 member Cyp4xl and the predicted lncRNA Gm14216 both within and across all cellular subgroups (Fig. 7D, Supplementary Fig. 15-17). The most extensive change in gene expression within a cellular subgroup was observed in the first subgroup of subicular neurons and the third subgroup of microglia cells (Fig.7C, Supplementary Fig. 15, Supplementary Fig. 16). Among the differentially expressed genes in subicular neurons, GO terms (biological process) related to regulation of synapse organization were enriched in genes with increased expression in Pigv341E cells, while the GO terms (biological process) related to regulation of cell morphogenesis and to commissural neuron axon guidance were enriched in genes with a decreased expression (Fig. 7E). Furthermore, GO terms (biological process) associated with cell-cell adhesion via plasma-membrane adhesion molecules were enriched in genes with increased and decreased expression (Fig. 7E).
In the single-cell RNA sequencing we identified three different microglial populations in the hippocampus (Fig. 7A, B, microglia 1-3). All three expressed the marker genes Csf1r and C1qa (Supplementary Fig. 14). However, in GO analysis the top 10 GO terms (biological process) in microglia 1 and 2 cells were related to cell activation, migration, phagocytosis and immune responses (Supplementary Table 2). In contrast, microglia 3 cells displayed top 10 GO terms (biological process) that were related to ribosome, ribonucleoprotein complex biogenesis and cytoplasmic translation (Supplementary Table 2). Thus, we considered microglia 1 and 2 cells as more phagocytic and migrating than microglia 3 cells. We found over 326 genes differentially expressed between genotypes in the less phagocytic and migrating microglia cells (microglia 3). Remarkably, 306 out of 326 were down-regulated in cells of Pigv341E mutants (Fig. 7C). In GO analysis (biological process), down-regulated genes were enriched in pathways that are involved in small GTPase-mediated signal transduction and regulation of microtubule cytoskeleton polymerization and de-polymerization in Pigv341E cells (Fig. 7E). In addition, we observed a low proportion of differentially expressed genes (20) between genotypes that were up-regulated in Pigv341E cells. Among these, we found Rp138, Rps21 and Rps28 that encode for ribosomal proteins.
CA3 pyramidal neurons project their axons to the CA1 region where we observed dysfunction in synaptic transmission in Pigv341E mice. Therefore, we had a closer look in these cells and observed 79 differentially expressed genes (Fig. 7C). In GO analysis, genes were enriched in pathways with a decreased expression associated with adherens junction organization as well as regulation of cell-substrate junction assembly and focal adhesion assembly in Pigv341E CA3 pyramidal neurons (Fig. 7E). Interestingly, we observed also an enrichment of genes with a decreased expression related to neuron-neuron synaptic transmission and to regulation of synaptic vesicle exocytosis and synaptic vesicle transport (Supplementary Table 3).
Discussion
Pigv341E is the first mouse model for GPI anchor deficiency with a hypomorphic mutation that displayed drastic alterations in behavior reflecting key aspects of the GPIBD patient’s conditions. We were able to demonstrate in these mice a severe motor phenotype that included deficits in motor coordination, grip or muscle strength, climbing and hanging behavior (in HCS), alterations in the walking pattern and hindlimb clasping. Behavioral traits such as altered walking pattern, hindlimb clasping and motor coordination deficits are usually observed in mouse models with an ataxia-like behavior and cerebellar dysfunctions (Wang et al., 2015; Kojic et al., 2018). In agreement with these findings, ataxia is also observed in some GPIBD patients (Knaus et al., 2018).
Since Pigv341E mice showed increased self-grooming in the HCS, which is a repetitive, highly stereotyped pattern that can be associated with autistic-like behavior in rodents, we suspected abnormalities in social behavior as well (Kalueff et al., 2016). Autistic features are reported in a subgroup of GPIBD patients (PGAP3-deficient patients) (Knaus et al., 2016) but PIGV-deficient patients are also found to be social individuals, keen to social contacts despite their severe speech impairments. Interestingly, we observed in Pigv341E mice an enhanced social approach behavior that is in contrast to common social behaviors in mouse models for autism (Silverman et al., 2010). Furthermore, a confounder due to olfaction within the observed enhanced social approach behavior was neglected, since there were no differences between genotypes in the buried food test (Supplementary Fig. 7D). Taking into account the enhanced social approach behavior in Pigv341E mice the positive social abilities in PIGV-deficient patients seem to be characteristically for PIGV-deficient individuals and should be considered for diagnosis. Also in other syndromes with ID, e.g. in Williams-Beuren syndrome, affected individuals are known as being extremely sociable in spite of their limited understanding of basic social norms (Järvinen, Korenberg and Bellugi 2013). However, it is yet unknown to which extent other GPIBD patients affected in other genes than PIGV reveal positive social abilities. In conclusion, since we did not observe in Pigv341E mice a characteristic social behavior for autism and autistic features were seen only in a subgroup of GPIBD patients (PGAP3-deficient patients), autism should be considered as a doubtful general feature of GPIBD.
Pigv341E mice showed a deficit in spatial long-term memory in the Barnes maze, correct shortterm spatial memory and short-term working memory (y-maze test). Furthermore, Pigv341E mice revealed a delay in spatial learning than wild-type mice in the Barnes maze (day 1-3). Since in the Barnes maze the latency to escape was not only increased in Pigv341E mice, but also the path length, we excluded the motor phenotype as a confounder. However, even though the path length and the latency to escape were increased in Pigv341E mice, the number of visits to wrong holes was not significantly altered from day 2-12 (Supplementary. 8C). The analysis of the searching strategy revealed that Pigv341E mice were less often targeting the correct hole without any errors (number of wrong holes) than wild-type mice (Supplementary Fig. 8D, direct strategy) (Wt: 15.8 %, Pigv341E: 3.3 %). While Pigv341E mice used more the random strategy (Wt: 9.7 %, Pigv341E: 56.7 %) of the time (targeting holes without any order), wild-type mice used the serial strategy more often in order to find the correct hole (Wt: 25.4 %, Pigv341E: 20.0 %) (Supplementary Fig. 8D). Therefore, Pigv341E mice covered with only a few wrong holes already a larger distance than wild-type and it may explain why the path length and the latency to escape was significantly increased in Pigv341E mice, whereas the number of wrong holes were not significantly altered between genotypes.
Interestingly, electrophysiology recordings revealed reduced synaptic transmission at CA1-SR in Pigv341E mice, which could be consistent with the observed impairment in long-term spatial memory and hippocampus-dependent species-specific behaviors (marble burying and nest construction tests). While PTP and PPR were increased in Pigv341E mice, the input-output curve was reduced indicating a reduced synaptic release probability. Due to an increased PTP, PPR and a reduced immunoreactivity of synaptophysin, a presynaptic vesicle protein, we suggested a reduced pool of ready releasable vesicles in the pre-synapse that lead to a reduced input-output curve in the post-synapse. In this regard, it is noteworthy that GO analysis of single-cell RNA sequencing data revealed that genes with a significantly decreased expression in Pigv341E-CA3 pyramidal neurons were enriched for GO-terms (biological process) associated with synaptic transmission and vesicle transport.
Single-cell RNA sequencing data revealed the most prominent differences in gene expression in a subgroup of subicular neurons and microglia. In subicular neurons 1, up-regulated genes were associated with biological processes such as synapse organization. Since we observed a synaptic defect in CA1-SR, revealed by immunohistochemistry and further supported by electrophysiological recordings, we hypothesized a synaptic defect in the subiculum as well, also due to the results obtained from the single-cell RNA sequencing. The subiculum is an important brain area in the hippocampus for memory retrieval that is linked through microcircuits with the CA1 (Ledergerber and Moser, 2017). Lederberger, et al. described two distinct circuits for memory acquisition and retrieval: Memory acquisition involves the CA1 and medial-entorhinal-cortex in contrast to memory retrieval that involves the CA1, subiculum and the medial-entorhinal-cortex. However, whether memory acquisition or memory retrieval or even both conditions are affected in Pigv341E mice could be more specifically tested in future studies.
Strikingly, Pigv341E-microglia 3 cells showed 306 down-regulated genes. Therefore, microglia might play a more important role in GPI anchor deficiency than previously thought. These genes were enriched in GO terms (biological process) related to “protein localization to cell periphery”, “small GTPase mediated signal transduction” and “regulation of microtubule polymerization or de-polymerization”. Small GTPases are important mediators of the cytoskeleton (Hervé and Bourmeyster, 2015). Thus, we hypothesized that a GPI anchor defect leads to down-regulation of small GTPase-mediated pathways that has further on consequences on cytoskeleton organization in this microglia subtype.
It is estimated that up to 0.5% of the eukaryotic proteins are GPI-linked with a broad range of different functions comprising cell-cell adhesion, signal transduction and antigen presentation (Eisenhaber et al., 2001). It is therefore surprising that the pathophysiology of the acquired GPI-anchor deficiency PNH is mainly explained by the reduced expression of only two substrates, CD55 and CD59, reducing the protection of the cell from the MAC, which can also be effectively treated by eculizumab, inhibiting complement activation (Kelly et al., 2011). Likewise, the analysis of mouse models for congenital forms of GPI-anchor deficiencies has also aimed at identifying other lead targets. McKean et al. suggested a pivotal role of Cripto/TGFb signaling in the development of holoprosencephaly (McKean and Niswander, 2012), while Lukasz et al. discussed the compromised role of the GPI-anchored Folr1 in neural crest cells and the cranial neuroepithelium that could be linked to the facial gestalt (Lukacs et al., 2019). Interestingly, there is a remarkable subset of GPI linked proteins involved specifically in synapse formation and plasticity (Um and Ko, 2017). Since Pigv341E mice show a hippocampal synaptic defect, this subset of GPI-linked proteins, among these GPI-linked EphrinA, may have a pivotal role in the development of the disease as well. Activation of EphA1-8 and 10 receptor tyrosine kinase by GPI anchored Ephrin-A1-5, for instance, defines synaptic strength and plasticity through activation of downstream pathways involved in learning and memory formation in the hippocampus (Dines and Lamprecht, 2016) Single-cell RNA sequencing analysis revealed that Abl1, known to interact on protein level with several EphrinA-receptors (Supplementary Fig.1E) (Szklarczyk et al., 2015), was not only down-regulated in Pigv341E mice across all cellular subgroups but also within each cellular subgroup. Our hypothesis is that the GPI anchor defect in the hippocampus is especially critical for EphrinA signalling, and that defective GPI anchoring of EphrinA in turn reduces hippocampal EphrinA receptor and Abl1 activity. In this regard, other studies have shown as well that axon repulsion is ephrin-A-dependent and mediated through the Abl kinase family (Harbott and Nobes, 2005). Interestingly, Ephrin-A2/-A3 double knockouts exhibit behavioral alterations similar to Pigv341E mice that are displayed by a decreased locomotor activity in the open field test, a reduced marble burying behavior and an increased grooming behavior (Wurzman et al., 2015).
Along with Abl1, also Hdc and Ptgds were de-regulated in Pigv341E mice with increased expression across all cellular subgroups. Hdc encodes for a histidine decarbocylase catalyzing the conversion from histidine to histamine that is an important neurotransmitter regulating circadian rhythm (Tuomisto et al., 2001) In rodents, histamine is increased during the dark phase to induce wakefulness and decreased during the light phase to induce sleep (Thakkar, 2011). Furthermore, it was shown that intracerebroventricular application of histamine triggers characteristic signs of wakefulness such as increased grooming and exploration behavior that were also observed in Pigv341E mice (HCS, SAM) (Thakkar, 2011). Furthermore, during home-cage activity monitoring (group housed) and the HCS (individually housed), Pigv341E mice were found to be, during the light cycle, more active and slept for shorter durations respectively. Consequently, a higher expression of Hdc may lead to a higher production of histamine, thereby disturbing circadian rhythm and showing classical signs of wakefulness in Pigv341E mice during the light phase. Ptgds codes for prostaglandin D2 synthase, which converts prostaglandin H2 (PGH2) into prostaglandin D2 (PGD2) which in turn is able to induce sleep (Urade and Hayaishi, 2011). It was shown that PGD2 fluctuates with the circadian rhythm and is increased in the cerebrospinal fluid when rats were sleep deprived (Ram et al., 1997). Therefore, up-regulation of Ptgds expression could be an indicator of sleep deprivation in Pigv341E mice. However, how a miss-regulation of Ptgds and Hdc could be associated to GPI anchor deficiency is still unknown and should be answered in future studies. Furthermore, since Pigv341E mice showed fewer resting phases during their classical inactive (light) phase, a careful analysis of sleep pattern in GPIBD patients seems indicated. So far, sleep disturbances have mainly been reported for PGAP3-deficient patients (Knaus et al., 2018).
In conclusion, we presented in this work a deeply phenotyped mouse model that mirrors the human phenotype. Furthermore, we proved a hippocampal synaptic defect that may lead to impaired spatial long-term memory and we were able to generate some novel hypothesis about the pathomechanism underlying the disease. We hope that our model as well as our phenotyping approach will be used in the future to study in more detail the pathomechanism and the response to therapeutic interventions.
Funding
This study was supported by the German Research Council (Deutsche Forschungsgemeinschaft (DFG); Grant No.: KR3985/6-1 and awarded to P.M.K.) and the Berlin-Brandenburg School for Regenerative Therapies (Final year stipend awarded to M.R.D.L.S.)
Competing interests
The authors report no competing interests.
Acknowledgements
We would like to thank Bioinformatics analysis (CUBA) of University Hospital Bonn for their support. Furthermore, we want to thank the animal outcome core facility (AOCF) of the NeuroCure center and Charité-Universitätsmedizin as well as the animal facility, transgenic core and the sequencing core facility from the Max-Planck-Institute for Molecular Genetics in Berlin for their support.
References


