

SUMMARY
Serial organs, such as limbs or teeth, develop with the same sets of genes and regulatory sequences. Correlated evolution is expected by default, but decoupled evolution is often achieved, as in mouse with a morphological innovation in the upper, but not the lower molar. We studied developmental evolution of hamster and mouse molars with transcriptome data. We reveal a combination of three morphogenetic changes likely causing the new morphology of the mouse upper molar. Surprisingly, most of these changes are common with the lower molar and lower molar gene expression diverged as much as, and coevolved with, the upper molar.
Hence, adaptation of the upper molar has involved changes in pleiotropic genes that also modified lower molar development but preserved its final phenotype. From the lower molar point of view, it is a case of Developmental systems drift (DSD). We think that DSD accommodates pleiotropy, explaining why in teeth and more generally in the body, the evolution of developmental gene expression is fast and correlates between organs.
HIGHLIGHTS
- The evolutionary innovation of mouse upper molar involves several morphogenetic changes
- Most of the associated gene expression changes are shared with the mouse lower molar
- Lower molar’s phenotype is conserved, thus its developmental gene expression drifted
- Adaptation with pleiotropic genes drove developmental system drift in the other tooth
INTRODUCTION
During development, the same pleiotropic genes are used in different times and organs (McQueen and Rebeiz, 2020; Stearns, 2010). A gene variant advantageous in one organ should not be deleterious in the others to be selected, which limits possibilities for adaptation. Despite this, organs and body parts evolve very diverse shapes and sizes (Carroll, 2008). This is especially true for serial organs, such as legs or wings in insects, vertebrate fore and hindlimbs, or different teeth. The shape differentiation of serial organs often roots deeply in evolution (e.g. tetrapod limbs (Minelli, 2003; Siomava et al., 2020)). Later during species diversification, drastic shape changes often occur in one appendage but not in others, as in bat’s wings/legs. How do differentiated serial appendages evolve independently of one another despite gene pleiotropy is an open question.
Within a species, a serial organ acquires its specific shape during development through a few selector genes, each specifically expressed in an organ. They encode transcription factors, which introduce organ-specific differences in the gene regulatory network (Mann and Carroll, 2002; Weatherbee and Carroll, 1999). Some level of genetic independence therefore predates further independent phenotypic diversification. This provides two routes for it: 1) Mutations in selector genes or in their targeted regulatory regions change developmental expression selectively in one organ, affecting the shape of this organ (Akam, 1998). 2) Mutations in other regions of the genome change gene expression in both organs, but this affects the shape of a single organ. Although less obvious, this route is possible if gene regulatory networks, which are wired differently in different organs, react differently to the same mutation. How much independent evolution relies on one or the other route, appendage-specific or shared expression changes, is unknown.
To study this question, we choose a case of independent adaptation in two serial organs, the upper and lower mouse molars. Between 18-12 million years ago, the upper molars of mouse ancestors gradually acquired a new cusp row on the lingual side, and reduced cusps size on the buccal side (Figure 1). Their lower molar kept the ancestral number of cusps. In the hamster lineage, both molars kept an ancestral-like cusp number and organisation (Lazzari et al., 2008; Coillot et al., 2013). Importantly, it is a case of independent evolution, but not a case of de novo differentiation since the shape of upper and lower molars were already different in the mouse/hamster ancestor.

A. Drawings of the epithelium and mesenchyme compartments at four stages of molar development: at “bud” stage, an epithelial signalling centre called PEK (for Primary Enamel Knot) triggers the formation of a “cap” defining the future crown. Between “cap” and “bell” stage, SEKs (Secondary Enamel Knots) are patterned sequentially in the epithelium, and drive cusp formation. By the end of morphogenesis, the mesenchyme has the shape of the future tooth and the epithelium is a kind of dental impression.
B. Dynamic and pattern of cusp addition in mouse and hamster lower and upper molars. Each panel is a series of developing molars hybridised against Fgf4 to reveal signalling centres (back dots). x axis: developmental age, y axis: morphological stage, with diagrams of signalling centres arrangements and 3D scans for final morphologies. Time series were modelled using Markov processes as a series of stages with specific durations (grey bars). Arrowheads show homology established on morphological criteria at early cap stages and late bell stage.
C. Principal component (PC) analysis of 64 molar bulk transcriptomes based on 14532 1:1 orthologues. Each symbol is an individual transcriptome with a colour gradient for relative development time. Dotted lines: Stage homology established by morphology is confirmed and used as boundaries for relative developmental time.
D. Temporal expression profile in the 4 tooth types fitted by a series of nested models, exemplified by Fgf10 and schematized with different colours. “1 curve”: a single curve for the four time series (black); “upper/molar”: one curve per tooth plus an offset that is species-specific (red); “hamster/mouse” one curve per species (blue); 4 teeth”: 4 curves (yellow). See also Figure S1.
Molars develop from the physical and molecular interaction between an epithelium and a mesenchyme (Jernvall and Thesleff, 2012, Figure 1A). The epithelium grows and folds up to form the cusps at the surface of the crown. This is driven by the spatio-temporal patterning of two types of signalling centres, PEK and SEK (Primary and Secondary Enamel Knots respectively) which depend on activation-inhibition loops (Salazar-Ciudad, 2012). The PEK determines the field of the molar crown. As this crown field grows, the SEKs are patterned sequentially. This determines the position of the cusps, and starts with a buccal cusp. According to extensive knowledge on tooth morphogenesis and evolution, the supplementary cusps may evolve through a change in the activation-inhibition loops and/or a change in the size of the crown field.
Activation-inhibition loops involve molecules expressed in signalling centres and diffusing from them. These molecules, such as members of the BMP, WNT or SHH pathways, promote or inhibit cusp formation. Tooth morphogenesis modelling and in vivo experiments have shown that changes in these loops can modify the number of cusps and recapitulate evolutionary changes (Harjunmaa et al., 2012, 2014; Morita et al., 2020; Salazar-Ciudad and Jernvall, 2010). It enables us to predict that an additional cusp may form, if the range of inhibition of these signalling centres shortens and if the lingual field is large enough.
The molecular mechanisms controlling the size and the bucco-lingual polarity of the crown field are not well deciphered. We know that the mesenchyme and its proportion relative to epithelium are key to control tooth size and cusp number (Cai et al., 2007; Hu et al., 2006). Although it is obvious that cusps are patterned from buccal to lingual side (Cho et al., 2007; Pantalacci et al., 2017), the mechanisms are unknown. This process is reminiscent of tooth row patterning, also occurring from buccal to lingual side, which is driven by an antagonism between BMP4 (buccal side) and OSR2 (lingual side) (Jia et al., 2013, 2016; Lan et al., 2014; Zhang et al., 2009). Since the mechanisms for tooth (PEK) formation are largely re-used for cusps (SEK) (Jernvall and Thesleff, 2012), it would be unsurprising that the same antagonism rules the patterning of the cusps along the bucco-lingual axis.
Lower and upper first molars show some genetic independence, as seen with tooth agenesis in humans (Klein et al., 2013). In mouse, it is evidenced by molar-specific effects in mouse mutants (Hallikas et al., 2021; Kwon et al., 2017) and QTL loci (Navarro and Murat Maga, 2018; Shimizu et al., 2004). The homeotic-code present in the jaws at the early stages of development is still present when molars are initiated (Dlx genes, Pou3f3 and Nkx2.3 (Cobourne and Sharpe, 2003; Hirschberger et al., 2021; Jeong et al., 2008). We have previously demonstrated that later during morphogenesis, Dlx expression is no longer specific but remains biased. Only three genes remain specific: in the upper molar, Pou3f3 and its non-coding regulator and in the lower molar, Nkx2.3. These transcriptional factors probably control large networks because many genes are consistently biased throughout morphogenesis (Pantalacci et al., 2017).
The fossil record suggests that the genetic independence of lower and upper molars is an old property, possibly linked to the bucco-lingual axis. In early mammals, cusps in the lower and upper molars were arranged in opposite triangles along the bucco-lingual axis (tribosphenic molars (Davis, 2011). In later mammals, including mouse/hamster common ancestor and hamster, molars are more symmetrical (Hillson, 2005). Inherited differences in the gene regulatory network may however subsist and have predisposed the upper molar, but not the lower molar, to form lingual cusps.
Here we studied whether the independent evolution of the mouse upper molar has only involved selective mutation(s) affecting upper or molar development, or if it also involved mutations affecting the development of both molars but impacting only the shape of the upper molar. We followed molar morphogenesis in mouse and hamster with a temporal series of transcriptomes. By comparative transcriptomics, we can separate and quantify developmental gene expression changes that are specific to the mouse upper molar (stemming in a mutation with selective effect on development) or shared with the lower molar (stemming in a mutation with shared effect). By studying the underlying developmental mechanisms, we can predict which changes are relevant for the new upper molar morphology.
We identified three developmental changes which likely combine to form the extra cusps in the mouse upper molar. Two of them are shared with the lower molar. We also show that gene expression in lower molar diverged as much as, and coevolved with, gene expression in upper molar. This contrasts with the conservation of cusp number in the lower molar. Thus, drift in lower molar development goes along with adaptation in upper molar development. We propose that mutations producing shared gene expression changes have a major contribution to appendage-specific adaptation.
RESULTS
Mouse and hamster molars develop at different paces. We predicted developmental age from embryonic weight in each species and aligned temporal series between species with homologous start and end points of molar morphogenesis (Figures 1 and S1). We then devised a twofold strategy to compare the dynamics of cusp formation along with the dynamics of gene expression. First, we established the sequence of PEK and SEKs formation and modelled the relative stage durations with continuous Markov processes (Figure 1B). Second, we obtained RNA-seq data at high time resolution and modelled temporal profiles with polynomials. With these models we tested, for each gene, whether a temporal profile in a given tooth and species significantly differs from one or several others (Figure 1D).
Mouse upper molar has specificites of morphogenesis visible in the transcriptome
In summary, we found specificities of the mouse upper molar, with an excess of mesenchyme and a proportionally longer period of lingual growth associated with exaggerated morphogenetic movements. Both developmental changes are reflected in gene expression.
To understand how the mouse upper molar evolved, we first searched for specificities in its development. The supplementary cusps of the upper molar form last, on the lingual side of the tooth (Figure 1B), but the dynamics of cusp formation differs as soon as cusp formation begins. After the PEK stage, all molars pattern their first cusp (1-SEK) and rapidly grow on the lingual side before patterning their second cusp lingually (2-SEK). This 1-SEK stage is longer in the mouse upper molar (likelihood ratio test, p < 1e-16, Figure 2A), which could prepare the formation of the supplementary cusps.

A. Relative duration of the first morphological stages highlights a longer period of lingual growth in mouse upper molar (1-SEK, purple). Stage durations from Figure 1B. PEK and SEK: primary and secondary enamel knots respectively.
B. Percentage of mesenchyme RNA in tooth germs estimated by deconvolution.
C. Left: Model to detect genes which differ in their upper-lower expression profiles in one species. Example of Sfrp2 gene expression levels (grey dots), significantly better modelled with two curves in mouse and one in hamster (purple curves), compared with one curve per species (grey curves). Right: Number of genes detected by this tooth-specific model in mouse (purple) and in hamster (green, LRT with adjusted p < 0.05). Barplots show their frequencies for the “total” gene set, genes from developmental “pathways”, genes from “bite-it” database, and genes with a mild or strong phenotype in tooth mutants (“Dispensable” or “Keystone”). Size of each gene set into brackets. Related to Figures S2-4.
We wished to test that bucco-lingual development has changed in the mouse upper molar.Little is known about it. We reasoned that the BMP4/OSR2 antagonism, which decides if/when a second tooth forms lingually to a first buccal tooth, could also decide when another cusp forms lingually to a first cusp. To test this hypothesis, we collected mouse transcriptomes of buccal and lingual sides at the early 1-SEK stage. Buccal sides of both molars show activation of WNT, BMP4 and SHH pathways transcriptional targets, but the lingual side is a naive tissue showing little activation (Figure S2). Lingual sides of both molars showed Osr2 and Sfrp2 expression. Thus, as seen for tooth germs, BMP4 and WNT pathways may activate cusp formation on the buccal side, while on the lingual side, OSR2 prevents WNT pathway activation through the WNT inhibitor SFRP2. In the upper molar the lingual side looked even more naive than in the lower molar, with even lower levels of pathway activities and twice higher levels of Sfrp2 expression (Figure S3). This supports the idea that the bucco-lingual polarisation dependent on the BMP4-OSR2 antagonism is active in mouse molars and enhanced in mouse upper molar. By delaying cusp formation on the lingual side, this may allow the growth of a larger domain where more cusp can be fitted.
We previously found in mouse that the upper molar germ contains more mesenchyme than the lower germ (Pantalacci et al., 2017), which may also be linked to the supplementary cusps since a larger mesenchymal to epithelial cells ratio triggers more cusps in artificial teeth. To control whether this is specific to the mouse, we extracted mesenchyme and epithelium-specific marker genes from pure tissue transcriptomes, and used in silico deconvolution to estimate the mesenchyme proportions from whole tooth germ transcriptomes. The proportion of mesenchyme is indeed significantly higher in the upper molar in mouse, but not in hamster (Wilcoxon tests, p < 2e-16 and p = 0.152, Figure 2B).
We then detected genes whose expression profiles differ between upper and lower molars in mouse but not in hamster, by using a dedicated temporal model (Figure 2C). As a control, we built a reciprocal model to detect genes with tooth specific profiles in the hamster. We found 2.5 times more genes with tooth-specific profiles in mouse as compared to hamster. The difference in mesenchyme proportions between mouse upper and lower molars may inflate differences in levels of expression (Pantalacci et al., 2017). Even after removing the effect of baseline expression levels we still observed 1.6 times more tooth-specific genes in mouse. This excess is also visible in genes active in tooth development or with a phenotype in tooth mutants. The function of the genes with tooth specific profiles differs markedly between mouse and hamster. In mouse, genes are linked to cell adhesion and migration, as well as cell cycle and mitosis (Figure S4). This is consistent with our previous findings suggesting that morphogenetic movements are enhanced in mouse upper molar during the period of lingual growth (Pantalacci et al., 2017).
In summary, we found specificities of the mouse upper molar, with an excess of mesenchyme and a proportionally longer period of lingual growth associated with exaggerated morphogenetic movements. Both developmental changes are reflected in gene expression.
Developmental gene expression diverged as much in lower as in upper molars
If the specific changes in the mouse upper molar morphology occurred through specific changes in expression, then transcriptomic profiles should have diverged more in upper than in lower molar. We scored the divergence between mouse and hamster upper and lower molars (LRT with adjusted p < 0.05). We found that 22.0% genes diverged in the lower molar, an even higher percentage than in the upper molar (17.3%, Figure 3A). Gene sets relevant for tooth morphology are even more divergent, and some show a clear spatio-temporal divergence in both molars (Figure 3B-E). The development of both molars has thus diverged extensively between mouse and hamster, with even a slight excess in the lower molar.

A. Temporal profiles of expression levels modelled by tooth type. Dlx1 is shown with samples (grey dots), and models (curves). Left: the “upper divergent” model, allowing different profiles in mouse and hamster (green), is compared with the “upper non-divergent” fitting the same profile but different baseline expression levels (grey). Right: Same modellings fitted independently for lower molars (purple and grey). Best model was chosen for each molar by likelihood ratio test (adjusted p < 0.05). Barplots: percentage of divergent profiles in upper and in lower molars for different gene categories. A-C, Gene categories as in Figure 2A with numbers into brackets, genes from developmental “pathways” further splitted.
B. Percentage of “divergent” genes in upper and in lower molars (yellow), only in upper (green) or only in lower (purple).
C. Percentage of coevolution computed as the proportion of “divergent” genes, among genes varying between species and/or teeth, when all four teeth are modelled together as in Figure 1D.
D-E. Bmp4 and Wif1’s expression profiles (modelled as in A) corroborated by in situ hybridization of dental mesenchyme show that expression in upper and lower molar has coevolved. Dashed lines map pictures to the timeseries.
D. Shortly after cap transition, Bmp4 mesenchymal expression is low in the hamster, but already strong in the anterior and posterior parts of the mouse dental mesenchyme. Later on, expression is increased in the hamster and resembles mouse early cap stage, while in the mouse, Bmp4 is expressed in the whole mesenchyme.
E. Wif1 is precociously and ubiquitously expressed in mouse dental mesenchyme as compared with hamster.
Developmental gene expression in the lower molar co-evolved with that of the upper molar
Random mutations in the genome should most often produce gene expression changes in both molars. The transcriptomic profiles of the lower and upper molars should then coevolve to some extent. We use “co-evolution” for cases where lower and upper molar transcriptomic profiles have changed in a coordinated manner between species. Our analyses above already support such coevolution : First, 60% of the genes that diverged in the lower molar also diverged in the upper molar (Figure 3B, yellow bars). Second, the main axis of variation in the transcriptomes separates samples by species, but groups upper and lower molars, which is best explained by a pattern of divergence common to upper and lower molars (Figure 1C). By using the four teeth models (Figure 1D) we found that the expression profiles of 61% genes have coevolved (Figure 3C).
For many of these genes the coevolution of transcriptomic profiles is reflected in spatio-temporal patterns of expression. This is the case of Bmp4, an iconic gene of tooth development (Figure 3D, see later), but also of Wif1 (Figure 3E), Dkk1 and Bmper (see later).
Because sets of genes important for tooth development are largely impacted (Figure 3C), this co-evolution is not simply noise but rather reflects that developmental processes co-evolved in the two teeth. This development coevolution may have different phenotypic effects: an effect in both molars, an effect in upper molar only (then it is developmental system drift in the lower molar), no effect (developmental system drift in both molars). Because genes with molar defects in loss-of-function mutants largely coevolve, we can rule out the idea that this is developmental system drift in both teeth.
Next, we looked if features relevant to supplementary cusp formation have co-evolved in upper and lower molars. We examined the activation-inhibition mechanisms and the field size along the bucco-lingual axis, paying special attention to genes involved in these processes whose profile co-evolved in the transcriptomes.
Activation-inhibition mechanisms co-evolved in mouse molars
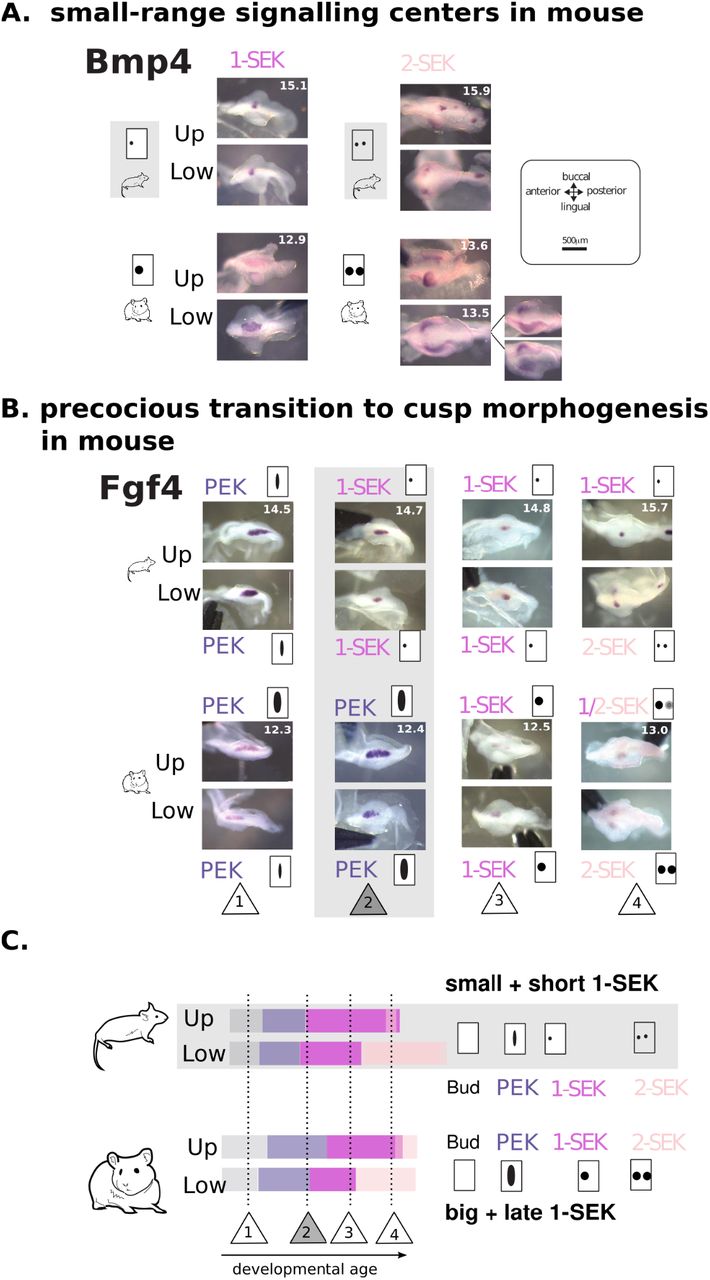
To get insight into the wavelength of activation-inhibition mechanisms in hamster and mouse, we studied the patterns of expression of two known inhibitors of cusp formation, Bmp4 (Meguro et al., 2019) and Shh (Kim et al., 2019). We also studied Wif1, which we consider a likely inhibitor since it antagonises the Wnt pathway, whose activation in the epithelium promotes cusp formation (Liu et al., 2008, Järvinen et al. 2006). Hence the spatial range of expression of Bmp4, Shh and Wif1 can be considered a readout of the range of inhibition. Bmp4 and Wif1 are expressed from the signalling centers : their expression pattern is much smaller and roundish in mouse than in hamster (both in PEK and SEKs). Shh, which more largely marks cells committed to cusp formation, also shows a more restricted expression (Figures 4, S5). Hence among the three pathways involved in the activation-inhibition mechanisms, inhibition is more local in both mouse molars.

A. Expression of Bmp4 is more focalized in mouse than in hamster SEKs. Mouse and hamster samples are paired for similar advancement of epithelial growth. Age of samples in days is in the upper molar picture (for samples taken from the same embryo) or in both pictures (samples taken from different embryos). B. Mouse molars transition earlier to cusp morphogenesis. Transition from the PEK to the 2-SEK stage as seen on tooth germ epithelial parts hybridised against Fgf4. Pairs of mouse/hamster embryos were selected to show four remarkable steps in this chronology (1-4 in triangles). At stage 2, Fgf4 expression is still elongated in hamster, as typical for a PEK, while it is already roundish in mouse, as typical for a SEK. C. Duration of each stage estimated by Markov models from Figure 1B. Numbers in triangles as in B. Timeline and cartoons on the right recapitulate changes in signalling centres. Related to Figure S5.
We also noticed a striking difference in the dynamics of the primary signalling centre (PEK). By comparing epitheliums of the two species matched for growth advancement, we found that both mouse molars already exhibit the rounded and focalized Fgf4 expression typical of a SEK when hamster’s still exhibit the large and elongated Fgf4 expression typical of the PEK (Figure 4B stage 2). This is consistent with the fact that both mouse molars quickly transition to 1-SEK after a rather short PEK stage (Figures 1, 4C).
We studied this further by matching early time changes in mouse transcriptomic profiles with precocious changes in mouse spatio-temporal expression. Dkk1 expression transiently decreases in mouse transcriptomes, which coincides with an earlier relocalisation of expression at cusp tips beneath the SEK (in situ hybridization, Figure S5A). This early relocalisation in the mesenchyme mirrors the early formation of the SEK in the epithelium. Bmp4 peaks earlier in mouse transcriptomes, and reaches earlier a spatially homogeneous expression in the mouse mesenchyme (Figure S5B). Wif1, a feedback inhibitor of the WNT pathway, rises earlier in mouse transcriptomes, and its mesenchymal expression is seen both earlier and in a larger territory in mouse tooth germs (Figure S5C). Three other targets of the BMP and WNT pathways, that feedback on these pathways, are precociously activated in mouse transcriptomes (Sostdc1, Grem2 and Sfrp2, Figure S5D). In summary, activation-inhibition mechanisms co-evolved in the two mouse molars. The mouse PEK is rapidly turned into a precocious and focalized 1-SEK, marking an early beginning of cusp morphogenesis in both mouse molars (Figure 4C).
Lingual field size co-evolved in mouse molars, but is even larger in the mouse upper molar
We mentioned earlier that the 1-SEK stage is especially long in the mouse upper molar. But in fact, it lasts longer in both mouse molars as compared to hamster (Figures 1B and 4B). Hence bucco-lingual development may have changed to produce a larger lingual field in both mouse molars, although more strongly in the upper molar.
To test this hypothesis, we asked whether the naive lingual tissue represents a larger proportion of the tooth germ in mouse than in hamster. We inferred these proportions by a deconvolution method based on buccal and lingual transcriptomes (Gong and Szustakowski, 2013). As expected due to progressive cusp formation, we found that the proportion of naive tissue decreases during morphogenesis in both species. But in mouse molars, and even more markedly in the mouse upper molar, the initial proportion of naive tissue is larger, and diminishes more slowly. The temporal expression profile of the OSR2 effector Sfrp2 follows the same pattern, with an overexpression in mouse, and a late downregulation especially in the mouse upper molar (Figures 2C, S2).
In summary, in mouse molars, the BMP4/OSR2 antagonism is shifted toward an increased OSR2 activity (Sfrp2 expression) which may increase the proportion of lingual naive tissue. This is further exaggerated in the upper molar, resulting in a larger lingual field where more cusps can fit.
A change in the BMP pathway may underlie the shift in the bucco-lingual axis in the mouse molars
Having identified that the BMP4/OSR2 balance is modified in mouse and is even more shifted in the upper molar, we came back to the list of genes with mouse upper specific profiles (Figure 2C) and checked its intersection with the list of genes with a marked bucco-lingual bias. The Bmper gene, a regulator of the BMP4 pathway in many tissues, ranked well in both lists (respectively 211/14532 and 9/12008). In mouse, Bmper is more expressed on the buccal side in both molars and more expressed in the upper molars on both buccal and lingual sides. In the time series, Bmper expression decreases with time (Figure 5A). As seen for naive lingual tissue or Sfrp2 gene (Figures 2C, S2), Bmper levels are higher in mouse, and decrease more slowly in the upper molar. This further suggested that Bmper participates in the regulation of the bucco-lingual axis.

A. Bmper transcriptomic profile. left: Expression levels in buccal and lingual parts of the mouse tooth germs (15 days). right: Bmper expression decreases with time and reaches a minimum when the tooth germ stops expanding on the lingual side. Expression is higher and lasts longer in the mouse upper molar. Ages in days above the plots, in relative time on the x axis.
B. Drawings of tooth germ sections at bud, cap and bell stage summarise Bmper expression established by in situ hybridization. Stage correspondence with dashed lines and numbers.
C. Foetal molar morphology of wild type (Wt) and Bmper null mutant (KO). Semi-automatic reconstruction of tooth mesenchyme was performed on micro-CT scans of PTA-stained heads taken at 19.5 days. Arrows point to the enlarged lingual cusp in both mutant molars. Arrowheads point to the third-forming buccal cusp, missing in the mutant upper molar. Related to Figure S6.
In situ hybridizations showed that in mouse molars, Bmper rapidly withdraws from the lingual side to remain strongly expressed in a small buccal domain only. This process is delayed in the upper molar. In the hamster, the withdrawal is symmetrical and similar in both teeth (Figures 5B, S6). Thus Bmper expression changes at two levels. First, it acquired a new bucco-lingual regulation leading to an early and asymmetric withdrawal. This co-evolved in both teeth. Second, it acquired a new lower-upper molar difference, with delayed withdrawal in the upper molar.
To gain insight into the function of Bmper, we obtained a mouse null mutant and studied the shape of its molars. Since the homozygous Bmper mutant are lethal at birth, this had to be done by reconstructing the enamel-dentin junction at 19.5 days, carefully matching them with controls of similar developmental age (see material and methods). The upper molar is modified: one of the buccal cusp is absent or poorly grown (Figure 5C, arrowheads) and one lingual supplementary cusp is more prominent (arrows). The lower molar is also modified: one lingual cusp is more prominent, the one found in the medial part of the tooth, as is the larger supplementary cusp. Thus Bmper loss modifies the bucco-lingual equilibrium and favours the formation of large lingual cusps.
In the common ancestor, a small set of transcription factors and effector genes already differentiated the transcriptome of lower and upper molars
To find specificities of the upper molar development that predated the mouse-hamster divergence, we searched for genes with different expression profiles between lower and upper molar in each species, and retained 495 genes having their highest average expression in the same molar (Figure 6A). These genes are involved in epithelial and mesenchymal development, cell adhesion, proliferation and differentiation and signalling, especially WNT but also BMP and NOTCH (enrichment for Gene Ontology terms, Figure S7). This set of genes contains a fifth of the genes whose mutant shows a defect in tooth morphogenesis, known jaw-identity genes (Nkx2.3, Pou3f3, Dlx1, 5 and 6) and many transcription factors, some of which being key regulators of tooth morphogenesis (Barx1, Msx1, Pitx1, Figure S8). We noted that the upper molar expression levels of Nkx2.3 and Pou3f3 are increased in mouse as compared to hamster, which was confirmed in our epithelium and mesenchyme transcriptomes at late cap stage. Thus, the bias of these identity genes is ancestral, but was possibly reinforced in mouse. The expression profile of these transcription factors is generally well conserved between mouse and hamster, but this is not the case for the bulk of the 495 genes since only 29.5% of them have a conserved temporal profile in both teeth (see Fgf10 as an example, Figure S9). Thus, a small set of transcription factors and their effector genes were carrying the lower-upper difference in the common ancestor (notably in the WNT pathway), even though they may be deployed differently in the current species.

A. Expression profiles modelled separately in hamster (left) and mouse (right). Hamster: the complex model allows for two curves, one for upper and one for lower molar (orange curves, prefered by 1703 genes) while the simple model has a single curve (grey). Mouse : complex model in purple. After filtering for the direction of upper/lower bias, 495 genes were shifted likewise in mouse and hamster. Bottom: number of genes with a different upper/lower expression in hamster and/or mouse is indicated inside parentheses (gene categories as in Figure 2). Barplots: among these genes, percentage of genes with upper/lower differences in a single species (orange: hamster; purple: mouse) or in both species (yellow: same direction; pale yellow: different direction).
B. The development of upper and lower molars differ mostly at early/mid-morphogenesis. Difference measured by bca (between component multivariate analysis). Peaks correspond to 1-SEK in upper and 2-SEK in lower molars (arrows).
C. Bucco-lingual difference in cusp patterning. The 3-cusp pattern involves a lingual cusp (Entd) in the lower molar and a buccal cusp (Mt) in the upper molar (arrowheads). This is reminiscent of the bucco-lingual pattern in early mammals’ tribosphenic molars. Images show the epithelium at the 3-SEK stage, hybridised with a Fgf4 probe. Protoconid-Prid, Metaconid-Mtd, Entoconid -Entd, Paraconid-Pad, Paracone-Pa, Protocone-Pr, Metacone-Mt.
D. Transitory phenotype in upper molar. At the end of the cap stage, upper molars of both species show an epithelial bulge (arrowhead) never seen in the lower molar. Related to Figures S7-S11.
In the common ancestor, upper and lower molars already differed in their bucco-lingual development
In early mammals, both upper and lower “tribosphenic” molars carried three main cusps, arranged in opposite triangles regarding the bucco-lingual axis: two buccal cusps for the upper and two lingual for the lower molar (Figure 6C). We looked for a heritage of this original lower/upper molar difference in the geometry and dynamics of cusp patterning of our two species with a particular focus on the bucco-lingual axis.
First, we noticed that in both species, cusp patterning is initiated (transition to 1-SEK stage and 2-SEK stage) and completed (transition to 6-SEK stage) later in the upper molar as compared to the lower molar of the same embryo (Figure 1). This delay was also obvious in the transcriptome: the upper molar transcriptome looks “younger” than the lower molar transcriptome of the same embryo (Figure S10).
Second, we found conserved lower/upper differences in bucco-lingual development. It is striking that in mouse and hamster, the three cups patterned at the 3-SEK stage have the same bucco-lingual arrangement than their homologous cusps in the tribosphenic molars (Figures 1B, 6A, S11). In both upper molars, the third SEK forms on the buccal side of the tooth germ, corresponding to a buccal cusp. In lower molars, it forms on the lingual side, corresponding to a lingual cusp. Besides this pattern, the relative duration of the three first SEK stages also differentiates upper and lower molars in both species (Figure S11), and upper molar germs are clearly distinguishable during the whole period, with their peculiar lingual epithelial bulge (Figure 6D). In accordance with the timing of these transitory phenotypes, the stages 1 to 3-SEK correspond to the period where lower and upper molar transcriptomes differ most from one another (Figure 6B). Finally, 40% of the 495 shared lower-upper genes are biased bucco-lingually in mouse. Together, these findings indicate that the upper molars show specificities of the bucco-lingual development, whose origin predates the mouse-hamster divergence.
DISCUSSION
Our study of mouse and hamster molars development elucidates key principles of phenotypic decoupled evolution in serial appendages. Combining transcriptome profiling with more classical evo-devo experiments, we quantified the evolution of developmental mechanisms and we identified multiple changes that we can reasonably consider causative.
Mouse upper molar adaptation involved at least three mutations in the mechanisms of cusp formation
The supplementary cusps form last, the most anterior one being the very last, just as it happens in the fossil record (Lazzari et al., 2008; Coillot et al., 2013). This “recapitulation” looks superficially like a case of “terminal addition”, a mechanism for evolutionary change whereby development is incremented with one more step (Gould, 1977)). However, divergence in gene expression peaks early in development and we point to three features that concern mouse early development, but pave the way for the supplementary cusps. We had to make the reasonable assumption that the hamster presents ancestral features, although only an outgroup species allows to firmly map changes in the mouse lineage.
The first feature is the shorter range of mouse signalling centres, allowing to squeeze more SEKs in an equivalent field. In particular, the range of Bmp4 expression is shorter. This is highly relevant since mutant mice overexpressing Bmp4 in the epithelium revert in evolution, with their reduced (or lost) supplementary cusps (Meguro et al., 2019). The second feature is the larger mesenchyme compartment. Increasing mesenchyme proportion increases cusp number in tooth engineering studies (Hu et al., 2006), probably because the mesenchyme promotes epithelial growth, which enlarges the field where activation-inhibition mechanisms act and pattern SEKs.
The third feature is the stronger polarisation of the molar field along the bucco-lingual axis, associated with a precocious transition from PEK to 1-SEK. The lingual field is enlarged, leaving a larger undifferentiated field, again where activation-inhibition loops can pattern SEKs.
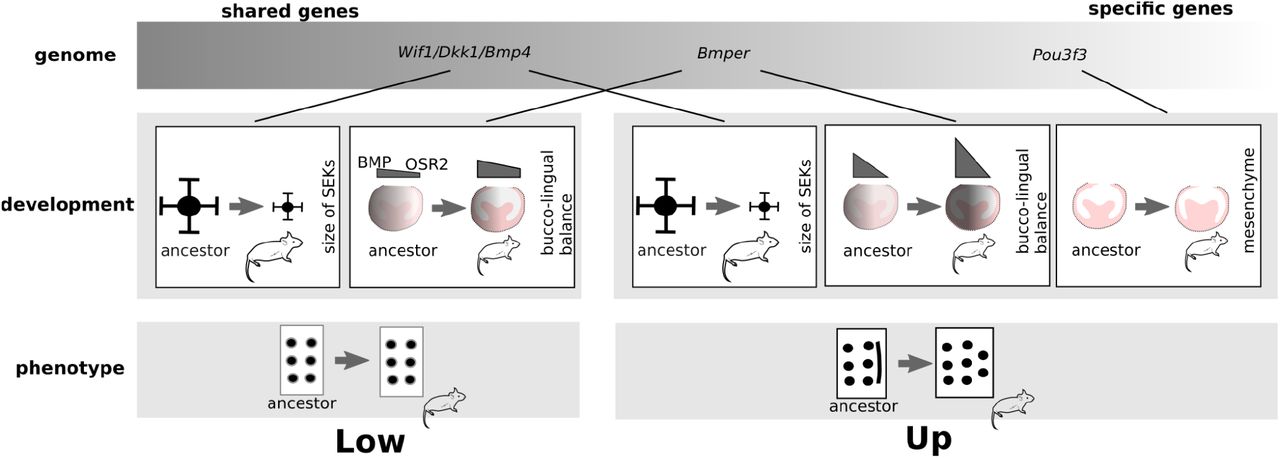
Because these different aspects of tooth development changed in mouse, the first one specifically in the upper molar (mesenchyme), the second one in both molars (signalling centres), and the last one in both molars but with different strength (bucco-lingual axis), we propose that the new phenotype involved mutations in at least three genes (Figure 7). This is coherent with the literature showing it is difficult to increase cusp number in mouse molars: in vitro experiments have shown it can be necessary to play on multiple pathways, and mouse mutants show, at best, small accessory cusps, but no supplementary main cusps (Harjunmaa et al., 2012)). Our model with different changes is also coherent with the stepwise addition of the supplementary cusps in the fossil record. Stem murine rodents had a single small extra cusp, the two extra cusps and the reduced buccal cusps only appeared later (Coillot et al., 2013). A combinatory effect of mutations has been observed in the evolution of serial color pattern elements in butterflies (Monteiro et al., 2007).

Working model with three features combining to produce the new cusps in mouse upper molar. The phenotype, development, and genome are represented. Transitions from ancestral phenotypes (with a lingual crest at the upper molar) to mouse phenotypes are indicated. For each developmental feature, the transition from an ancestral hamster-like state to the mouse is represented. Candidate genes are shown. Because some genetic changes impact development in both molars (SEK size), they have a pleiotropic effect on development. Others impact the upper molar specifically (mesenchyme) and probably originate from identity genes. Related to Figure S12.
Mapping mutations corresponding to the supplementary cusps is out of the scope of this study, but transcriptomics provided us with candidate genes. We ruled out regulatory changes in two obvious candidates from the literature (Fgf3 and ActivinβA, Figure S12, Charles et al., 2009; Kwon et al., 2017).
We pointed that Pou3f3 is expressed specifically in the upper molar mesenchyme of both species, but further upregulated in mouse. In insects, the evolution of the dose of identity genes has been correlated with the evolution of the size of serial organs (Paul et al., 2021). The increased dose of Pou3f3 could explain the larger proportion of mesenchyme specific to the mouse upper molar. This change is probably not sufficient to explain the new phenotype since molars do not show major defects in Pou3f3 loss-of-function mutants (data unshown in (Jeong et al., 2008)).
We also noticed changes in the expression patterns of Bmp4, Wif1 and Dkk1, three members of the BMP and Wnt pathways at the core of activation-inhibition networks (Salazar-Ciudad, 2012). A mutation in one of these genes may drive the changes observed in the others, given the regulatory feedback in these networks.
Finally Bmper/Cv2, a modulator of the BMP pathway (Correns et al., 2021; Ikeya et al., 2010; Kelley et al., 2009; Serpe et al., 2008), is a strong candidate. The molars of the Bmper loss-of-function mutant are “hypo-buccal/hyper-lingual” suggesting that Bmper is normally pro-BMP4 in the BMP4/OSR2 balance. The newly evolved asymmetric Bmper expression profile in mouse probably sharpened the BMP4/OSR2 antagonism, favouring BMP4 activity on the buccal side and decreasing it on the lingual side. This may link two observations in mouse: on the buccal side, the early PEK/SEK transition; on the lingual side, the larger lingual field. In cichlids, a QTL containing Bmper is associated with variation in tooth number (Bloomquist et al., 2015). Species with more teeth have reduced Bmper expression, as mouse with more lingual cusps have reduced lingual Bmper expression. Further studies are needed to confirm this model and identify corresponding cis-regulatory changes in the Bmper gene. If not directly in the Bmper gene, we expect a mutation in another member of the BMP4/OSR2 network, especially since lower and upper mouse molars react very differently to mutations in this network (eg. a tooth is normally formed/arrested at a very early stage) (Jia et al., 2013, 2016; Kwon et al., 2017; Lan et al., 2014). The teeth of the Bmper mutant are strikingly similar to the molars of Mastacomys fuscus brazenori, a mouse relative whose first upper molars have very large supplementary cusps and loss of the same buccal cusp, and lower molars have larger lingual cusps compared to buccal cusps. Therefore, mutations affecting this balance are likely also responsible for further diversification of the murine dental plan.
At least two mutations impacted the mechanisms of cusp formation in lower molar development although the final cusp number is unchanged
We show that the lower molar development has coevolved with the upper molar development. Temporal expression profiles coevolved massively and two of the mutations that combine for the change in upper molar phenotype also impacted lower molar development (producing shorter range signalling centres, a marked bucco-lingual asymmetry with a precocious PEK to SEK transition associated with an early withdrawal of Bmper from the lingual side). Despite this different tuning of developmental mechanisms, there is no effect on lower molar cusps number and relative size (Figure 7).
How these developmental changes remain cryptic in the lower molar is an open question. Molar development has non-linear properties (Gjuvsland et al., 2013; Milocco and Salazar-Ciudad, 2020; Morita et al., 2020; Urdy et al., 2016). The first upper molar obviously passes a threshold allowing cusp formation while the lower does not. In support of this view, the lower molar is capable of forming supplementary lingual cusps when activation is boosted by adding ACTIVINβA to the culture medium (Harjunmaa et al., 2012). One possibility is that the threshold to form lingual cusp is constitutively upgraded in lower molars, because of differences in the regulation of the bucco-lingual axis herited from early mammals. It means that the two molars in the common ancestor reacted differently to the same expression change (e.g. Bmper withdrawal from the lingual side). In support of this view, the common ancestor of mouse and hamster carried a crest along the lingual basis of the upper, but not the lower molar, which may be seen as a predisposition to enlarge lingually and form lingual cusp (Charles et al., 2009; Coillot et al., 2013). Another possibility, non mutually exclusive, is that the changes common to both molars bring upper and lower systems next to their respective thresholds (similar or different). The few specific changes in the upper molar may be just the small effect needed to pass its threshold, while the lower molar remains below it. For example, the smaller mesenchyme proportion of the lower molar (the endogenous source of ACTIVINβA) may contribute to keep it below its threshold.
Developmental System Drift as a mechanism facilitating independent evolution
We showed that transcriptomic profiles, and mechanisms for cusp formation, diverged nearly as extensively in the mouse lower molar as in the upper molar, and largely co-evolved with upper molar’ ones. Hence lower molar developmental evolution is incongruent with the fact that lower molar morphology diverged to a much lesser extent, and independently. Overall the lower molar shows unexpected levels of developmental divergence compared to its morphological conservation, a phenomenon known as Developmental System Drift (DSD, (Cutter and Bundus, 2020; Félix, 2012; True and Haag, 2001)).
It is widely admitted that some genetic changes produce phenotypic changes mediated by developmental changes but also that most genetic changes do not change the phenotype. DSD is less intuitive because it involves genetic changes that do produce developmental changes, but do not change the phenotype. There is now accumulating evidence that such cryptic developmental changes are frequent in evolution (Félix, 2007; Guignard et al., 2020; Torres Cleuren et al., 2019; Wotton et al., 2015). Because natural selection mainly acts on the final product of development, divergent developmental paths may be taken to reach the same final phenotype. Further taking into account that genomes are constantly mutating, and that developmental regulatory networks can accommodate substantial changes (Félix and Wagner, 2008; Peter and Davidson, 2011), DSD appears as a likely alternative to developmental conservation.
From the point of view of the upper molar, adaptation occurred with multiple mutations and mostly with mutations that also impact lower molar development. Such mutations would be usually considered likely to be purged by purifying selection on the lower molar and therefore an unlikely material for upper molar adaptation. But this disregards that a mutation may deeply change the developmental system without changing the final phenotype, in other words, that developmental systems can drift. Thereby, mutations considered as “pleiotropic” with respect to the developmental phenotype remain non-pleiotropic with respect to the adult phenotype and selection. They remain available for appendage-specific adaptation. It was thought that the independent evolution of serial organs was made possible despite extensive gene pleiotropy because of independent genetic features (identity genes) allowing mutations to specifically impact upper molar development. Our results meet this expectation, but also show the important contribution of several “developmentally pleiotropic” mutations accommodated by DSD.
More generally, our results demonstrate empirically that pleiotropy and DSD are two correlated phenomena, as suggested previously (Pavlicev and Wagner, 2012). This is consistent with modelling (Johnson and Porter, 2007; Tulchinsky et al., 2014) and the observation that DSD in the nematode’s vulva has been associated with selection for pleiotropic effects increasing fitness (Duveau and Félix, 2012). We suspect that serial organs with their heavy pleiotropy load are especially prone to developmental co-evolution and DSD. This explains why transcriptomic studies in serial organs often reveal marked co-evolution (Liang et al., 2018; Musser and Wagner, 2015) and why drosophila legs and wings largely share the same open-chromatin regions (McKay and Lieb, 2013). We suggest DSD may explain more generally why temporal profiles of gene expression evolve so fast in different embryonic organs, even for genes involved in human diseases and for pleiotropic genes (Cardoso-Moreira et al., 2019, 2020). Further work will reveal if the robustness and drift of developmental systems is the key explanation for the mystery of the massive burden of genetic pleiotropy.
AUTHOR CONTRIBUTIONS
S.P. and M.S. conceived the study, designed and performed the experiments, analysed the data and wrote the manuscript. M.M., M. P. and S.P collected embryos and performed in situ hybridizations. KS performed immunostaining and 3D reconstructions. Models and code for cusp patterning were developed and refined by L.G, and models of temporal expression were initiated by P.V. All authors read and commented on the manuscript.
DECLARATION OF INTEREST
The authors declare no competing interests.
METHODS
Data analysis
R scripts corresponding to the main methods and processed data are available on GitHub (https://github.com/msemon/DriftHamsterMouse) and in zenodo (doi:XX).
Rodent breeding and embryo sampling
CD1 (ICR) adult mice and RjHan:AURA adult hamsters were purchased from Charles River and Janvier (France) respectively. Females were mated overnight and the noon after morning detection of a vaginal plug or sperm, respectively, was indicated as ED0.5. Other breeding pairs were kept in a light-dark reversed cycle (12:00 midnight), so that the next day at 16:00 was considered as ED1.0.
The Bmpertm1Emdr strain (Zakin et al., 2008) was kept in a C57/BL6N background by crossing heterozygotes with wild types, as homozygotes die at birth. To avoid suffering at birth, we generated homozygotes and wild type samples for X-ray by crossing heterozygotes and sacrificing pregnant mice at 19.5 days (1 day before delivery). Pregnant mouse females were killed by cervical dislocation. Hamster females were deeply anaesthetised with a ketamine-xylasine mix administered intraperitoneally before being killed with pentobarbital administered intracardially. All embryos were harvested on cooled Hank’s or DMEM advanced medium, weighted as described in (Peterka et al., 2002) and immediately decapitated.
This study was performed in strict accordance with the European guidelines 2010/63/UE and was approved by the Animal Experimentation Ethics Committee CECCAPP (Lyon, France, APAFIS#27308-2020092210045896 v1).
Estimating embryonic age from embryo weight
Embryo weight is well correlated with developmental age, allowing us to use it as a proxy in mouse and hamster, following (Pantalacci et al., 2009). We fitted age of development according to weight (in mg) for hamster and mouse data separately, based on 1047 mouse embryos and 636 hamster embryos respectively. We fitted generalised additive models (GAM) to the data after Box-Cox transformation of weight (libraries mgv version 1.8-35 for GAM and MASS 7.3-53.1 for Box-Cox). These models were prefered to log transformations and linear models, because they allow to treat the data homogeneously between species, and because the relationship is not perfectly linear between weight and age (Figure S1). These models were then used to predict developmental age, based on weight, for all samples used in this study (RNA-seq analysis, cusp patterning analysis, and in situ hybridizations for several genes).
Epithelium dissociations and in situ hybridizations
Complete or hemi mandibles and maxillae were dissected in Hank’s medium and treated with Dispase (Roche) 10mg/ml in Hepes/KOH 50mM ph7.7; NaCl 150 mM at 37 °C for 30 min to 1h depending on embryonic stage. Epithelium and mesenchyme were carefully separated and fixed overnight in PFA 4% at 4 °C. DIG RNA antisense mouse Fgf4, Shh, Fgf10 (Bellusci et al., 1997), Bmper/Cv2 probes were prepared from plasmids described elsewhere (Coffinier et al., 2002). Mouse Dkk1, Wif1, hamster Bmper probes, Mouse and hamster Bmp4 probes were newly cloned following RT-PCR or DNA synthesis (Table S1). In situ hybridizations were done according to a standard protocol (DIG mix, DIG antibody and BM purple were purchased from ROCHE). Photographs were taken on a Leica M205FA stereomicroscope with a Leica DFC450 digital camera (Wetzlar, Germany) or on a Zeiss LUMAR stereomicroscope with a CCD CoolSNAP camera (PLATIM, Lyon, France).
Immunolocalisation and 3D reconstructions
Tooth germs dissected from litter-mate embryos of RNA-seq samples were fixed overnight in PFA4% and dehydrated through a methanol series. In toto immunolocalization protocol was adapted from (Ahnfelt-Rønne et al., 2007). Following incubation in H202 5%, DMSO 10% in methanol for 4 hours, they were rehydrated, blocked and incubated successively with a pan-cytokeratin antibody (overnight,1/200, Novus Biologicals) and a Dylight 549 conjugated Donkey Anti-rabbit antibody (overnight 1/200, Jackson immunoresearch) and finally with Hoechst (overnight, 50μg/ml). Following methanol dehydration, they were clarified and mounted in BABB as described in (Yokomizo and Dzierzak, 2010). They were imaged with a Zeiss LSM710 confocal microscope at the PLATIM (Lyon, France). The outline of the epithelium labelled by the pan-cytokeratin antibody and the outline of the tooth germ labelled with hoechst were delineated manually and reconstructed in 3D in the AMIRA software.
X-ray scanning and 3D reconstruction of Bmper and wild type tooth shape at 19.5 days
We obtained 14 homozygote (Ho) and 19 wild type (Wt) samples from a total of 14 different 19.5 dpc litters, out of which we selected for reconstruction of the first molar morphology 7 Ho and 4 Wt with matching body weights (homozygotes: 1174-1329 mg; wt: 1227-1310 mg). At 19.5 dpc, female embryos are more developmentally advanced than male embryos of a similar weight, therefore sex was also recorded. This was necessary to control for differences in growth advancement, since we anticipated (and confirmed) that supplementary cusps are still growing rapidly at this stage, due to their late formation. Heads freed of skin were fixed in PFA, dehydrated in ethanol, stained with 0,3% PTA in 70% ethanol for 2 weeks-1 month and scanned at 40kV on a Phoenix Nanotom S microtomography for a voxel size of 4 µm. Semi-automatic reconstruction of the enamel-dentin junction was performed with ITK-snap. Reconstructions were oriented for comparison in MeshLab 2021.05. Due to variations in staining efficiency and advancement of mineralization, only a total of 4 Ho and 4 Wt upper molars and 3 Ho and 4 Wt lower molars were finally successfully reconstructed and considered to be directly comparable. The aberrant upper molar morphology was obvious on microCT sections in 7/7 samples. The loss of one cusp was observed in 4 Ho/4 3D reconstructions. The larger lingual cusps were observed in all Ho 3D reconstructions when paired with a wt of corresponding age. This (as well as cusp loss) was also confirmed by comparing epithelial dissociations of Bmper Ho and Wt embryos at 19.5 dpc.
Modelling and comparing cusp patterning dynamics
To compare the dynamic of crown morphogenesis in four teeth (lower and upper molars in hamster and mouse) we need to establish the sequence of primary and secondary signalling centres formation (respectively, PEK and SEK). In mouse, this could be done with time lapse imaging of fluorescent lines (Harjunmaa et al., 2014). To integrate non-model species like hamster, we had to set up a new method that infers the dynamic based on fixed embryos. We hybridised developing molars against a Fgf4 probe to reveal PEK and SEKs. The patterns we observed among samples are consistent with a stereotypic and specific sequence of SEK patterning in each tooth and species (Figure 1B, schemas on the sides). We name each stage by the number of signalling centres (PEK stage then 1-SEK stage, 2-SEK stage etc).
Cusp patterning can be seen as a succession of irreversible stages representing step-wise cusp additions. Transition rates between these stages were modelled through continuous time Markov modelling as in (Pantalacci et al., 2017). The rationale is that if sampling is uniform over the time course of tooth morphogenesis, stages that are rarely sampled are very transient (with high exit rate), while stages that are often sampled last for a longer period of time. In continuous Markov models, the duration of each state follows an exponential distribution, which is not realistic for the stage lengths. So, to have a more realistic stage length distribution, each stage was modelled by several consecutive states, so that its length followed an Erlang distribution, which has a mode different from zero. We built independent models for each species and tooth types. Models are estimated on 121 embryos for the hamster lower molars, 113 for hamster upper, 217 for mouse lower, 187 for mouse upper.
We estimated the duration of each stage in a complete model, with different transition rates for all stages. We also fitted several simpler, nested models, with constraints on the number of different transition rates, up to the most simple model with the same transition rate for all stages. We retained models with three different rates in mouse, and two different rates in hamster, by comparing the fit of the models by likelihood ratio tests in each tooth. Markov models were built by custom scripts calling on R libraries maxLik and expm (maxLik_1.4-8 and expm_0.999-6).
RNA-seq sample preparation
A total of 32 samples per species, coming from eight individuals, were prepared for the time serie RNA-seq analysis, representing consecutive stages in mouse (ED14.5, 15.0, 15.5, 16.0, 16.5, 17.0, 17.5, 18.0) and nine stages in hamster (ED11.8, 12.0, 12.2, 12.5, 13.0, 13.25, 13.5, 13.75, 14.0). Each sample contained two whole tooth germs, the left and right first molars (M1) of the same female individual, and for a given stage, the upper and lower samples came from the same individual. Harvesting and dissection were performed in a minimal amount of time in advanced DMEM medium. The M1 lower and upper germs were dissected under a stereomicroscope and stored in 200 uL of RNA later (SIGMA). Similarly dissected tooth germs from the same litter and same weight were fixed overnight in PFA 4% for immunolocalization and 3D reconstruction (see later). Another embryo of the same litter and same weight was processed as indicated above for Fgf4 in situ hybridization. Total RNA was prepared using the RNeasy micro kit from QIAGEN following lysis with a Precellys homogenizer. RNA integrity was controlled on a Bioanalyzer (Agilent Technologies, a RIN of 10 was reached for all samples used in this study). PolyA+ libraries of the large-scale dataset were prepared with the Truseq V2 kit (Illumina, non stranded protocol), starting with 150 ng total RNA and reducing the amplification step to only 12 cycles and sequenced on an Illumina Hi-seq2000 sequencer (100 bp paired end reads) at the GENOSCOPE (Evry, France).
For the bucco-lingual dataset, we dissected the 4 first molars (left/right, lower/upper) from a unique mouse E15.0 embryo (weight: 359 mg) as above, except that tooth germs were cut in two halves to isolate buccal and lingual side. Replicates were thus obtained by comparing the right and left side of this same embryo. Total RNAs were extracted and libraries were prepared as above, starting with 50-70 ng total RNAs, where an equal amount of AmbionR ERCC RNA Spike-In Mix1 had been added according to the AmbionR protocol (e.g. 1μL og a 1 :1000 dilution for each tube). A total of 8 libraries were sequenced (50bp single-end reads) by the Genomeast Sequencing platform, a member of the France Genomique program.
For the epithelium-mesenchyme dataset, lower and upper mouse and hamster first molars were dissected as above and treated for 15 minutes at 37°C with Dispase (Roche) 10mg/ml in Hepes/KOH 50mM ph7.7 ; NaCl 150 mM to separate the epithelial from mesenchymal parts which were stored in RNAlater. For the mouse data, we generated samples for 2 stages in 2 replicates, using embryos from the same litter (stage 15.0 dpc, weight: 350 and 370 mg; stage 16.5 dpc: weight: 788 and 808 mg). Left and right epithelium or mesenchyme were pooled. For the hamster data, we generated samples for a single stage without replication. We pooled the left epithelial or mesenchymal parts from 2 embryos from the same 12.5 dpc litter (413 and 427mg). A total of respectively 16 and 4 libraries were generated with Truseq V2 kit and sequenced (50bp single-end reads) by the Genomeast Sequencing platform.
Expression levels estimation using RNA-seq and differential expression analysis
For the whole tooth germ data (64 samples) we obtained 100 bp paired-end sequences, with on average 46.2M (millions) reads per sample. For epithelium/mesenchyme and bucco/lingual data (respectively 20 and 8 samples), we obtained 50 bp single-end sequences, with on average 93.7M and 48.6M reads per sample respectively. Raw data are available in the gene expression omnibus repository (GSE76316 for a first replicate in mouse, and XX for the rest of the data).
These reads were mapped by using Kallisto (version 0.44.0, (Bray et al., 2016)) to custom reference sequences for hamster and mouse transcriptomes. To generate them, we retrieved mouse and hamster cDNAs from Ensembl (release 93, July 2018, assemblies GRCm38.p6 and MesAur1.0 (Howe et al., 2021)), selected 14536 pairs of one-to-one orthologous transcripts, realigned pairs of sequences with Macse (macse_v2.01, (Ranwez et al., 2011)) and cropped the alignments to get orthologous segments by using custom scripts to make expression levels comparable between species.
Differential gene expression analysis (DE analysis) was performed on smoothed expression profiles over developmental age. Developmental age was estimated with embryo weight (GAM models above) and stages were homologized based on morphological criteria at early cap stages and late bell stage (14.5/18.0 days in mouse; 12.2/14.5 days in hamster). These boundaries, confirmed by PCA analysis of the transcriptome data (Figures 1 and S1) were used to convert days of development into relative development age (0-10).
Expression profiles were fitted by third degree polynomial splines with 2 interior knots, for each tooth and species (bs function of spline R package (Wang and Yan, 2021), independently or jointly within tooth and/or species, as explained below. Nested models were tested by DEseq2 (Love et al., 2014) and the best model was chosen for each gene by comparing the fit of these nested models (FDR adjusted p-value < 0.05 from DESeq2 LRT tests). When we compared temporal profiles between species, we accounted for the average level of expression in each species. This is to focus on changes in regulation over development, and to discard potential remaining artefacts in species-specific quantifications. Several tests were performed and are described below with the corresponding figure number.
Selection of the temporal expression profile in the 4 tooth types was done as follows (related to Figure 1D). The “simple” model fits a single curve for the four time series. The “complex” model fits 4 different curves, one per tooth type. The “hamster/mouse” model has 2 different curves, one per species. The “upper/lower” model has one curve per tooth, including the species-specific offset. The best model was selected for each gene by using a bottom-up approach with the results of four independent tests: t1 compares “hamster/mouse”versus simple model; t2: “upper/lower” versus simple; t3: complex vs “upper/lower”; t4: complex vs “hamster/mouse”. If t1 and t2 are not significant, then the simple model is chosen. If t1 is significant and not t2, the gene is assigned to: “hamster/mouse”. If t2 but not t1: “upper/lower”. Finally, if “lower/upper” or “hamster/mouse” and t4: complex.
From this selection procedure, percentage of coevolution among genes was computed as the proportion of selected “hamster/mouse” models among the selected models as follows (related to Figure 3C): “hamster/mouse”/(“hamster/mouse”+“upper/lower”+“complex”).
To model temporal expression profiles in the 4 tooth types with tooth-specificity in one species (related to Figure 2C), the four time series were modelled as in the “hamster/mouse”, plus “mouse tooth-specific” and “hamster tooth-specific” models, which correspond to distinct curves for upper and lower molars in one species, but not in the other. Genes were selected by comparison with the “hamster/mouse” model above.
To model temporal expression profile in each tooth type separately (Related to Figure 3A-B,D-E), we compared a “non-divergent” model with a single curve to fit both time series (with a species-specific offset to only consider the temporal dynamic), to a “divergent” model with one specific curve per species (with a species-specific offset).
Similarly, to model temporal expression profiles in each species separately (Related to Figure 6), we compared a “simple” model with a single curve for both time series to a “complex” model with one specific curve per tooth. This procedure does not directly provide the sense of the bias. To estimate it in each species, we computed the values predicted by the upper and lower models for 100 equally distributed points (i) on the timeline, and measured the distance point by point as follows : sum((up(i)-low(i))/(up(i)+low(i)). This measure evaluates whether overall, expression levels in upper molar are above or below lower molar’s.
We then computed the intersection of the results with several lists of genes important for tooth development: 259 genes from the bite-it database (retrieved in July 2019), 187 genes with a phenotype in tooth development (100 “dispensable” genes, 87 “keystone” genes, (Hallikas et al., 2021)), and 295 genes belonging to 8 pathways active in tooth development (17 genes in ACTIVIN pathway, 81 in BMP, 10 in EDA, 69 in FGF, 32 in SHH, 9 in NOTCH, 11 in TGFB, 96 in WNT, courtesy Jukka Jernvall).
Pathway activation
ROMA was used to quantify activation of WNT, BMP and SHH pathways in the bucco-lingual samples (version rRoma_0.0.4.2000, https://github.com/Albluca/rRoma and (Martignetti et al., 2016)). Genes for the SHH modules were retrieved from GSEA ((Mootha et al., 2003), 41 genes present in our dataset). Gene lists for the BMP and WNT modules were adapted from a first molar “regulatory evidence” dataset (O’Connell et al., 2012). Building on literature and their own transcriptomic analysis, the authors had defined target genes based on their up or downregulation following activation or inactivation of each pathway. For data consistency, we selected only targets established in the study from transcriptome analysis, in 13.5 and 14.5 dpc epithelium and 10.5 dpc mesenchyme. Different modules were built for activities in the mesenchyme and epithelium compartments. For BMP in the mesenchyme, we considered 15 genes as positive targets and 4 as negative targets (further noted 15:4). In the epithelium, the numbers of positive:negative targets were respectively 32:34. For WNT, we built modules with 4:31 positive:negative targets in the mesenchyme, and 33:45 in the epithelium.
Multivariate analyses
Multivariate analyses were performed using the ade4 package (ade4_1.7-18; (Dray and Dufour, 2007)). We performed principal component analyses on normalised counts (DESeq basemeans), and between groups analyses on the resulting components, which allowed us to quantify the proportion of variance associated with each factor.
We used RAPToR (RAPToR_1.1.4, (Bulteau and Francesconi, 2021)) to estimate the offset between upper and lower molar development. We staged upper molar samples on reference made from lower molar samples conjointly for both species. Interpolations were done with gam models fit on 5 components of an ICA.
Gene Ontology analysis
Gene ontology (GO) analysis was performed and visualised with gprofiler2 (gprofiler2_0.2.0, (Kolberg et al., 2020)), clusterProfiler (clusterProfiler_3.18.1, (Wu et al., 2021)), and simplifyGO (simplifyEnrichment_1.2.0 (Gu and Hübschmann, 2021)) using the full list of genes expressed in the corresponding dataset as a background.
Estimating tissue proportions from RNA-seq data by deconvolutions
We used the R package DeconRNASeq (DeconRNASeq_1.32.0 (Gong and Szustakowski, 2013)) to estimate the relative proportions of epithelium and mesenchyme compartments in bulk tooth germ transcriptomes. We defined lists of marker genes for each compartment by pairwise differential analysis of tissue-specific transcriptomes (DESeq2, log2 fold change > 3, adjusted p-value < 0.05). We used 1025 mesenchyme and 621 epithelium marker genes found by comparing 10 epithelium and 10 mesenchyme RNAseq samples, mixing tooth, stages and species. We estimated the accuracy of the prediction by bootstrapping 1000 times the marker lists. The relative proportions of buccal and lingual compartments was inferred by a similar procedure. We used 414 buccal and 235 lingual marker genes, from the differential analysis of 8 samples (DESeq2, log2 fold change > 1, adjusted p-value < 0.05).
SUPPLEMENTARY FIGURES
ACKNOWLEDGEMENTS
We acknowledge the contribution of the Plateau de Biologie Expérimentale de la Souris (PBES) and the Plateau Technique Imagerie/Microscopie (PLATIM) of SFR Biosciences Gerland-Lyon Sud (UMS344/US8), as well as the computer ressources from PSMN (ENS Lyon).
We acknowledge the technical help of Anne Lambert, Alain Rubod, Mathilde Estevez-Villar, Claudine Corneloup and the contribution of many students including Coraline Petit, Alice Lorenc, Margaux Pillon, Ludivine Rotard and Asma Benahmed. We are grateful to several colleagues and their staff for sending plasmid probes: Irma Thesleff (Fgf4), Hiko Ogura (Cv2/Bmper), D. Duboule (Fgf10). We are grateful to Pamela Lockyer, Cam Patterson and Xinchun Pi for collecting our very first Bmper embryos. We are grateful to Jennifer Esser for kindly providing the Bmper strain and advice on genotyping. This work was supported by the Agence Nationale pour la Recherche (ANR 2011 JSV6 00501 “Convergdent”), and a grant from the GENOSCOPE - Centre National de Séquençage. Salaries were supported by the Centre National de la Recherche Scientifique, the Ecole Normale Supérieure de Lyon and the Université de Lyon, Université Lyon 1.
REFERENCES


