

Abstract
Habitat loss is a leading cause of species declines worldwide (1, 2). Using the Land Use Harmonization dataset (3) as the basis for ecological niche modelling, we quantify modelled changes in global suitable habitat over the past three centuries for Asian elephants, a megaherbivore representing diverse biomes. Between 1700-2015 over 60% of habitat suitable for elephants was lost, while average patch size declined 84-86%, and the largest patch decreased from 45% to 5%. Over half of the currently inhabited range is considered unsuitable for elephants, whereas suitable habitat is predicted to decline further from 2015-2099 across all six scenarios representing a range of emissions pathways and socioeconomic narratives. However, results vary by region and scenario in a non-linear manner, indicating that socioeconomic outcomes are as important as emissions pathways for the future of these habitats. Lao PDR, Thailand and Myanmar currently have lower elephant populations relative to the amount of available habitat. On the other hand, continued losses in densely settled areas such as India and Sri Lanka are expected to exacerbate human-elephant conflict. Only a few regions, notably peninsular Malaysia, Borneo, and Yunnan province, China, are predicted to have potential for habitat recovery. The most catastrophic losses across all range states occurred under a scenario of mid-range emissions but high regional inequities, leading to overexploitation of critical habitats. We conclude that steps to mitigate climate change must be taken alongside measures to ensure inter-regional social equity in order to safeguard these landscapes for elephants, humans and other species.
Significance Human land-use change is a leading driver of biodiversity loss, but effects are difficult to quantify over centennial timescales. Asian elephants occupy diverse biomes that have long been impacted by human activities and are thus indicative of the fates of numerous co-existing species. Over 60% of suitable elephant habitat has been lost since the 1700s and over half of the currently inhabited range may be considered unsuitable. Declines are predicted to continue to 2099 under six scenarios of global change across the majority of elephant range states, with the worst losses corresponding to a scenario representing mid-range emissions but high global inequity. Thus climate change mitigation strategies must include measures to facilitate equitable societies to safeguard and recover elephant landscapes, together with the unique biodiversity they represent.
Introduction
Habitat loss and degradation are leading drivers of terrestrial biodiversity loss worldwide (1, 4). An estimated three quarters of the land surface has been significantly altered by human activities (5). Historic reasons for this include conversion for cultivation and settlement, reflecting both local and global socioeconomic forces that drive land-use and land-cover (LULC) changes (6, 7). Climate change has emerged as an additional important contributor to species declines within the past century (5). As a result of these human-induced global changes, about 52 species of birds, mammals and amphibians are moving one category closer to extinction each year on the IUCN Red List (8). Climate change and LULC interact via economic systems as well as natural processes such as carbon cycling (7). It is not a given that efforts to address climate change will also conserve species and habitats, because these are distinct concerns. Both must be addressed within inter-linked socioeconomic and ecological systems in which there may be inherent trade-offs. Indeed, simultaneously achieving both goals is among the greatest challenges of our time.
Humans impact biodiversity at different time scales. Our activities can alter landscapes quickly, and these changes may continue to have prolonged impacts that are not immediately evident. Abundant research shows that human-induced changes have already restricted the home ranges for many terrestrial mammal species (4, 9–11). However, historical records on population abundance and distribution are often limited for many taxa, complicating efforts to determine these impacts over longer periods. Putative trends in more recent decades may be inferred from changes in land-cover types or biomes (e.g. deforestation, (12)), but even these fail to quantify LULC processes operating over many centuries. Nevertheless, such historical perspectives are necessary to provide broader context for understanding the present-day status of wildlife populations.
In the future, land use practices as well as climate change will continue to alter ecosystem structure and function over long time scales, resulting in alterations to the availability of habitat for many species (2). Wide-ranging species cannot be conserved solely within existing or planned protected area networks (2, 4), a difficulty compounded by human-induced global changes. The survival of these species will depend not only on reducing proximate threats from illegal hunting and sufficient protection of extant range, but on preparing for possible range shifts and their associated challenges under scenarios of global change. Typically, this is achieved through ecological niche modelling (c.f. species distribution modelling) in which one uses present-day species occurrence data, together with covariates at each location, to infer possible occurrence or suitable habitat at a different area or time (13). Often, modelled climate variables form the basis of forward-looking scenarios. However, climatic variables only indirectly influence the occurrence of many terrestrial species whereas LULC features place direct constraints on habitat availability. Moreover, social and economic systems can be expected to evolve along with physical changes in the climate and biosphere (14). Therefore, scenarios of the future must take into consideration not only possible global emissions outcomes, but also the corresponding LULC and socioeconomic pathways taken to reach those outcomes.
We model the historic range and possible shifts in suitable habitat for a widely-dispersed endangered mammal, the Asian elephant (Elephas maximus). Asia, Earth’s most densely populated yet biodiverse continent, contains several hotspots of species decline and threatened megafauna (9). We focus on Asian elephants because they occupy diverse ecosystems ranging from rainforests to grasslands; therefore, shifts in suitable habitat signify changes for many diverse ecosystem types rather than particular biomes (15). For example, the known distribution of Asian elephants (Figure 1) is one of several features used to identify landscapes in Asia to target for conservation investments by the European Union (EU, 2018). Moreover, elephants are not only ecosystem engineers that uniquely influence the structure of natural ecosystems (16, 17), they also exemplify the mutual challenges for people and wildlife at frontiers of land-use change as evidenced by so-called human-elephant conflict (18).
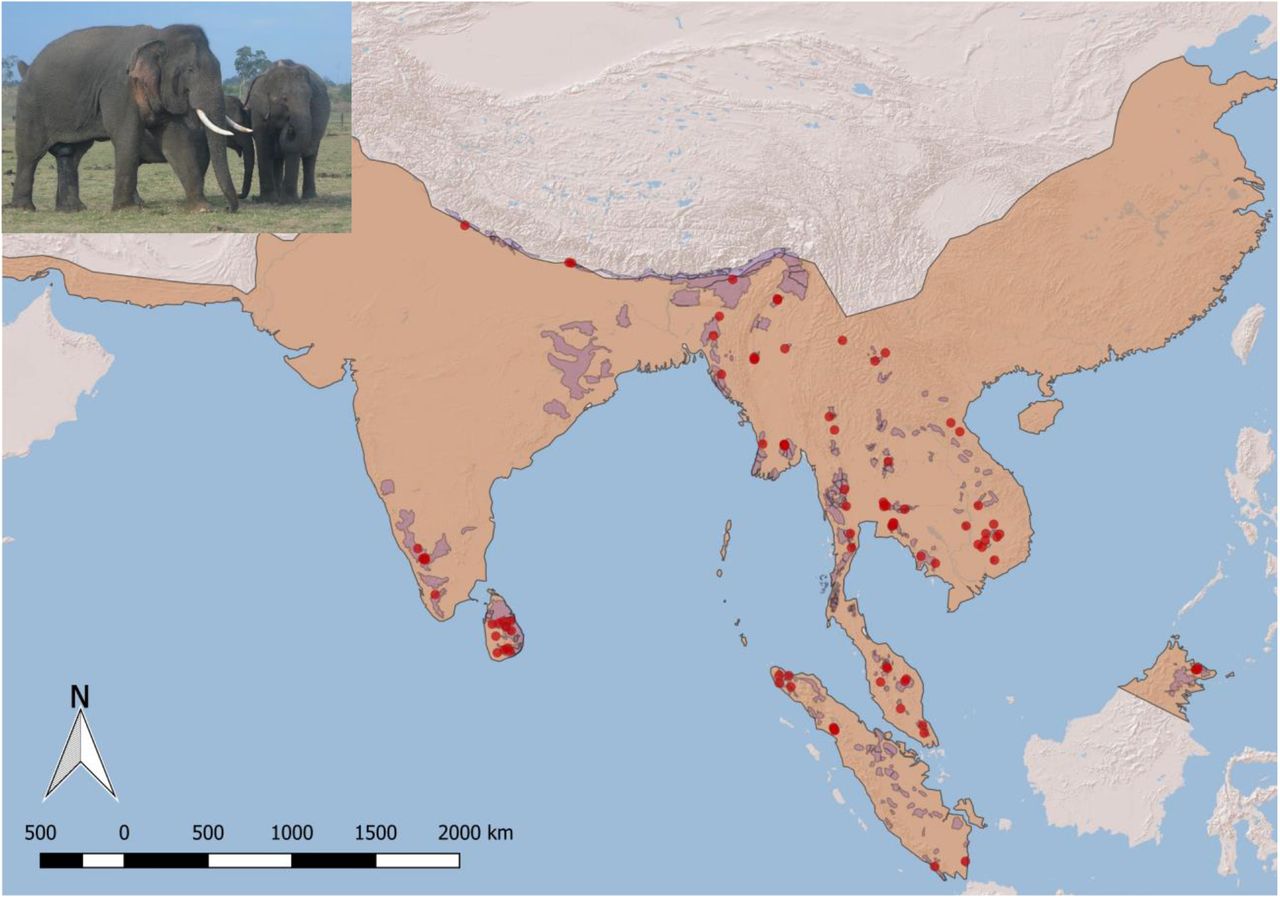
Brown shaded region shows presumed historic post-glacial range (Olivier 1978), smaller polygons show current known range (Hedges et al. 2008), points show sampled locations.
To establish a benchmark, we first model habitat suitability using features such as climate, terrain, human and livestock densities that might be expected to directly influence present-day elephant distributions, based on knowledge of the species’ ecology (19–21). We compare results to the most recent map of areas where elephants are known to be present (22) as well as predictions based on the Land-Use Harmonization (LUH) data products (3, 23). The LUH datasets provide historical reconstructions of land-use and management between 850-2015, at annual increments. They also contain six modelled scenarios from 2016-2100 representing combinations of a subset of Representative Concentration Pathways (RCPs) (24) and Shared Socioeconomic Pathways (SSPs) (14, 25). These datasets therefore link historic and future land use patterns with a consistent set of variables, and relate the socioeconomic dimensions of LULC with possible emissions outcomes (Table 1). We use the LUH variables to model potential past and future habitat for elephants.
RCP number denotes the radiative forcing target in W/m2 achieved by a given pathway at stabilization after the year 2100. The SSPs are summarized in terms of narrative storylines that describe the socioeconomic processes operating in the modelled hypothetical societies. See references (14, 24, 32) for more complete descriptions.
We quantify historical trends in suitable habitat and fragmentation patterns over the whole range and by country. Under the naïve assumption that climate trends are the critical determinant of habitat loss for this species, one would expect a simple decrease in suitable habitat with increased emissions. Yet if other factors, namely socioeconomic considerations, have more influence on land use trends, there would be no such pattern. We provide comparisons among different range states to highlight areas of concern as well as opportunity. We find that socioeconomic context is at least as important as emissions trajectories in influencing the fates of these diverse ecosystems.
Methods
Elephant occurrence
Polygons representing known range were digitized from Hedges et al. 2008 (22) as a reference for sampling. We henceforth refer to the area within these polygons as “inhabited range” and avoid the term “occupied” so as to avoid confusion with occupancy modeling. Elephant occurrence locations were contributed by the authors based on direct sightings, data logged via tracking devices, and camera traps. Additional locations were compiled from the Global Biodiversity Information Facility (https://www.gbif.org/), Movebank (https://www.movebank.org/) and published literature (26–28). We included only locations representing natural habitat (including logged forest), but not monoculture plantations or mixed-use landscapes, because even if such landscapes currently appear capable of supporting elephants, populations may be subject to chronic negative impacts (29, 30). Records were checked visually for errors (e.g. occurrences outside natural continental range). To minimize sampling bias that could result in model overfitting, we subsampled data to cover the known global distribution as widely as possible and eliminated redundant points located within any particular landscape. For instance, only one randomly selected data point per individual, per population, was used from any tracking dataset. Outliers from this set were removed using Crooks’ distance to eliminate locations that represent potential errors. The final dataset consisted of 91 occurrence points spanning the years 1996-2015 which served as training data (Figure 1). QGIS and Google Earth Pro were used to visualize and consolidate these data.
Predictor variables
We used 12 environmental variables, referred to as the benchmark variables (Table S1), as predictors for modeling current elephant distribution on the basis of their known ecology (19–21, 31). Datasets were resampled to match the variable with the coarsest resolution (0.5 Deg). The LUH data products were downloaded from the University of Maryland at http://luh.umd.edu/data.shtml (LUHv2h “baseline” scenario released October 14th 2016 and LUHv2f released December 12 2017). They consist of three types of variables gridded at 0.25°x0.25° (approximately 30km2 at the equator): state variables describing the land use of a grid cell for a given year; transition variables describing the changes in a grid cell from one year to the next; and management variables that describe the agricultural applications such as irrigation and fertilizer use, for a total of 46 variables. We selected 20 variables corresponding to all three types, referred to as the LUH variables (Table S2), which are expected to be relevant to elephant habitat utilization. Using ESRI ArcMap (ESRI 2017) we extracted them for each year of interest (1700, 1800, 1900, 2000, 2015 from LUHv2h and from 2015-2085 at ten year intervals plus the year 2099 for all six scenarios in LUHv2f). We used 2099 rather than 2100 because variables representing land-use transitions, such as wood harvest rates, were not available for 2100.
We used all six available LUH future scenarios. The six RCP-SSP pairings of the LUH datasets (Table 1) do not include the entire space of combinations because not all outcomes are possible (e.g. scenarios with high barriers to mitigation and adaptation are unlikely to achieve low-emission targets whereas those with the opposite are may not exhibit high-emissions) (25). These scenarios therefore only represent a cross section of futures that may occur when specific socioeconomic conditions place differential constraints on efforts to mitigate or adapt to climate change (14, 24, 32), not a full factorial design.
Data analysis
We used MAXENT, a maximum entropy algorithm (33), to separately model habitat suitability for elephants using either the benchmark variables or the LUH variables along with elevation. These are referred to as the benchmark model and LUH model, respectively. For the LUH variables we used the year 2000 for model construction because it is near the midpoint of the timeframe over which elephant occurrence data were available. The LUH model was then applied to all prior and future years to generate predictions of habitat suitability. Analyses were performed using the ‘dismo’ package in R (R Core Team 2017).
Raster files were binarized in ArcMap into suitable and unsuitable habitat at a pixel size of approximately 20km2, with a cutoff threshold corresponding to ‘maximum training sensitivity plus specificity’. For the benchmark model this value was 0.350, for the LUH model it was 0.284; everything below the threshold was thus classified as ‘unsuitable’ while everything above was classified as ‘suitable’ for subsequent analyses. As there is no commonly accepted threshold, to ensure that the specific choice of threshold did not affect the historic trends in suitable habitat, for the LUH datasets we also repeated analyses with alternately lower and higher thresholds (0.237, representing ‘maximum test sensitivity plus specificity,’ and 0.331 representing ‘10th percentile training presence’). The binarized maps were reprojected using the WGS84 datum and an Albers Equal Area Conic projection.
For each time point, we compared the total area of the habitat classified as suitable within and outside the known elephant range (referred to as “inhabited suitable” or “uninhabited suitable”, respectively) for each range state as well as Borneo and Sumatra. We ranked each region based on the proportion of the elephant population found within the region as well as the percentage of active range within the region, and calculated the ratio of these ranks (Table 3). Country-level analyses were compared for all range states except China, Indonesia and Malaysia. Analyses for China were restricted Yunnan province, where elephants are currently confined. For Indonesia we distinguish between Sumatran and Bornean ranges, in recognition of the distinct subspecies in these two regions (31). Likewise, for Malaysia we distinguished between peninsular and Bornean populations. For all regions we calculated the historic change in suitable habitat by subtracting the total area classified as suitable in the year 2000 from that of the year 1700. Likewise, we calculated the net change in projected suitable area between 2000 and 2099 across all six scenarios, differentiating between inhabited and uninhabited range.
We calculated fragmentation statistics for all LUH-based predictions (historical as well as future scenarios) within the program FRAGSTATS (v.4.2), using a ‘no sampling’ strategy (35). For the Proximity Index and Connectance Index, the search radius and threshold distance, respectively, were set to 61 km (approximately three pixel lengths) based on the movement and dispersal capacity of elephants (36–38).
Results
Present-day suitability vs. distribution
We first compare predictions of habitat suitability under the benchmark model to those under the LUH model (Figure 2, Table 2). After binarization, datasets were in agreement for 80% of pixels overall (>7 × 10⁶ km2) and 89% of pixels within the current elephant range. They were in agreement for over 90% of area for 8 out of 13 countries (Figure S1). Cambodia, Indonesia, Malaysia, Sri Lanka and Thailand had lower levels of agreement. The lowest agreement occurred for Indonesia (36.2 %) and Malaysia (36.8 %). Areas of disagreement tended to occur at intermediate values, i.e., at the transition zones from suitable to unsuitable, reflecting loss of information in converting from graded to binary outputs. Slightly more pixels were classified as “suitable” under the benchmark model relative to the LUH model (Figure 2D), thus the latter was more conservative. Nevertheless, given the high levels of agreement, we consider the LUH model reliable.
See supplementary tables S1 and S2 for complete lists of variables.

In (A) and (B) blue represents less suitable areas whereas yellow represents more suitable areas. C) 1=Pixel classified as unsuitable under both models; 2=Pixel classified as suitable under benchmark model and unsuitable under LUH model; 3=Pixel classified as unsuitable under benchmark model and suitable under LUH; 4=Pixel classified as suitable under both models. D) Histogram of pixel classifications in (C).
Under the LUH model, 48.5% of the known present-day range consisted of suitable habitat for elephants in 2015. India has the largest population, given that it also has the largest share of the known elephant range, but only about a third of this range was classified as suitable habitat by the year 2015 (Table 3). Sri Lanka and Malaysian Borneo appear to have more than twice as many elephants as expected relative to their share of global range, with 62% and 95% respectively classified as being suitable. Thailand and Myanmar have much lower populations than expected based on their share of known range, despite approximately 60% and 51% of these ranges respectively being classified as suitable. Although elephants are in imminent danger of extirpation in Vietnam, much of the remaining range (98%) is classified as suitable.
“Total inhabited” refers to the extent of range in which elephants were thought to be present in the 2000s. “Inhabited suitable 2015” refers to the amount of this known range still classified as suitable habitat by the year 2015 under the LUH model. Ranges are ranked by the percentage of the global elephant population found within them as well as the percentage of global range they encompass. The rank ratio is the area rank divided by the population rank, thus a ratio close to 1 indicates population size is proportional to the amount of area within that range. Higher ratios indicate populations larger than expected on the basis of available range, lower ratios the opposite.
Areas are in km2, ordered from ranges that experienced the greatest loss to those with the greatest gain in total suitable area. “Inhabited suitable area” refers to the areas known to still contain elephants by the year 2000, whereas “Potential suitable area” refers to area that is outside the current range, where it is unknown whether elephants were ever present. “%” denotes the percent change from 1700-2015.
Historical change
Current elephant range represents a restricted subset the range they likely occupied at the end of the last ice age (Figure 1), based on limited historical and anecdotal accounts (20, 39). Between 1700 and 2015 the amount of habitat classified as ‘suitable’ declined by 61-65%, the average patch size decreased by 84-86%, the amount of total area occupied by the largest patch fell from 45% to 5%, and landscape contagion more than doubled (Figures 3 and S2). Yunnan China, India, Bangladesh, Thailand, Vietnam and Sumatra each lost more than half their suitable range (Table 3). Yunnan lost 94% and India lost 86%, respectively. Bhutan, Nepal and Sri Lanka lost more suitable habitat inside their current elephant range than outside it. On the other hand, trends in Laos and Malaysia show a net gain but not necessarily in areas that are currently inhabited. The Bornean range suggests a restructuring of habitat rather than absolute decline. Indonesian Borneo retained 100% of its already limited extant range.

A) Habitat suitability is predicted on the basis of elevation and the Land Use Harmonization (LUH) variables from the year 2000. B) Binarized map, 1 (yellow) indicates values above 0.284 deemed “suitable.” C) Loss of total area and overall reduction of patch size where each curve corresponds to a given threshold value (see methods).
Future scenarios
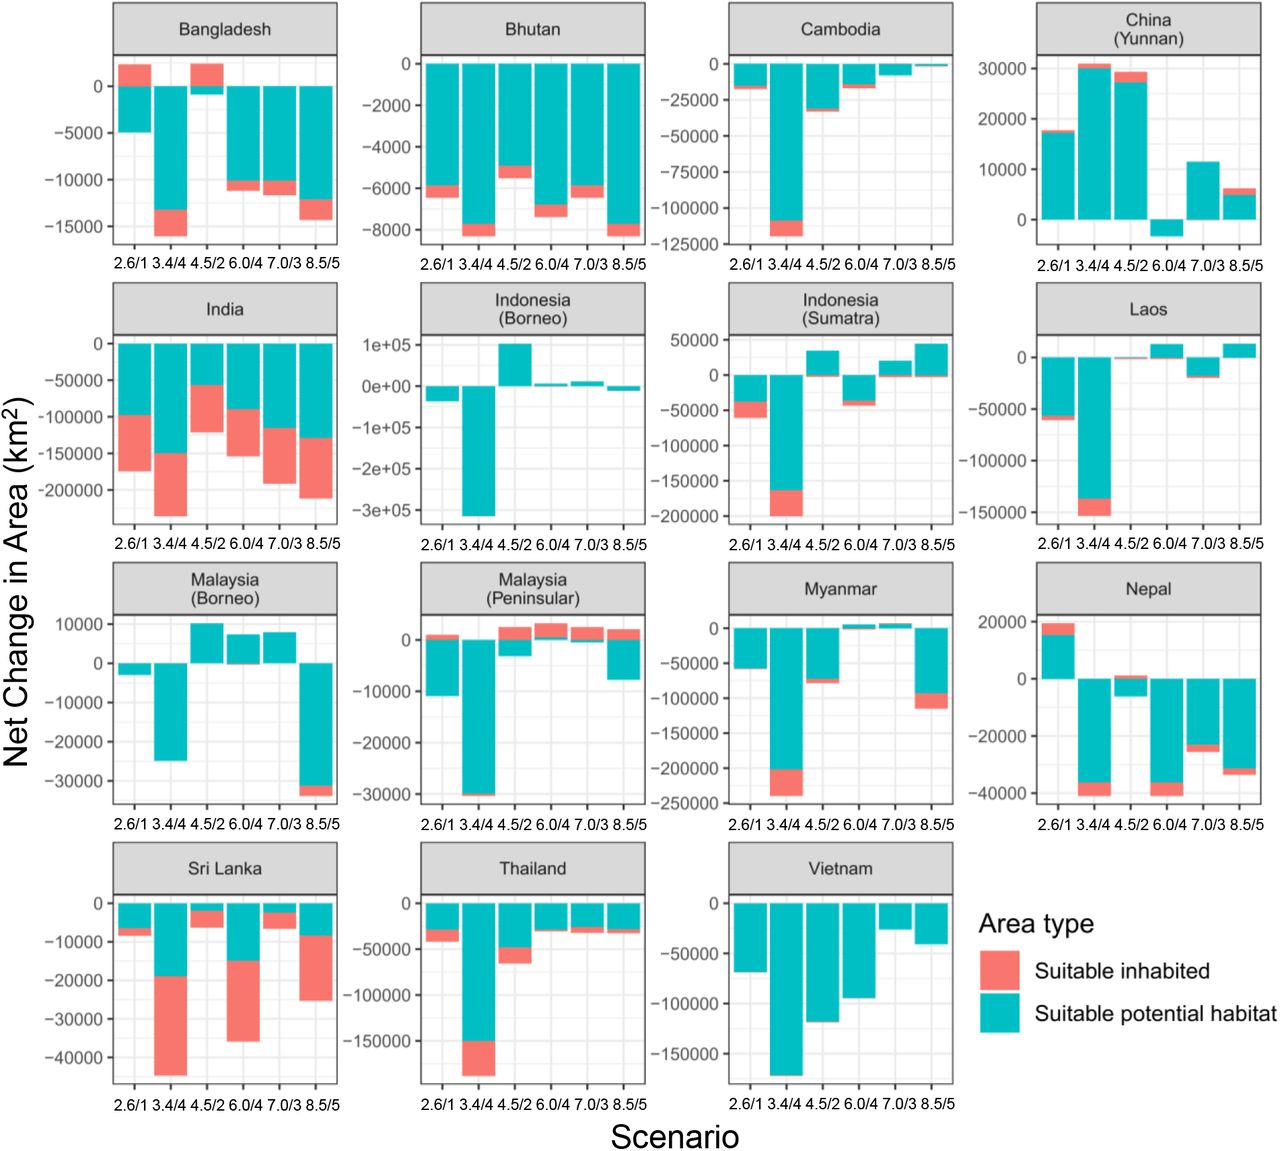
Suitable habitat is predicted to decline further by 2100 across all scenarios, but patterns varied by country and scenario (Figures 4 and 5). Most countries in the South Asian region are predicted to lose habitat across the majority of scenarios, with India expected to lose the greatest in absolute and relative terms (Figure 4). Declines are likewise expected for the majority of countries in Southeast Asia. On the other hand, habitat in both peninsular and Bornean Malaysia is predicted to recover. Peninsular Malaysia is projected to gain suitable habitat within the current range for all case, while the Bornean portion of the range shows potential for increase in three of six scenarios. Yunnan province, China, was another notable outlier in exhibiting potential habitat gains in five out of six scenarios, three of these more than doubling (Figures 4 and 5). Despite the overall losses experienced, all except scenario 3.4/4 show the amount of suitable habitat dropping to their lowest levels between 2020-2030, but stabilizing or at least partially recovering thereafter (Figure S3).

The term “inhabited” indicates area falling within the known distribution and “suitable” indicates pixel values above the threshold of 0.284 whereas “unsuitable” indicates habitats below it. Increase in the “inhabited suitable” category signifies area within the present range that was converted from unsuitable to suitable, whereas decrease signifies the reverse. These do not imply actual range expansion or contraction. “Suitable potential habitat” represents change in area outside the known range.
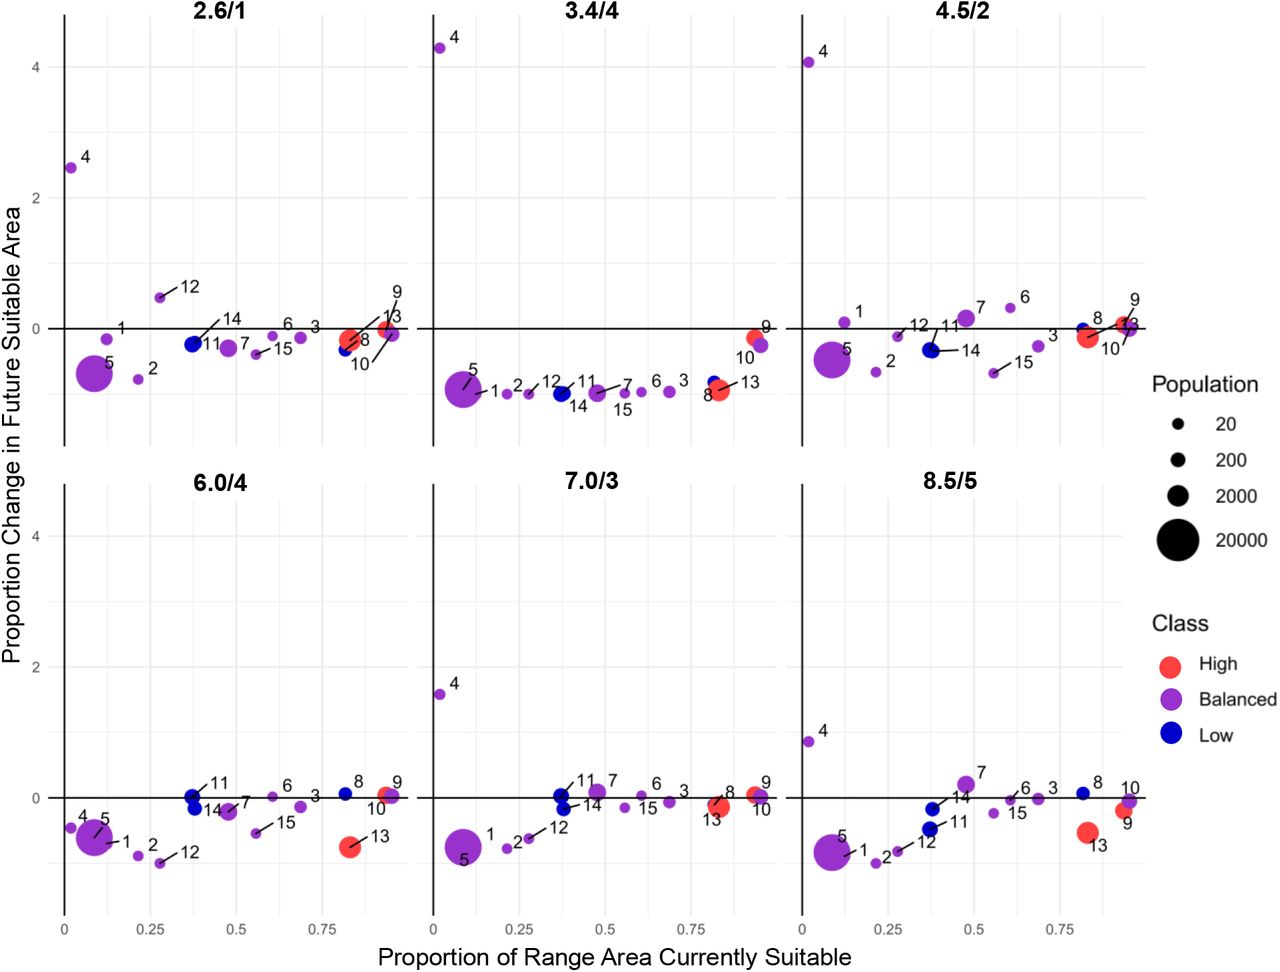
The x-axis shows the fraction of land area within each region that constitutes present-day elephant range, whereas the y-axis shows the ratio of change between 2015-2100. Bubbles are scaled relative to the elephant population size. Colors represent the size of the elephant population relative to available area, with “High” being a rank ratio >1.75, “Balanced” being a ratio of 0.76-1.75, and “Low” being a ratio of 0-0.75 (Table 3). 1 = Bangladesh; 2 = Bhutan; 3 = Cambodia; 4 = China (Yunnan); 5 = India; 6 = Indonesia (Borneo); 7 = Indonesia (Sumatra); 8 = Lao PDR; 9 = Malaysia (Borneo); 10 = Malaysia (Peninsular); 11 = Myanmar; 12 = Nepal; 13 = Sri Lanka; 14 = Thailand; 15 = Vietnam. See Figure S4 for axes rescaled to exclude Yunnan.
Interestingly, the magnitude of the decline did not always increase with scenarios reflecting higher-emissions, even within countries (Table 5 and Figure 4). In fact, scenarios 2.6/1 and 8.5/5, with the lowest and highest amounts of radiative forcing respectively, showed similar overall losses (2.6/1 yielded −24.24% and 8.5/5 yielded −22.41%). Moreover, SSP 4, which was coupled to two different possible emissions pathways (3.4/4 and 6.0/4), showed greater losses in the lower emission scenario than in the higher emissions scenario (with −83.26% and −19.29% respectively), with 3.4/4 being the worst outcome among all six scenarios. Scenario 4.5/2 yielded the best outcome. Scenarios also did not appreciably differ in terms of changes to calculated metrics of habitat fragmentation, with the exception of 3.4/4, which showed a severe decrease in the amount of suitable habitat accompanied by reductions in patch size and increased contagion (Figure S3).
Discussion
Habitat loss due anthropogenic activities is a global concern for numerous taxa (40, 41). While recent technical advances have enabled characterizations of near-term losses of particular biomes (e.g. forests (12)), the long-term implications of diverse land-use trends for particular taxa have been difficult to assess. We present the first quantitative assessment of the impact of land-use changes on habitat availability for a keystone species at a global scale. Our model identified which parts of the range, at coarse scale, may be of particular conservation concern or offer opportunities for species recovery. Since modelled scenarios represent exemplars of possible worlds rather than precise depictions of reality, our intent is not to identify a particular “best” outcome around which policies can be crafted, nor even to predict which specific sites are of conservation value. Rather, because Asian elephants constitute a flagship species that represents diverse ecosystems, we expect these findings to be informative for land-use planning, climate change mitigation strategies and sustainability initiatives at both national and global levels.
Loss of the western-most extremities of Asian elephant range may have occurred concurrently with the flourishing of early agricultural civilizations (20). Our results show that elephants have lost two-thirds of their possible historic habitat within the past 300 years. Today elephants occur in only 14% of the land area classified as suitable, and only around half of their current range is classified as suitable. While it is possible that some of this is due to modelling error, these observations may also reflect a lag between land-use changes and population responses to these changes. Elephants may no longer be able to disperse into areas from which they have been extirpated or persist in areas where there has heavy offtake in the past (42, 43). Conversely, they can continue to persist for some time in suboptimal habitat due to individuals’ longevity even if failing to reproduce (30).
Both of these possibilities are evident from trends in South Asia, which are largely driven by India and Sri Lanka. These two countries contain the largest remaining Asian elephant populations (Table 3), but many landscapes are disturbed. The remaining elephant populations of the Eastern Ghats and central parts of India largely roam in fragmented forest outside protected areas. Likewise in Sri Lanka, the present-day distribution more closely matches range classified as suitable habitat in the year 1700 than 2015 (25 and this paper), yet extinctions may not occur for several generations due to the slow pace of demographic processes (30, 45). This is consistent with the observation that a substantial portion of elephant range is outside protected areas in environments constituting agricultural mosaics with substantial human activity (15, 44, 46). Both countries were heavily transformed by road-building and plantations during the colonial era, leading to the eradication of elephants from higher elevations (47). Both are predicted to continue losing habitat in all future scenarios, which will likely exacerbate human-elephant conflict in these densely populated range states unless these trends are stabilized or reversed.
Elephants may be able to persist if able to shift their ranges; however, this can introduce new conflicts involving human populations that have little experience with elephants. Thus elephant movements convert ecological events into social, economic and political issues. Bangladesh and Nepal can potentially gain habitat under certain scenarios. Bhutan is predicted to lose habitat under all scenarios but has a constitutional mandate to maintain at least 60% of its forest cover. Elephant populations losing habitat in one region will congregate within the remaining habitat in neighboring regions; therefore, trans-boundary management plans are urgently required that take into account this reality. Accommodating trans-boundary movements, together with education and management programs for the affected communities, will be essential to future conservation.
In Southeast Asia, the disappearance of a large tract of highly suitable habitat in central Thailand is particularly striking (Figure 3), possibly reflecting both the land conversions that occurred during colonialism as well as the more recent “Green Revolution” of industrial agriculture. Thailand and Myanmar, both of which have lower elephant populations than expected based on their share of inhabited range, have had high rates of historic offtake, and Myanmar has recently been fighting the poaching of elephants for skin (48–51). Trends for these countries continue across all modelled future scenarios (Figure 4). Sumatra is expected to lose more than half of its suitable habitat and suffer losses even under low-emission scenarios. This predicted loss reiterates the need for stronger ecosystem conservation efforts given the already critical status not only of the genetically distinct Sumatran elephant, but other unique taxa restricted to the island, including orangutan, rhinoceros and tigers. The outlook for Vietnam is particularly bleak, with all scenarios showing losses of remaining habitat. Unless there is concerted effort to recover habitat and re-connect isolated elephant populations, local extirpations can be expected.
Malaysia stands out as a region for potential gains both for mainland and Bornean populations. On the island of Borneo, there seems to have been a northward shift in suitable habitat (Figure 3). This may be at least in part because selectively logged secondary forests have more open canopies than primary forests, which encourage the growth of low-level herbaceous vegetation, grasses and other monocots that are favored by Asian elephants (17). Alternatively, the model may be failing to distinguish plantation landscapes (oil palm, coffee, tea, rubber etc.) that may not be considered appropriate for elephants despite their use of such areas due to the prevalence conflict-related mortality (45). Because LUH variables explicitly differentiate primary from harvested forests, the latter explanation is unlikely. It is most likely that the “gain” in habitat reflects some aspect of the Bornean landscape and its history that is inadequately represented by our sampling points. Yunnan province in China may also offer opportunities for population recovery and re-wilding, if there is sufficient political desire as well as capacity to safeguard against hunting and trafficking. Perhaps most importantly, because rates of human-elephant conflict are already extremely high, range expansion can only be possible alongside management programs designed to also safeguard human communities and livelihoods.
Surprisingly, low-emissions scenarios do not necessarily yield better outcomes than higher-emissions scenarios for these ecosystems. This is demonstrated by the contrast between scenarios 3.4/4 and 6.0/4, along with the similarity between scenarios 2.6/1 and 8.5/5 (Table 5). It is especially noteworthy that 3.4/4, despite being moderate in terms of emissions, resulted in the worst habitat loss. One possible explanation of these unintuitive outcomes at the global scale is that if lower emissions targets are achieved only via advances in developed countries and/or through heavier reliance on biofuels, which already contribute heavily to deforestation in Asia, such losses represent the ecosystems that are at risk of being sacrificed. Scenario 3.4/4 represents such a situation, in which heightened regional inequities result in “a failure of current policies for energy access, leading to continued and increased use of biomass in the households of developing countries” (25). This underscores the complexity of the relationship between land-use practices and climate change, and the fallacy of assuming that climate trends can be divorced from societal concerns. While it is undoubtedly important to stabilize the climate by limiting global emissions, the pathway to doing so must manage Earth’s social-ecological system in a manner that does not further undermine vulnerable species and ecosystems.
Acknowledgments
Data preparation and analyses were supported by the Smithsonian Conservation Biology institute and Colby College. The authors wish to thank Kate Jenks and Megan Baker for providing some of the elephant occurrence data. Preparation of this manuscript was partially supported by a James Smithson Fellowship to SdS and funding from the Section in Ecology, Behavior and Evolution at the University of California, San Diego. AM & SdS also received funding from the U.S. Fish & Wildlife Asian Elephant Conservation Fund. TW thanks the Colby College Environmental Studies Program, the Ralph J. Bunche Scholarship and Russell F. Cole Fellowship.


