

Abstract
Autism spectrum disorder (ASD) is a serious neurodevelopmental disorder with a very high prevalence rate and a chronic disease course beginning in early childhood. Despite the tremendous burden of ASD, there are currently no disease-modifying treatments. Like many neuropsychiatric illnesses ASD has a complex pathophysiology driven by genetic and environmental factors. There is interest in identifying modifiable environmental factors as potential translational research strategies for development of therapeutics for ASD. A rapidly growing body of research demonstrates that the resident bacteria of the gastrointestinal tract, collectively the gut microbiome, have profound influence on brain and behavior. This gut-brain signaling pathway is highly relevant to ASD as the microbiome begins to form at birth, is heavily influenced by environmental factors throughout early life, and begins to stabilize at the same stage of development that symptoms of ASD begin to develop. To investigate potential gene x microbiome interactions in a model of ASD, we utilized mutant mice carrying a deletion of the ASD-associated Shank3 gene (Shank3KO), which clinically manifests as Phelan-McDermid syndrome, as a model for genetic risk of ASD. Analysis of the gut microbiome of Shank3KO mice demonstrated genotype effects on both microbiome composition and metabolite production. Behaviorally, Shank3KO mice demonstrate decreased social interactions and have altered anxiety and compulsive-like behaviors. Disruption of the microbiome with broad spectrum antibiotics lead to an exacerbation of all behavioral phenotypes in Shank3KO mice. Additionally, we found that Shank3KO mice had markedly increased changes in gene expression in the prefrontal cortex following microbiome depletion. Taken together, our results suggest a gene x microbiome interaction in this mouse model for ASD and raise the possibility that targeting the microbiome may be a valid translational research strategy in developing therapeutics for ASD.
Introduction
Autism spectrum disorder (ASD) is a serious neurodevelopmental disorder characterized by deficits in social function, stereotyped and repetitive behaviors, and, often, impairments in cognitive function1. The prevalence of ASD is remarkably high, with recent estimates approximating 1 in 59 children affected2. Despite this, there are currently no disease modifying pharmacotherapies for treatment of ASD. Some of the difficulty in developing new pharmacotherapies for ASD is that the pathophysiology is complex and driven by a combination of genetic risk and environmental insults. Large scale genetic studies have identified more than 100 gene loci associated with increased risk of ASD13, and a number of single gene causes of ASD have been identified (e.g. Fmr1, Shank3)4,5. While host genetics is a key factor in ASD, a more comprehensive understanding of non-genetic environmental contributions and how to mitigate them represents an attractive area of research to understand and reduce the development and progression of ASD.
A growing body of evidence shows that the resident bacteria in the gastrointestinal tract, collectively the gut microbiome, play a role in normal brain function and behavior, and may have relevance for neurodevelopmental disorders. Disruptions of the gut microbiome lead to alterations in gene expression and epigenetic regulation in the brain as well as alterations in neuronal activity patterns and synaptic plasticity in multiple limbic substructures6–8. Studies examining the composition of the microbiome in patients with ASD have repeatedly found that patients have differences in microbiome composition9–11, but specific microbial changes associated with a diagnosis have varied between studies. Additionally, patients with both idiopathic and syndromic forms of ASD have gastrointestinal issues at rates much higher than the general population5,11. Indeed, there is robust literature indicating that shifts in the gut microbiome influence brain and behavior in murine models for ASD. Early studies showed that germ-free mice (i.e. mice that are raised completely sterile with no internal or external microbiome) have marked deficits in social behaviors and in gene expression profiles in multiple brain regions related to regulation of these behaviors12–14. Additionally, mice who have had their microbiomes depleted with antibiotics show deficits in social behavior, cognitive flexibility, and multiple other ASD-like behaviors6,15,16. At a cellular and molecular level, disruption of the microbiome with prolonged antibiotics leads to changes in neuronal and glial structure, changes in cell firing patterns, and altered transcriptional and epigenetic signatures in multiple brain structures6,17–19.
While the literature demonstrating a gut-brain connection in ASD is robust and continues to grow, there are few studies specifically modeling gene x microbiome interactions using available mouse models. An attractive gene candidate for this line of research is the Shank3 gene which encodes a synaptic scaffolding protein, and is the causative gene underlying Phelan McDermid Syndrome. Importantly, patients with Phelan McDermid manifest features of ASD with cognitive impairment, and also have very high rates of gastrointestinal issues5 – suggesting a potential for a gut brain link. Indeed, several studies have examined the microbiota in mouse lines lacking specific Shank3 isoforms, and have found changes in the gut microbiome composition that relate to ASD-like phenotypes20,21.
Here we utilize a recently characterized mouse with a deletion of exons 4-22 of the Shank3 gene which results in a mouse lacking all functional isoforms of Shank3 (Shank3KO)22. Using microbial sequencing and targeted metabolomics we identify changes in microbiome form and function driven by Shank3 genotype. Additionally, using antibiotic induced microbiome depletion we see that Shank3KO mice are particularly sensitive to behavioral effects of microbiome disruption. Finally, using RNA-sequencing of the frontal cortex we identify a unique gene expression signature induced by microbiome depletion in the Shank3KO mice. Taken together, our data build on the existing literature and work to identify important gene x microbiome interactions in ASD and provide preliminary mechanism of this interaction.
Materials and Methods
Mice
All animal procedures were approved by the Institutional Animal Care and Use Committee of the Icahn School of Medicine at Mount Sinai. Shank3KO mice were bred from breeders heterozygous for the Shank3 gene, and littermate animals were used for all experiments. Both male and female mice were weaned at 21 days of age and caged according to sex with at least one littermate from each genotype in cages containing 2-5 littermates per cage. Food was available ad libitum throughout the experiments, and drinking water was modified as described below. The mouse holding room was maintained at a constant temperature of 21°C and 55% Humidity with a 12-hour light dark cycle (on 0700 / off 1900).
Antibiotic Treatment
Immediately after weaning, mice were split equally into control and antibiotic treatment groups. Antibiotic mice received drinking water containing a non-absorbable antibiotic cocktail (Abx - Neomycin 2 mg/ml, Pimaricin 1.2 ug/ml, Vancomycin 0.2 g/ml, and Bacitracin 0.5 mg/ml)19. Control animals were given standard drinking water from the same tap. Animals were maintained on these treatments for the duration of the experiments. Bottle as well as mice weights were recorded biweekly for first two weeks of treatment, and then weekly afterwards to ensure mice were maintaining health. Antibiotic solutions were changed weekly to maintain antibiotic efficacy.
Behavioral assessments
Behavioral experiments were conducted between 10:00 am and 18:00 during the light phase of the light/dark cycle in soundproof cubicles designated for behavioral testing under red lights. Mice were brought to the front room of the testing area an hour prior to testing in order to habituate to the new environment. Animals from both genotypes (Wt and KO) and treatments (H2O and Abx) were tested on the same day in random order to control for any potential circadian influences.
Three chambered Social Interaction Test
Sociability was tested in a three chambered apparatus according to standard procedures23. The test consisted of three stages. The first two were for habituation to the chamber, and the third was the measured test phase. During the first stage the test subject was placed into the central neutral chamber with both dividers closed and was allowed to explore the middle chamber for 5 minutes. During the second stage of the test, the two dividers were removed, and the test subject explored all three chambers for 10 minutes without another mouse present. During the final stage of the test the mouse was returned to the middle chamber with both dividers closed, and an empty wire cup and a wire cup containing a novel interactor mouse were placed in the two outside chambers. The wire cups allow for olfactory, visual, auditory and tactile contact contacts between animals but not sexual contact or fighting. The doors between chambers were then opened, and the test subject was allowed to explore all three chambers again for 10 minutes. All three sessions were video tracked (Noldus Ethovision) and the amount of time spent in each chamber as well as the time spent interacting with either empty cup or unfamiliar mouse was automatically calculated. If an animal spent 70% more time in one chamber than the other during the habituation stage (stage 2) they were dropped from the analysis. Mice used as interactors were adult C57BL/6J mice of the same age and sex as the test mouse. Interactor mice were ordered from Jackson labs and allowed at least one week to habituate to the colony room prior to any testing. Twenty-four hours prior to testing, the interactor mice were habituated to the interaction apparatus and the wire cup to prevent any confounding effects of novelty stress.
Open field
Mice were tested in a square arena (45 × 45 cm) and enclosed by 25cm high walls (Plexiglass). The test mouse was placed in center of arena and allowed to move freely for 10 minutes. Animal activity was recorded by video tracking (Noldus Ethovision). The arena was virtually divided into central and peripheral regions using the Noldus software. The total distance traveled, as well as the total time spent in the center vs the peripheral regions were calculated.
Marble Burying
Animals were tested in a regular clean cage (42 cm long × 24 cm wide × 12 cm height) with 5cm of sawdust. Subjects were first placed into the cage containing sawdust for 5 minutes to habituate and then the animal was temporarily placed into a holding cage while 20 marbles (15 mm in diameter) evenly spaced, were positioned into the bedding in a 4 × 5 arrangement to cover the whole of the cage surface. The test subject was then returned into the test cage and allowed to explore/bury marbles in a 15-minute test session. At the end of the session, the mouse was removed and the number of marbles which were more than 50% covered in bedding (i.e. buried) were quantified.
Metabolomics
For biochemical experiments, cecal contents were collected and flash frozen on dry ice and then stored at −80°C until processing. Samples were processed by the metabolomics core at University of Pennsylvania according to standard protocols. Short chain fatty acids and amino acids were quantified using a Water Acquity uPLC System with a Photodiode Array Detector and an autosampler (192 sample capacity). For short chain fatty acids samples were analyzed on a HSS T3 1.8 μm 2.1×150 mm column with a flow rate of 0.25 mL/min, an injection volume of 5 uL, a column temperature of 40°C, a sample temperature of 4°C, and a run time of 25 min per sample. Eluent A was 100 mM sodium phosphate monobasic, pH 2.5; eluent B was methanol; the weak needle wash 0.1% formic acid in water; the strong needle wash 0.1% formic acid in acetonitrile, and the seal wash is 10% acetonitrile in water. The gradient was 100% eluent A for 5 min, gradient to 70% eluent B from 5-22 min, and then 100% eluent A for 3 min. The photodiode array is set to read absorbance at 215 nm with 4.8 nm resolution. Amino acid concentrations were quantified via ultra-performance liquid chromatography (Waters Acquity UPLC system) with an AccQ-Tag Ultra C18 1.7 μm 2.1×100mm column and a photodiode detector array. Analysis was performed using the UPLC AAA H-Class Application Kit (Waters Corporation, Milford, MA) according to manufacturer’s instructions.
For both assays, standards were run at the beginning and end of each metabolomics run. Quality control checks (blanks and standards) were run every eight samples. Results were rejected if the standards deviate by greater than ±5%. Samples were quantified against standard curves of at least five points run in triplicate. All chemicals and reagents are mass spectrometry grade.
16s-Sequencing
DNA isolations
Bacterial genomic DNA was isolated from frozen cecal samples using the QiaAmp DNA stool kit (Qiagen) according to standard protocols with a modification that included an additional step of bead beating using the to ensure uniform lysis of bacterial cells. Extracted DNAs were checked for quality and quantity by spectrophotometric measurements with NanoDrop (ThermoFisher Scientific Inc) and stored at −20C until processed for amplification.
Microbiome Sequencing
Primers 338F (5’-ACTCCTACGGGAGGCAGCAG-3’) and 805R (5’- GGACTACHVGGGTWTCTAAT-3’) designed to target regions (V3-V4) of the 16S rRNA gene were used for PCR as sequences in that regions provided the greatest diversity at the domain and bacteria phylum levels23. The 5’ ends of the primers were tagged with specific barcodes and sequencing universal primers. PCR amplification was performed in 25 μL reactions containing 25 ng of template DNA, 12.5 μL of PCR premix, 2.5 μL of each primer, and PCR-grade water. The PCR conditions for amplifying the prokaryotic 16S fragments comprised the following steps: initial denaturation at 98°C for 30 seconds; 35 cycles of denaturation at 98°C for 10 seconds, annealing at 54°C/52°C for 30 seconds, extension at 72°C for 45 seconds, and final extension at 72°C for 10 minutes. PCR products were confirmed with electrophoresis in 2% agarose gel. Ultrapure water was used as the negative control to exclude false positives. PCR products were purified by AMPure XT beads (Beckman Coulter Genomics, Danvers, MA, USA) and quantified by Qubit (Invitrogen, USA). The size and quantity of the amplicon library were assessed with Agilent 2100 Bioanalyzer (Agilent, USA) and Library Quantification Kit for Illumina (Kapa Biosciences, Woburn, MA, USA), respectively. PhiX control library (v3) (Illumina) was combined with the amplicon library (at a fraction of 30%). The libraries were sequenced on Illumina MiSeq (300bp paired-end) using the standard Illumina sequencing parameters.
16S Data Analysis
Paired-end reads were assigned to samples based on their unique barcodes before barcode and primer sequences were trimmed. The trimmed reads were merged using FLASH24. Quality filtering on the raw tags were performed to obtain high-quality clean tags with fqtrim (v0.94). Chimeric sequences were filtered using Vsearch (v2.3.4). Sequences with ≥97% similarity were assigned to the same operational taxonomic units (OTUs) by Vsearch (v2.3.4). Representative sequences were chosen for each OTU, followed by taxonomic assignment using the RDP (Ribosomal Database Project) classifier25. The differences of the dominant species in different groups and multiple sequence alignment were conducted by mafft software (v7.310). OTU abundance information was estimated after rarefaction with the least sequence number obtained for the project. Alpha diversity for analyzing complexity of species diversity were calculated by Quantitative Insights Into Microbial Ecology (QIIME) v1.8.0 using the Shannon and Simpson diversity metrics26.
Functional profile prediction
Predicted functional profiles of bacterial groups were determined using Phylogenetic Investigation of Communities by Reconstruction of Unobserved States (PICRUSt2) bioinformatics software package. The analysis was performed using default PICRUSt2 parameters as published27. Firstly, the OTU table produced within QIIME was normalized for multiple 16s RNA copy numbers. Then the obtained normalized OTU table was placed into a reference tree in order to obtain the Kyoto Encylopedia of Genes and Genomes (KEGG) orthologs, Enzyme classification numbers (EC numbers), Clusters of Orthologous Genes (COGs), Protein families (Pfam) and the Institute for Genomic Research’s database of protein Families (TIGRFAM) functional predictions for each sample. The reference tree used by PICRUSt contains 20,000 full 16s sequences from prokaryotic genomes from the Integrated Microbial Genomes database28. OTUs are placed into the reference tree using HMMER (www.hmmer.org) EPA-NG29 to determine the best position of these placed OTUs in a reference phylogeny, and GAPPA30 to output a tree of the most likely OTU placements. This results in a phylogenetic tree containing both reference genomes and environmentally sampled organisms, which is then used to predict individual gene family copy numbers for each OTU. Hidden State Predictions are used by PICRUSt to infer the genomic content of the sampled sequences. This is done using the Castor R package31. Lastly, PICRUSt can also infer pathway abundances based on the abundances of gene families that can be linked to reactions within a pathway using MinPath32. For presentation, the family of genes table and the path abundance table were analyzed with a two-tailed students t-test followed by FDR correction (Q < 0.2) and the top 10 functions were graphed (full tables in supplement).
RNA-Sequencing
RNA Isolation
Medial Prefrontal cortex (mPFC) samples were rapidly dissected from ~60-day old mice and flash frozen on dry ice. Total RNA was isolated by homogenizing tissue in Qiazol (Qiagen) using a motorized pellet pestle and purified using RNeasy mini kits from Qiagen (74106) with optional on-column DNAase digestion (79254) per manufacturer’s protocol.
cDNA library preparation
cDNA library preparation was performed using NEBNext Ultra II Directional RNALibrary Prep Kit for Illumina (E7765). Briefly, mRNA was isolated from 1.0 ug total RNA per sample using the NEBNext Poly(A) mRNA Magnetic Isolation Module (E7490). cDNA was synthesized using random primers and was fragmented, end-repaired and ligated using adaptors appropriate for RNA sequencing. Samples were multiplexed using NEBNext Multiplex Oligos for Illumina Kit (E7600) with dual index 8-bp bar-codes introduced at the end of the adaptors during PCR amplification per manufacturer’s protocol. Constructed sequencing libraries were subject to sequencing with Illumina NovaseqTM 6000 platform (paired-end, 150 bp). Prior to assembly, reads containing sequencing adaptors, reads containing sequencing primers, and sequences with q quality score lower than 20 were removed. The cleaned sequencing reads were aligned to Enseml release 88 of the Mus musculus reference genome using the HISAT2 package. Multiple alignments were allowed for each read sequence (up to 20 by default), with a maximum of two mismatches allowed.
RNA-seq Data Preprocessing
Prior to assembly, reads containing sequencing adaptors, reads containing sequencing primers, and sequences with q quality score lower than 20 were removed. The cleaned sequencing reads were aligned to reference genome mm10 using the HISAT2 package. Multiple alignments were allowed for each read sequence (up to 20 by default), with a maximum of two mismatches allowed. Raw count data measured 32,541 transcripts across all samples. Nonspecific filtering required more than 1 count per million (cpm) in at least 3 samples and retained 14,643 transcripts. Filtered raw count data was then subjected to voom normalization33. Normalized data were then inspected for outlying samples using unsupervised clustering of samples (Pearson’s correlation coefficient and average distance metric) and principle component analysis to identify outliers outside 2 standard deviations from these grand averages. Based on these metrics, no significant outliers were found.
Differential Gene Expression Analysis
Differential gene expression (DGE) signatures between samples were identified using moderated t-test in the limma package33. The covariates, neuronal cell type, treatment and genotype were included in the models to adjust for their potential confounding influence on gene expression between group main effects. Statistical significance threshold was set as a p-value of < 0.01.
Functional Annotation and Protein Interaction Networks
Pairwise gene expression signatures with a p-value <0.01 were analyzed for functional annotation. Significantly upregulated or downregulated genes were separately uploaded into the open source pathway analysis software package G:Profiler34 to identify significantly enriched gene ontologies (GO terms). Overlapping GO terms were then reduced using Revigo35. Predicted protein-protein interaction networks of significantly regulated genes was analyzed using the STRING database36 and predicted protein-protein interactions (PPI) were imported into Cytoscape37. Genes involved in the GO Process “regulation of signaling” (n = 164) were separated from the full PPI network for further analysis. For visualization of predicted protein-protein interactions, disconnected nodes were removed from the image, node size was adjusted to correspond to p-value relative to Wt-H2O controls (larger node = smaller p-value), and node color was adjusted to correspond to log2 fold change relative to Wt-H2O controls (blue = downregulated, red = upregulated).
Results
Deletion of the Shank3 Genes Results in a Dysregulated Gut Microbiome
To identify effects of Shank3 gene deletion on microbiome composition we performed 16S ribosomal sequencing on cecal contents of untreated Wt and Shank3KO mice at postnatal day 70. Analysis were performed on littermate mice co-housed by genotype to prevent any maternal or environmental confounds on the analysis. Measures of alpha diversity, which calculates the richness and evenness of species in a microbial sample38, show decreased alpha diversity in Shank3KO mice when calculated by both the Simpson (Fig. 1A – p < 0.05 two-tailed t-test) and Shannon (Fig. 1B – p < 0.05 two-tailed t-test) diversity indices. This decrease in diversity is apparent when the relative expression of bacterial phyla in the microbiomes of the two species are compared (Fig. 1C). In mammals the most abundant bacterial phyla in the gut microbiome are the Bacteroidetes and Firmicutes, and their presence and relative abundance have been tied to the health of the microbiome39. Shank3KO mice have a significant decrease in the abundance of bacteria from the Firmicutes phylum (Fig. 1D – p < 0.01 two-tailed t-test), and a trend toward increase in bacteria from the Bacteroidetes phylum (Fig. 1E). When the ratio of these species from each animal is compared, Shank3KO mice have a significant decrease in the Firmicutes/Bacteroidetes ratio (Fig. 1F – p < 0.05 two-tailed t-test).

Alpha diversities of gut microbiomes from Wt and Shank3KO mice were calculated with Simpson (A) and Shannon (B) diversity metrics. Shank3KO mice show decreased diversity by both measures. (C) Donut charts showing the relative Phylum composition of Wt and Shank3KO animals (D) Relative composition of bacteria from the Firmicutes phylum was decreased in Shank3KO. (E) There was no significant difference in relative composition of Bacteroidetes bacteria between genotypes. (F) The ratio of Firmicutes to Bacteroidetes was found to be significantly decreased in Shank3KO mice. [* p < 0.05; ** p < 0.01]
Examination of bacterial classes shows similar changes due to genotype, with shifts in expression of Clostridia, Gammaproteobacteria, Verrucomicrobiae, and Bacilli visualized in a Circos plot in Fig. 2A, although only Bacilli were significantly different between the genotypes (p < 0.05 two-tailed t-test). To refine our understanding of Shank3 genotype effects on microbiome composition we next examined more detailed levels of phylogeny down to the genus level. Members of the class Bacilli, order Lactobacillales, family Lactobacillaceae, and genus Lactobacillus were significantly reduced in Shank3KO animals (Fig. 2B). Comparison of the most represented bacterial genera between Wt and Shank3KO mice revealed multiple changes driven by Shank3 genotype (Supplemental Tables 1&2).

(A) A Circos plot illustrates relative expression of the top most abundant bacterial classes compared between Wt and Shank3KO mice. While all show some shift, only the Bacilli reach statistical significance between groups (p < 0.05). (B) Log2 relative abundance of changes to the genus Lactobacillus across all taxonomic levels shows decreases at all levels. [*p < 0.05 **p < 0.01 ***p < 0.001]
Phylogenetic analysis of 16S sequencing data is useful for determining between group differences in bacterial populations, but it does not provide insight into the functional relevance of these changes. To examine the functional consequences of these changes in bacterial populations we applied PICRUSt (Phylogenetic Investigation of Communities by Reconstruction of Unobserved States) analysis, which predicts functional pathway differences between expressed bacterial populations27. In Fig. 3A we present the KEGG Orthologies that are the most significantly different between Wt and Shank3KO (Full data available in Supplemental Table 3). These data show that there are significant decreases in spore formation pathways (spore maturation protein A, Stage 0 sporulation protein, Stage II sporulation protein D) which is consistent with the phylogenetic finding of decreased populations of Firmicutes. Metabolic pathway analyses (Fig. 3B) showed a decrease in multiple short chain fatty acid (SCFA) metabolic pathways such as superpathway Clostridium Acetobutylicum Acidogenic fermentation and pyruvate fermentation to butanoate (t-test p < 0.001 FDR q value <0.2). Taken together results from the 16S analysis strongly suggest that deletion of the shank3 gene leads to an altered gut microbial and metabolic signature independent of environmental influences.
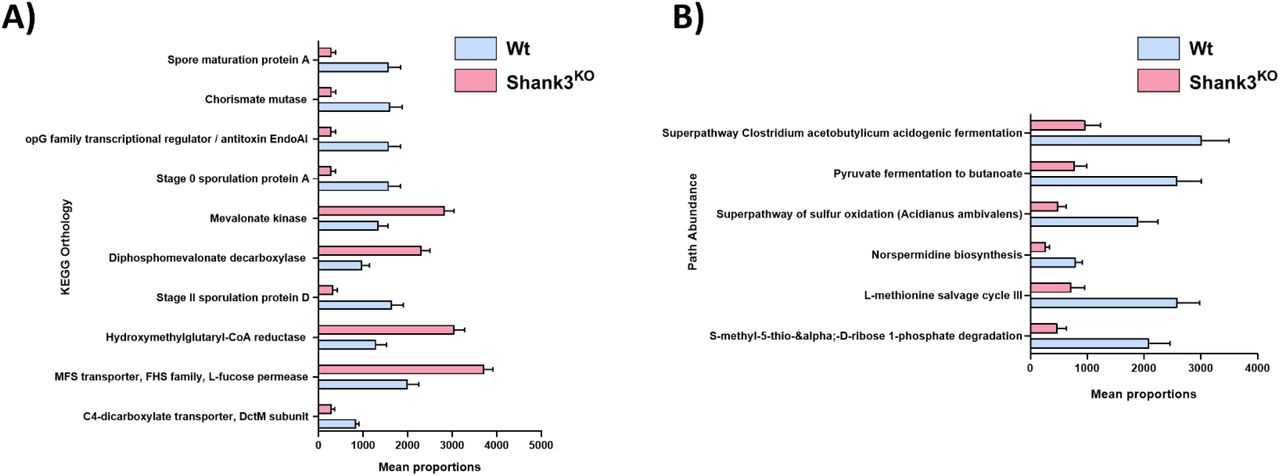
Projected functional pathways present in observed bacteria was performed using PICRUSt. (A) KEGG homologous gene families significantly altered by genotype & (B) Predicted functional pathway abundance using Minipath. All projected pathways are statistically significant with an FDR corrected p value < 0.2. Full PICRUSt tables are available in Supplemental Table 3.
Antibiotic markedly reduces gut microbiome while maintaining overall animal health
Immediately after weaning (P21), mice were switched either to a cocktail of broad-spectrum antibiotics (Abx) via their home cage drinking water or remained on control water. This manipulation is meant to allow for detailed investigation of the effects of a reduced microbiome on brain and behavior. However, it is critical for our experiments that the animals also remained healthy throughout the manipulation. As body weight is an excellent measure of overall health of the animal, we tracked bodyweights in all groups from weaning through behavioral testing. There was no effect of antibiotic treatment in either Wt or Shank3KO mice (Fig. 4A – two-way repeated-measures ANOVA: main effect of group F(3,17) = 0.13; p=0.94; All between group post-hoc comparisons p > 0.9) and animals in all groups showed normal body weight gain over development (main effect of time F(1.4, 24.4)=260.0; p<0.0001). Similarly, when average daily drinking was measured for each cage of mice, there was no difference between animals with control drinking water or Abx-treated water (Fig. 4B – two-tailed t-test p = 0.64). Given that animals are group housed across genotypes, amount of water consumed by each genotype cannot be accurately calculated. However, as there were no differences in weight gain between the genotypes, it can be reasonably surmised that they were drinking normally over the 6-7 week course of treatment. Taken together, these data show that our treatment did not affect overall baseline health of our mice.

(A) Wild-type and Shank3KO mice show normal body weight growth over time regardless of genotype or treatment. (B) Animals of all genotypes drink control water and antibiotic treated (Abx) water at similar rates over development. (C) Prolonged treatment with antibiotics results in marked depletion of microbial diversity in both Wt and Shank3KO mice. (D) Unweighted PCOA plot of beta diversity comparing all four groups shows a marked shift induced by antibiotic treatment, and a more subtle effect of Shank3 deletion. [*p < 0.05; **p < 0.01; ***p < 0.001; ****p < 0.0001]
To assess the efficacy of long-term microbiome depletion at decreasing overall microbial diversity, we performed 16S microbial sequencing on control and Abx-treated mice from each genotype at P60. Analysis of the alpha diversity of bacterial species using the Shannon diversity index demonstrated a robust main effect of antibiotics (Fig. 4C - Two- way ANOVA main effect of treatment F(1,14)=32.15; p < 0.001). On this analysis there was no main effect of genotype (F(1,14)=0.6692; p=0.42), and there was a trend toward interaction that did not reach statistical significance (F(1,14)= 4.34; p=0.056). However, on post-hoc testing, the Wt and Shank3KO water groups were again significantly different from one another (p = 0.026), and all Abx groups were significantly different from all H2O controls. However, there was no difference between Wt-Abx and Shank3KO-Abx groups, suggesting that the microbiome was depleted by Abx equally in both groups. In addition to the alpha diversity measures, we also measured beta diversity, which measures between sample similarity, in all groups. Using an unweighted Unifrac PCOA analysis we see that antibiotic-treated mice cluster together (Fig. 4D - Permutation test, p=0.002).
Shank3KO mice have an altered cecal metabolome that is exacerbated by antibiotic treatment
The gut microbiome is a highly metabolically active structure, and production of neuroactive metabolites by the gut is one of the main means of gut-brain signaling40,41. Given their changes in baseline microbiome composition (Fig.1) we examined this functional output to determine if specific metabolites are altered in Shank3KO mice. Using targeted metabolomics analyses we examined levels of both amino acids and short chain fatty acids, both classes of compounds that have evidence for gut-brain signaling and have been implicated in models of ASD42,43. Pairwise analyses of these metabolites showed genotype differences in multiple amino acids including the essential amino acids methionine and phenylalanine, as well as tyrosine and glycine which are highly involved in neurotransmitter synthesis and levels (Fig. 5A left)44. Short-chain fatty acid analysis showed decreases in levels of both acetic acid and isobutyric acid (Fig. 5A right).

(A) In untreated littermate animals there are multiple amino acids and short-chain fatty acids that are significantly different between Wt and Shank3KO animals. Full table is available as Supplemental Table 4. (B) Levels of the short chain fatty acid acetate were decreased by Abx treatment and further decreased in Shank3KO mice. (C) Abx depletion of the microbiome also leads to further reductions of isobutyric acid in both genotypes. (D) Shank3KO mice exhibit baseline increases in levels of phenylalanine, and levels in Wt animals are increased by antibiotic treatment. [*p < 0.05; **p < 0.01; ***p < 0.001; ****p < 0.0001]
To determine how antibiotic treatment further altered levels of these functionally important compounds we analyzed levels after Abx treatment. Metabolites that showed effects of genotype and antibiotics are shown in Fig. 5, but a full table of all metabolites measured is available in Supplemental Table 4. Examination of acetate showed that there was a continued main effect of genotype (Fig. 5B - F(1,17)=9.62; p < 0.001) as well as a main effect of antibiotics (F(1,17)=12.67; p < 0.001). While there was no significant interaction, we performed planned pairwise post-hoc testing between groups. This demonstrated a significant difference between Wt-H2O controls and all other groups. While Shank3KO-H2O mice started with decreased levels compared to Wt controls, there was also a significant difference between H2O and Abx treated Shank3KO mice – resulting in the lowest overall levels of acetate in Shank3KO-Abx mice (Fig. 5B). Similar patterns were seen with isobutyric acid with main effects of genotype (Fig. 5C - F(1,17)=4.88; p < 0.05) and treatment (F(1,17)=47.59; p < 0.001). Post-hoc analysis demonstrated Abx reduced levels in both Wt and Shank3KO mice. Among amino acids, phenylalanine was the only analyte that showed effects of antibiotics as well as genotype. A two-way ANOVA showed main effects of genotype (Fig. 5D - F(1,17)=5.83; p < 0.05) and treatment (F(1,17)=9.69; p < 0.001. Interestingly, pairwise analysis showed effects of antibiotics only in Wt animals, whereas Shank3KO animals that began with higher levels of phenylalanine showed no further increase. Taken together, these metabolomics findings show that baseline changes in gut microbiome between Wt and Shank3KO mice translate to functional changes in the microbial metabolome, and many of these baseline differences are further exacerbated by antibiotic induced microbiome depletion.
Depletion of the gut microbiome exacerbates social interaction deficits in Shank3KO mice
As one of the cardinal domains of ASD is impairment in social interactions, we utilized a three chamber social interaction assay45 to model changes in sociability in Shank3KO mice with an intact and depleted gut microbiome. As the most common method for analysis of these type of data is to determine a binary interpretation of sociability46, we began by comparing time spent in the social interaction chamber and the non-social cup chamber within each treatment group. As expected, Wt-H2O mice spent significantly more time with the novel social interactor mouse (Fig. 6A light blue bars – two-tailed t-test: t=3.94, df=34; p=0.0004). However, Wt mice with their microbiome reduced by antibiotics (Wt-Abx) did not show a significant preference for the novel interactor mouse (Fig. 6A dark blue bars - t=1.14, df=36; p=0.26). Mice carrying the ASD-related Shank3 deletion treated with control water (Shank3KO-H2O) also did not form a significant preference for the social chamber (Fig. 6A pink bars t=1.07, df=22; p=0.30). Interestingly, however, Shank3KO mice with their microbiome depleted with Abx showed a significant aversion for the social chamber, spending significantly more time with the inanimate object (Fig. 6A dark red bars t=1.070, df=22; p=0.027). No groups spent more time in the middle chamber than any other.

(A) In the three-chambered social interaction task Wt-H2O mice spent increased time in the chamber containing the novel social interactor. However, Wt-Abx and Shank3KO-H2O animals did not show a significant preference for the social interactor. Shank3KO-Abx mice exhibited a significant aversion for the social interaction chamber. Middle chamber data shown for reference, but not included in preference calculations. (B) Comparison of the social interaction ratios between groups shows all groups are significantly reduced compared to Wt-H2O, and that antibiotic treatment reduces social preference in both genotypes. [*p < 0.05; **p < 0.01; ***p < 0.001]
To more directly compare effects between groups, we next analyzed these data as a two-way ANOVA using mouse/cup ratio as the metric. On this analysis there was a main effect of both genotype (Fig. 6B – F(1, 34)=11.26; p=0.002) and antibiotics (F(1,34)=12.87; p=0.001), but no significant genotype x treatment interaction. On planned post-hoc testing we see that there are significant reductions in preference with microbiome depletion in both genotypes, and all groups analyzed have significantly lower preference than the Wt-H2O control groups. Taken together, these data suggest that both Shank3 gene deletion, and depletion of the microbiome can adversely affect sociability, and that when the two occur in the same animal there is an additive effect. This is potentially relevant to microbiome disruptions in patients carrying high genetic risk for ASD.
Microbiome disruption alters anxiety and compulsive-like behaviors in Shank3KO mice
Locomotor activity and anxiety-Like behavior were assessed in Wt and Shank3KO mice in a ten min open field session. On measures of total distanced travelled in the open field there were no main effects of genotype (Fig. 7A - F(1,32) = 0.018; p=0.89) or antibiotic treatment (F(1,32) = 0.02; p=0.89), nor any genotype x treatment interaction (F(1,32) = 0.87; p=0.36). When time spent in the center of the field vs. the periphery (central/peripheral ratio), a measure of anxiety-like behavior, was examined we see a main effect of Shank3 genotype in decreasing time in the center area (Fig. 7B - F(1,32) = 10.84; p=0.002) and a non-significant trend toward effect of antibiotics in the same direction (F(1,32) = 1.61; p=0.21). On planned post-hoc testing, both KO groups were significantly different from Wt-H2O controls, and within the Shank3KO groups there was a significant increase in anxiety like behavior in the Abx-treated animals (Fig. 7B – right).
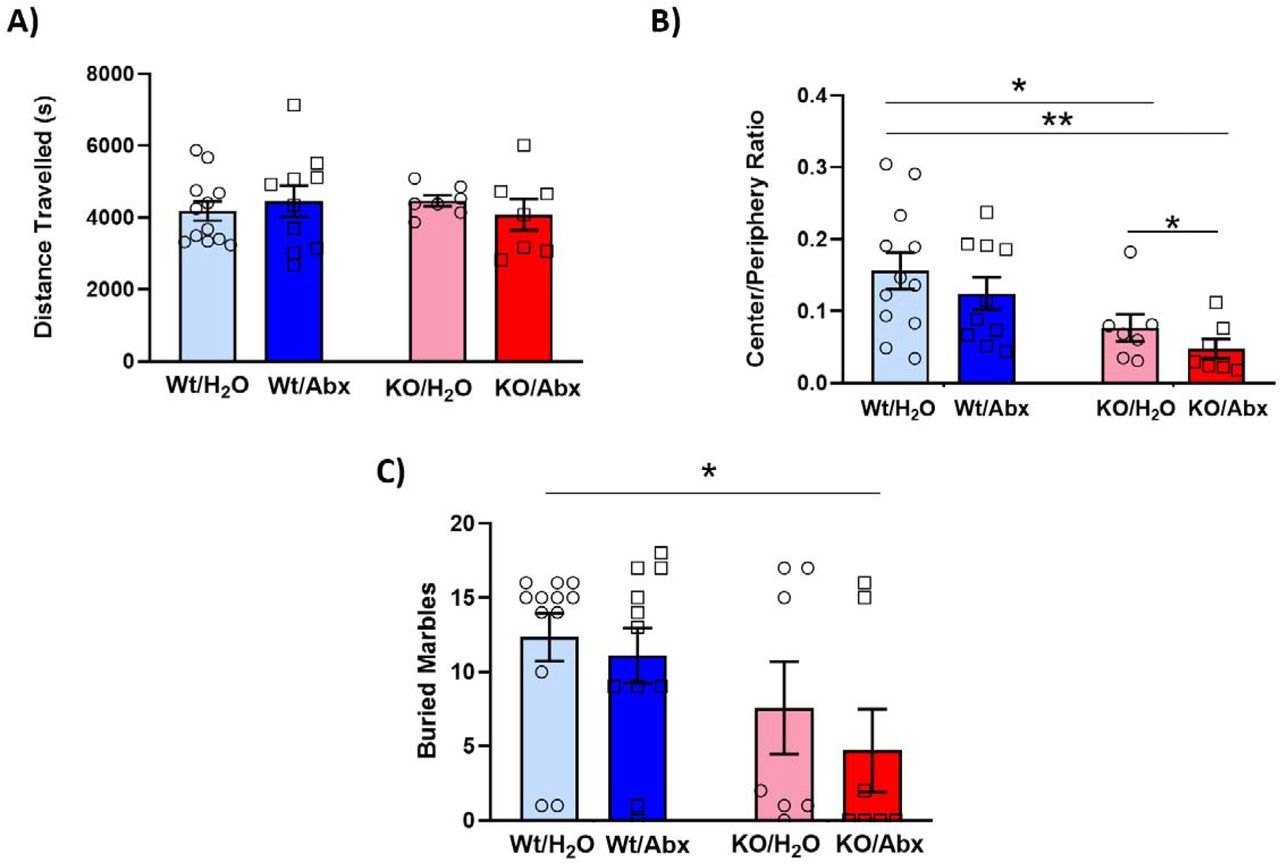
(A) Wt and Shank3KO mice of both treatment groups exhibit similar amounts of locomotor activity during a ten-minute open field task. (B) When time spent in the center vs periphery of the open field is measured, Shank3KO mice exhibit decreased center time, and the effect is exacerbated by antibiotic treatment. (C) Shank3KO mice bury fewer marbles compared to Wt controls on the marble burying task. [*p < 0.05; **p < 0.01; ***p < 0.001]
We next examined effects of Shank3KO and microbiome depletion on a commonly used assay of compulsive-like behaviors – the marble burying test. Here we again see a main effect of genotype with Shank3KO mice burying fewer marbles than Wt littermates (Fig. 7C - F(1,33) = 6.11; p=0.019), but no main effect of antibiotic depletion (F(1,33) = 0.83; p=0.37). Interestingly, on planned pairwise post-hoc testing the only significant group difference was between Wt-H2O and Shank3KO-Abx animals. Taken together, these data suggest that there may be additive effects of microbiome disruption to anxiety and compulsive-like behaviors in Shank3KO mice, but the effects are not as robust as those seen on social behavior.
Gut microbiome depletion differentially affects prefrontal cortex gene expression in Shank3KO
Manipulations of the gut microbiome have previously been shown to alter patterns of gene expression in the brain via production of neuroactive metabolites8,18. To examine how Shank3KO mice might be particularly susceptible to depletion of the gut microbiome, we examined gene expression changes in the medial prefrontal cortex (mPFC) in Wt and Shank3KO mice with and without antibiotic depletion. Since it had not been previously quantified in this line, we first examined changes in Shank3KO-H2O mice relative to Wt-H2O control mice. We found that knockout of the Shank3 gene lead to significant regulation of 1253 genes – with 631 upregulated and 622 downregulated (Fig. 8A). Full list of significantly regulated genes and fold changes is available as Supplemental Table 5. To identify gene pathways that are significantly affected by Shank3 knockout we next performed gene ontology analysis on downregulated and upregulated genes in parallel analyses. Downregulated genes were enriched for biological processes involved in system development, regulation of signaling and interestingly regulation of response to stimulus (Fig. 8B), and upregulated genes had significant enrichment for membrane bounded intracellular organelles (Fig. 8C). A full list of all significant gene ontologies from these analyses is available as Supplemental Table 6. To further examine potential functional consequences of Shank3 gene deletion, we performed STRING36 analysis to predict protein-protein interactions for all significantly regulated genes. With an analysis of protein interactions predicted with high confidence we find a robustly interactive network with 1288 predicted interactions compared to 1074 that would be predicted by chance (p = 1.26e-10). A highly enriched subnetwork “Regulation of Signaling” showing both up and down regulated proteins is visualized in Fig. 8D.

(A) Volcano plot of gene expression changes comparing Wt-H2O and Shank3KO-H2O mice. Positive Log2 fold-change values indicate increased expression in Shank3KO. Bold symbols are statistically significant (p < 0.01). (B) Gene ontology analysis of downregulated genes in Shank3KO shows changes in cell signaling and behaviorally related pathways. (C) Gene ontology analysis of upregulated genes shows changes related to cell structure. (D) A predicted protein-protein interaction matrix of significantly regulated genes related to the “regulation of signaling” gene ontology. Predictive analysis was performed using STRING with default settings, and diagram made using Cytos ape. Node size corresponds to p-value relative to Wt-H2O controls (larger node = smaller p-value), and node color was adjusted to correspond to log2FC relative to Wt-H2O controls (blue = downregulated, red = upregulated)
Given the differential behavioral effects of microbiome depletion, we next examined effects of microbiome depletion on transcriptional regulation in Wt and Shank3KO mice. Interestingly, antibiotic treatment resulted in significant regulation of only 48 different genes in Wt mice (Fig. 9A). However, when Shank3KO mice with a depleted microbiome were compared to their H2O controls we see a regulation of 458 genes (Fig. 9B). Interestingly, when these gene sets are overlaid, there is virtually no overlap between the genes affected by antibiotic treatment in the Wt animals and those altered by microbiome depletion in Shank3KO (Fig. 9C). Pathway analysis of genes regulated in Shank3KO-Abx mice compared to Shank3KO-H2O mice we see significant downregulations of post synapse and ion channel complexes in Shank3KO mice with a depleted microbiome (Fig. 9D), and upregulation of pathways associated with extracellular matrix regulation and tissue development and interestingly we see upregulation of pathways associated with negative regulation of stimuli (Fig. 9E). These data complement our behavioral data and demonstrate that Shank3KO mice have differential CNS susceptibility to robust perturbations of the gut microbiome.

Comparison of mPFC differential gene expression within each genotype after antibiotics reveals minimal effects of microbiome depletion in Wt animals (A), but robust effects of microbiome depletion in Shank3KO (B). For volcano plots positive Log2 fold-change values are up in the Abx group and bold symbols are statistically significant (p < 0.01). (C) Venn diagram examining overlap between genes changed by Abx treatment in Wt and KO mice shows that the two genotypes have highly disparate responses to prolonged microbiome depletion. Gene ontology analysis of the genes changed in Shank3KO-Abx mice shows enrichment for downregulation of postysynaptic and ion channel related genes (D) and upregulation o f genes related to extracellular matrix organization and tissue development (E).
Discussion
Here we demonstrate that mice lacking all isoforms of the Shank3 gene have marked disruptions of their gut microbiome at baseline. Importantly, this is evidenced by decrease in diversity, changes in functional gene expression pathways, and production of bacterially derived metabolites. Additionally, Shank3KO mice were particularly susceptible to behavioral effects of further microbiome depletion on social, anxiety, and compulsive like behavioral measures. RNA-sequencing of the prefrontal cortex showed that Shank3KO mice show altered transcriptomic patterns after microbiome depletion. Taken together, these data suggest that deletion of the Shank3 gene leads to dysbiosis of the gut microbiome, and that mice lacking functional Shank3 are also more susceptible to behavioral and neurobiological effects of gut-brain signaling. This study builds on an already solid foundation of evidence for the role of the microbiome in ASD and may provide avenues for future translational research studies.
Dysregulation of microbiome composition and function in Shank3KO mice
While the literature demonstrating a gut-brain connection in ASD is robust and continues to grow47, there have been relatively few studies utilizing genetic mouse models carrying ASD associated mutations combined with manipulations of the microbiome to model gene x microbiome interactions. For our studies, we chose a murine model which carries a deletion of the Shank3 gene and is generally used as a model for Phelan-McDermid syndrome - in which patients are hemizygous for the Shank3 gene5. While there are numerous mouse lines carrying various Shank3 deletions, we utilized the recently characterized model with a deletion of exons 4-22 which lacks all functional isoforms of the Shank3 protein22. We chose a model of Phelan-McDermid syndrome to study gut-brain interactions in large part due to reports that patients with Phelan-McDermid have problems with gastrointestinal function at much higher rates than the general population5. Surveys of the patient population estimate that there are issues with chronic constipation and/or diarrhea in almost 50% of the patients, with very high levels of gastroesophageal reflux and dysphagia being reported as well5. Given the connection between gut dysfunction and Shank3 deletion in humans, this seemed a rational model to investigate a microbiome x gene interaction on ASD-like phenotypes.
We find that Shank3KO mice display a significant decrease in bacterial diversity of their gut microbiome with a decrease in the ratio of the two major phyla of bacteria, Firmicutes and Bacteroidetes (Fig. 1). Greater than 90% of the mammalian microbiome is comprised of bacteria from the Firmicutes and Bacteroidetes phyla, and changes in the ratio of these phyla are thought to be an important marker of microbiome dysregulation48. Shifts in this ratio are associated with behavioral response to social stress49 as well as with changes in production of the important short chain fatty acid metabolites50. A recent study utilizing a Shank3 mutant mouse lacking both the α and β isoforms of Shank3 also had a shift in the ratio of Firmicutes to Bacteroidetes51. However, while this group did find a similar decrease in bacterial diversity, they found the opposite change in Firmicutes/Bacteroidetes ratio. Similarly, human studies report some patients with ASD present with a decreased Firmicutes/Bacteroidetes ratio52,53 while others show the opposite result54,55. Hence, changes in ratio of these two major bacterial phyla may be related to the genetic mutation as well as environmental factors.
At the genus level we also see decreases in Lactobacillus bacteria, which shows decreases across all phylogenetic levels measured (Fig. 2B). Since we began investigation of gut-brain interactions in our Shank3KO model, there have been reports published in other models of Shank3 mutation that provide further basis for potential gut-brain dysfunction related to the Shank3 gene. Deletion of Shank3 in a zebrafish model leads to decreased intestinal peristalsis and increased intestinal transit time56. Two additional studies that utilized a model of Shank3B deletion also found specific decreases in bacteria from the Lactobacillus genus in Shank3B knockout animals20,21. Additionally, both noted that supplementation with the Lactobacillus species L. reuteri was able to rescue some level of social deficits in the Shank3B knockout mice. Changes in Lactobacillus were not noted in the report on Shank3A/B mice51. Together, our studies lend strength to the evidence linking Shank3 mutations to reductions in Lactobacillus, and begin to suggest this particular bacterial species may be an important component of gut-brain signaling in this model.
Changes in bacterial metabolites and functional pathways in Shank3KO
The gut microbiome is a highly metabolically active ecosystem that produces hundreds of metabolites that are absorbed into circulation57. At this point in time some of the strongest evidence for gut-brain signaling mechanisms is via bacterial production of neuroactive metabolites58. The most widely studied class of these metabolites are the short-chain fatty acids (SCFA), which are produced by bacterial fermentation of fiber. The three most abundant of these – acetate, butyrate, and propionate - and have been shown to be critical for regulation of blood-brain barrier integrity, microglial function, behavioral response to drugs of abuse, and epigenetic regulation in the brain18,19,59,60. As a functional measure of changed microbiome composition we analyzed levels of the eight most abundant SCFA in Wt and Shank3KO mice. Shank3KO mice exhibit alterations in two of the eight metabolites tested, with perhaps the most notable being a large decrease in levels of acetate which are further exacerbated by antibiotic depletion (Fig. 5). Acetate is known to function as a histone deacetylase inhibitor and it serves as a substrate for acetyl-CoA which is necessary for histone acetylation, thus giving acetate the potential to serve as an important epigenetic regulator. Indeed, recently published work has demonstrated that gut-derived acetate can affect levels of histone acetylation in the brain in behaviorally meaningful ways60. This positions acetate as a potential mechanism for this signaling pathway in Shank3KO mice.
In addition to changes in SCFA, our Shank3KO mice also exhibited alterations in levels of multiple amino acids (Fig. 5A). While functional consequences of these changes in the pathophysiology of ASD is not fully clear, there are two amino acids of particular note from our findings. The first is that Shank3KO leads to an increase in levels of methionine. Methionine is an essential amino acid, and there have been some mixed reports of changes of methionine levels in patients with ASD61. Interestingly, methionine is required to create s-adenosyl-methionine which is the functional group attached to histones and DNA to alter epigenetic regulation of gene expression62. Secondly, we see that levels of phenylalanine are increased both by Shank3KO and by microbiome depletion (Fig. 5D). Increases in phenylalanine due to inborn errors of metabolism are well known to produce autism-like behavioral symptoms amongst a constellation of other symptoms in patients with phenylketonuria63. While less well studied, changes in serum levels of phenylalanine have also been reported in patients with idiopathic ASD64.
In addition to the metabolomics analysis, we also performed predicted functional genetic pathways from the microbiomes of Wt and Shank3KO mice using PICRUSt 227. From this analysis Shank3KO animals were predicted to have reduced spore formation65. Bacterial groups that are primarily responsible for spore formation belong to the Firmicutes Phyla and Class Clostridia and Bacilli - all of which were decreased in Shank3KO mice and hence explains the predicted decrease in spore forming proteins. Moreover, KEGG Orthology metagenomic predictions also showed a decrease in enzymes involved in the production of SCFA’s such as phosphate butyryltransferase and butyrate kinase and metabolic path abundance analysis confirmed a decrease in SCFA metabolic pathways in KO animals. Taken together, our findings demonstrate a robust change in composition and functional status of the microbiome due to Shank3 gene deletion.
ASD-like behavioral phenotypes are exacerbated by microbiome depletion
To assess the effects of the gut microbiome on behavioral phenotypes in Shank3KO mice we completed a battery of behavioral tests. The first was the three chambered social interaction test, on which we see that while Wt mice form a preference for the social chamber, Shank3KO mice and Wt mice with depleted microbiomes do not form a significant social preference (Fig. 6). While the initial paper describing the Shank3KO mouse line did not see these social deficits22, there were some differences in the way the behavior was carried out (our mice were younger, and the habituation protocol was slightly different), and social deficits have been commonly reported in other Shank3 mouse lines66. Of particular interest for this study was that our Shank3KO mice treated with antibiotics actually formed an aversion for the social chamber (Fig. 6A). While some groups use the social interaction preference as a binary preference/no preference measure, our results were highly consistent between cohorts, so we used between group comparisons of interaction ratios to add depth to our analysis (Fig. 6B). Here, we see that antibiotic treatment reduced the social interaction in both genotypes, and lead to a markedly lower level of social interaction in the Shank3KO mice. It has long been posited that changes in the gut microbiome can have effects on social behavior67. However, it is interesting to see this interaction between genotype and microbiome depletion in a genetically valid model for ASD.
When we examined anxiety and compulsive-like behaviors we see similar patterns of genotype and microbiome depletion. On the open field, Wt and Shank3KO mice of either treatment group showed no change in total locomotor activity (Fig. 7A). Interestingly, Drapeau et al reported a marked decrease in ambulatory activity in Shank3KO mice22. However, they assayed for a full hour and the differences were all observed in the final 50 minutes of the hour. Since we only used a ten-minute task the results are similar between the two studies. When time in the center of the open field was examined Shank3KO mice showed decreased time in the center vs. the periphery, and this anxiety-like effect was further exacerbated by microbiome depletion (Fig. 7B). On the marble burying task, the Shank3KO mice showed a decrease in marble burying as previously reported22, and on pairwise post-hoc testing only that Shank3KO-Abx mice were significantly decreased compared to Wt-H2O controls. Taken together, our findings suggest the possibility of a gene x microbiome risk for ASD-like behaviors in which mice carrying ASD-associated gene mutations are more sensitive to behavioral effects of microbiome manipulations.
Differential effects of microbiome depletion on cortical gene expression in Wt and Shank3KO mice
Previous reports have demonstrated that mice born germ free or with their microbiome altered by antibiotics have differential gene expression in the brain6,8,18. To assess how Shank3 gene deletion might alter this, we performed RNA-sequencing of the mPFC in our model. When the two water control groups were compared, we find that Shank3KO results in alteration in the expression of several hundred genes with predicted functional roles in cell organization and response to external stimuli (Fig. 8). When we examined the effects of microbiome depletion on PFC gene expression, we find that there are relatively few genes affected in Wt animals (Fig. 9A). However, when Shank3KO mice had their microbiome depleted there were nearly ten-fold as many significantly regulated genes (Fig. 9B) with predicted functions related to ion channel complexes and cellular structure (Fig. 9C-E). Interestingly, the genes that were altered by microbiome depletion in the Wt mice were almost entirely distinct from those changed in Shank3KO. These data again show an interesting susceptibility of the Shank3KO mice to changes in the composition of the gut microbiome.
Conclusions
Here we utilized a genetically valid model of ASD lacking both copies of the Shank3 gene. We find that these mice have marked differences in the composition and functional output of their gut microbiome. Additionally, these mice were more susceptible to the behavioral and transcriptional effects of gut microbiome depletion. These experiments provide important additional data for a gene x microbiome interaction in the pathophysiology of ASD. Future studies will focus on specific microbiome and metabolite targeted interventions that can reduce ASD-like deficits in mice and have the potential to lead to bench to bedside translational research in ASD.
Acknowledgements
This work was supported by funds from the NIH to D.D.K. (DA-044308) as well as funds from the Seaver Family Foundation to D.D.K. and A.O. Metabolomics assays were performed at the University of Pennsylvania Metabolomics Core.
References cited


