

Abstract
Background Iron trafficking and accumulation has been associated with Alzheimer’s disease (AD) pathogenesis. However, the role of iron dyshomeostasis in early disease stages is uncertain. Currently, gene expression changes indicative of iron dyshomeostasis are not well characterised, making it difficult to explore these in existing datasets.
Results We identified sets of genes predicted to contain Iron Responsive Elements (IREs), and used these to explore iron dyshomeostasis responses in transcript datasets involving (1) cultured cells under iron overload and deficiency treatments, (2) post-mortem brain tissues from AD and other neuropathologies, (3) 5XFAD transgenic mice modelling AD pathologies, and (4) a zebrafish knock-in model of early-onset, familial AD (fAD). IRE gene sets were sufficiently sensitive to distinguish not only between iron overload and deficiency in cultured cells, but also between AD and other pathological brain conditions. Notably, we see changes in 3’ IRE transcript abundance as amongst the earliest observable in zebrafish fAD-like brains and preceding other AD-typical pathologies such as inflammatory changes. Unexpectedly, while some 3’ IRE transcripts show significantly increased stability under iron deficiency in line with current assumptions, many such transcripts instead show decreased stability, indicating that this is not a generalizable paradigm.
Conclusions Our results reveal iron dyshomeostasis as a likely early driver of fAD and as able to distinguish AD from other brain pathologies. Our work demonstrates how differences in the stability of IRE-containing transcripts can be used to explore and compare iron dyshomeostasis responses in different species, tissues, and conditions.
Introduction
Alzheimer’s Disease (AD) has evaded effective treatment for decades. With the failure of numerous recent amyloid beta-focused drug trials [1–4] it has become increasingly important to explore other factors contributing to the disease. Since the early days of AD research, iron trafficking and accumulation has been observed to be altered in AD [5–9]. Discoveries over the past decade suggest that disruptions to iron homeostasis drive feedback loops that result in further pathology in AD. Altered iron homeostasis has often been viewed under the lens of the amyloid hypothesis through its role in facilitating amyloid-mediated toxicity [10–14]. Central to the amyloid hypothesis was the finding that mutations in particular genes caused an early-onset familial form of AD (fAD), and this was explained by the ability of these mutations to alter production of the amyloid beta peptide in some way [15]. A recent hypothesis paper re-interpreted many of these studies without assuming a central role for amyloid and promoted an alternative idea of iron dyshomeostasis as a common unifying effect of mutations causing fAD [16]. Although not yet directly tested in fAD patients or in a fAD model, the hypothesis is consistent with the role of iron in many critical biological processes including cellular respiration, hypoxia, and immune responses, all of which are disrupted in AD. The ability of iron to cycle through its oxidation states is fundamental to its diverse biological functions, but can also result in oxidative damage to cells. This has led to the evolution of tightly regulated homeostatic mechanisms to control iron availability and minimise toxicity (reviewed in [17]).
Currently, gene expression patterns representing responses to iron dyshomeostasis are not well-characterised. Cellular responses to iron dyshomeostasis are complex and involve several systems and layers of regulation. The stability of the transcription factor HIF1a, (a component of HIF1, a master regulator of responses to hypoxia) is regulated by an iron-dependent mechanism so that transcriptional responses to iron deficiency can resemble hypoxia responses [18]. However, cellular iron homeostasis is also regulated at the post-transcriptional level by the IRP/IRE system [19–21]. In this system, altered levels of available ferrous iron (Fe2+) cause Iron Responsive Proteins (IRP1 or IRP2) to change conformation or stability respectively [22,23]. This alters their ability to bind cis-regulatory Iron Responsive Element (IRE) stem-loop motifs in the 3’ or 5’ untranslated regions (UTRs) of genes encoding products related to iron metabolism. Only a few IRE-containing genes have been characterised in detail, including TfR1 (transferrin receptor 1; 3’ UTR IRE), DMT1 (divalent metal transporter 1; 3’ UTR IRE), H- and L-ferritin (both 5’ UTR IRE), and ferroportin (5’ UTR IRE) [21]. In general, these well-characterised IRE-containing genes suggest that IRPs binding to 3’ IREs tend to stabilise transcripts to increase protein translation, while binding to 5’ IREs suppresses translation [20]. Currently however, global gene expression changes mediated by the IRP/IRE system have not been well-characterised, and the overall expression patterns of IRE-containing genes have not been explored in the context of AD. In addition, it is unclear how expression of these genes might differ between AD and other neurodegenerative diseases, or how AD risk factors such as aging and hypoxia might contribute.
In this study, we utilised the SIREs (Searching for Iron Responsive Elements) tool [24] to predict and identify sets of IRE-containing genes in human, mouse, and zebrafish. We then applied these gene sets to explore overall IRP/IRE-mediated iron dyshomeostasis responses in datasets involving: (1) a cultured cell line subjected to iron overload and deficiency treatments, (2) a cohort of AD patients, healthy controls, and two other pathological conditions affecting the brain, (3) 5XFAD mice used to model the amyloid and tau pathology seen in AD, and (4) a zebrafish knock-in model possessing a fAD-like mutation.
Our IRE gene sets displayed significant enrichment in AD, the 5XFAD mouse model, and an fAD-like zebrafish model, demonstrating for the first time the early and extensive involvement of IRP/IRE-mediated iron dyshomeostasis responses in the context of AD. IRE gene sets were sufficiently sensitive to distinguish not only between iron overload and deficiency in a cultured cell line dataset, but also between AD and other pathological conditions affecting the brain (pathological aging and progressive supranuclear palsy), implying that the dysregulation of IRE-containing genes and iron dyshomeostasis responses in AD could differ from other conditions. Overall, our observations do not support the current assumption that IRP binding to 3’IREs generally stabilizes transcripts as both increases and decreases in abundance of transcripts with either 3’ or 5’ IREs were observed under most conditions.
Results
1. Defining sets of genes containing Iron Responsive Elements (IREs)
We utilised the SIREs (Searching for Iron Responsive Elements) tool, to define species-specific IRE gene sets by searching for IRE and IRE-like motifs in the 3’ and 5’ untranslated regions (UTRs) of the reference transcriptomes of human (hg38), mouse (mm10), and zebrafish (z11). SIREs assigns a quality-score to all detected IREs, with “high-quality” scores corresponding to canonical IREs and “medium-quality” or “low-quality” scores reflecting deviations from the canonical IRE (alternative nucleotide composition in the apical loop, one bulge at the 3’ or one mismatch in the upper stem) that would still produce an IRE-like motif with the potential to be functional [24–28]. Figure 1 summarises the IRP/IRE interaction effects on transcripts and gives examples of canonical and non-canonical IREs.
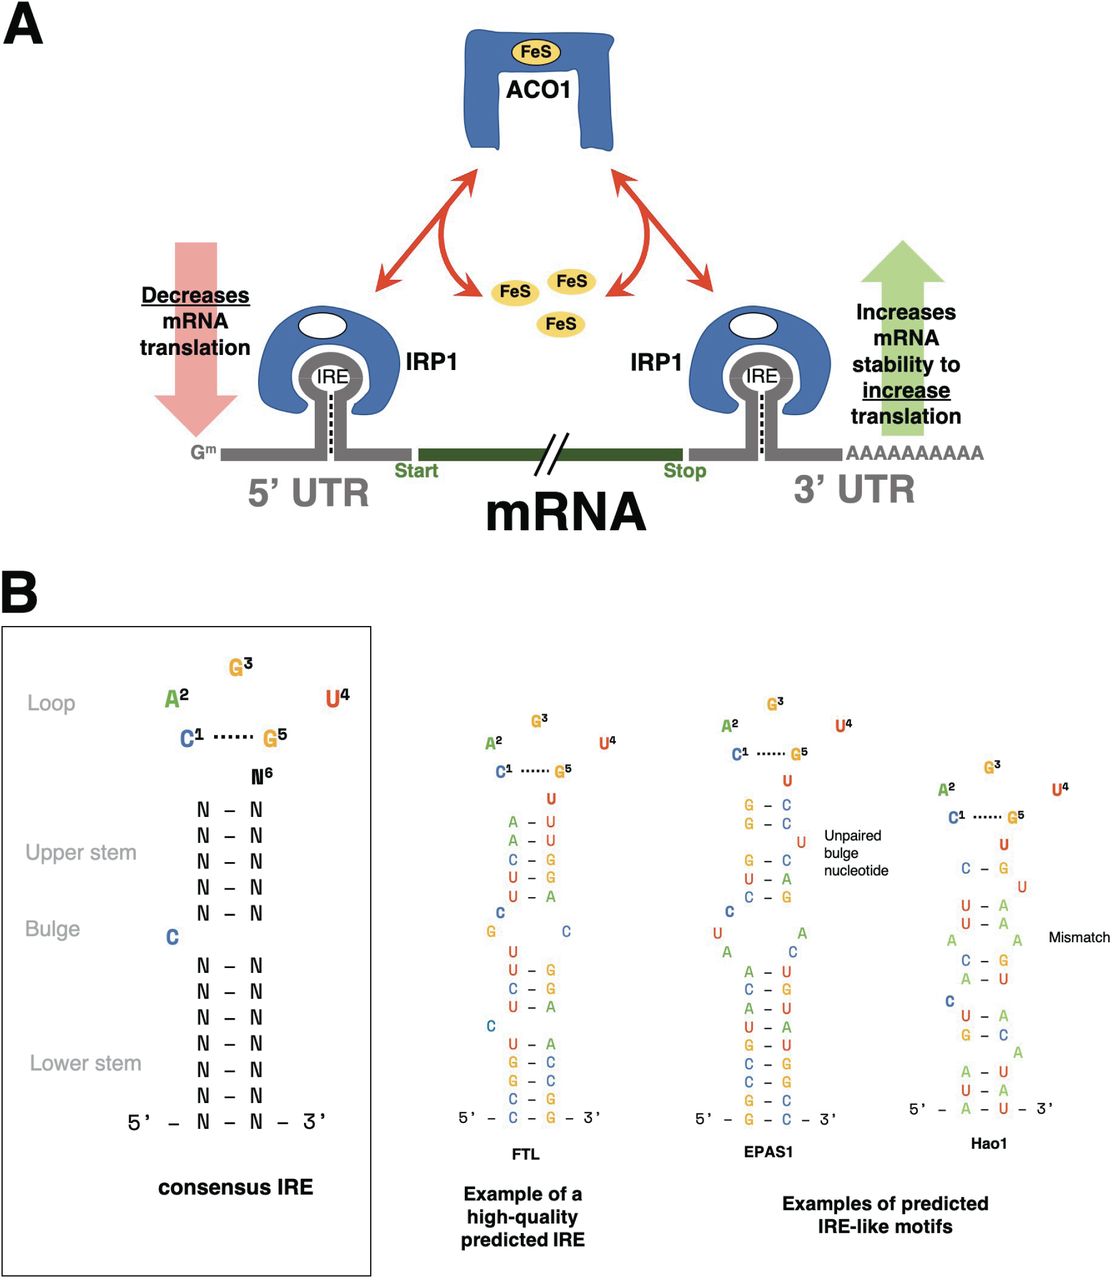
A. Model of altered transcript stability due to the IRP/IRE system under iron dyshomeostasis. When cellular iron levels (through FeS) are low, ACO1 will undergo a conformational transformation and act as an IRP to bind IREs in the 5’ or 3’ untranslated region (UTR) of genes involved in iron homeostasis. In general, genes with IREs in their 3’ UTR will be stabilised and increased in expression while genes with IREs in their 5’ UTR will have their translation inhibited by the IRP. B. Consensus IRE secondary structure and examples of high-quality and IRE-like motifs predicted by SIREs. IRE-like motifs with non-canonical structure are able to be detected by SIREs if they have up to one mismatch pair in the upper stem (e.g. Hao1) or 1 unpaired bulge nucleotide on the 3’ strand of the upper stem (e.g. EPAS1). For more details on the prediction of non-canonical IRE motifs, please refer to Figure 1 of Campillos et al. [24].
We defined four gene sets for each species as follows: HQ 3’ IREs (high-quality predicted 3’ IRE genes), HQ 5’ IREs (high-quality predicted 5’ IRE genes), all 3’ IREs (including all low, medium, and high-quality predicted 3’ IRE genes), and all 5’ IREs (including all low, medium, and high-quality predicted 5’ IRE genes). The size of these gene sets for each species and the overlap present is shown in Figure 2 and the gene sets are provided in Supplementary Table 1. Overall, searching through human UTRs uncovered the largest number of predicted IRE genes, followed by mouse, and then zebrafish. Overlap between homologous genes from the IRE gene sets of different species was generally poor. The largest sets of genes shared between species were consistently found between human and mouse, which is reflective of their closer evolutionary divergence. While not many high-quality IRE genes were identified across all three species, the few we identified are consistent with known and well-characterised IREs in the literature [29,30]. For example, the single shared HQ 3’ IRE gene between the three species was TFRC (transferrin receptor), while the shared HQ 5’ IRE genes between the three species included FTH1 (ferritin heavy chain 1) and ALAS2 (5’-aminolevulinate synthase 2).

The number of genes in the gene set for each species is shown at the bottom-left bars of each UpSet plot, while genes with shared homologs across species are indicated in the main plot region. IRE genes in mouse and zebrafish gene sets were excluded from this plot if they did not have a human homolog.
2. IRE gene sets are over-represented within up-regulated AD genes, but overall not well-represented in existing gene sets
We explored the biological relevance of the predicted IRE gene sets described above by testing whether genes within them were over-represented in existing MSigDB gene sets. We limited our analysis to gene sets from the following collections : Hallmark (non-redundant sets of ∼200 genes each representing various biological activities), C2 (gene sets from databases including KEGG and Reactome and published studies), C3 (gene sets containing genes with motif elements), and C5 (gene sets based on gene ontology terms) (see Methods). We performed over-representation analysis for the predicted IRE gene sets (all 3’ IREs and all 5’ IREs) separately for each species (human, mouse, zebrafish), and used Wilkinson’s meta-analytic approach to determine gene sets that were significantly over-represented across the three species’ IRE gene sets. Our results indicated that 1,148 of 10,427 tested gene sets displayed over-representation of IRE gene sets across all three species (Bonferroni-adjusted Wilkinson’s p-value < 0.05) (Supplementary Table 2). Remarkably, the “Blalock Alzheimer’s Disease Up” gene set from the C2 collection was significantly over-represented in both the sets of all 3’ IREs (Bonferroni-adjusted Wilkinson’s p-value = 3.9e-14) and all 5’ IREs (Bonferroni-adjusted Wilkinson’s p-value = 2.1e-26) in the meta-analysis, and was also the gene set with the most significant over-representation of the human all 3’ IREs set (Bonferroni-adjusted Fisher’s exact test p-value = 7.8e-58) (Supplementary Table 2). This supports that disturbance of iron homeostasis particularly distinguishes Alzheimer’s disease from other disease conditions and pathways represented within the C2 collection. In addition, the top 15 MSigDB gene sets showing the most significant over-representation generally differed between species. However, in all cases, a large proportion of IRE genes from the predicted IRE gene sets were not contained within any of these top-ranked MSigDB gene sets or within the Heme Metabolism geneset belonging to the Hallmark collection (Figure 3). This demonstrates that the predicted IRE genes we defined are not fully captured by existing gene sets and so may be uniquely useful for investigating gene expression changes during the IRE-IRP response to iron dyshomeostasis.
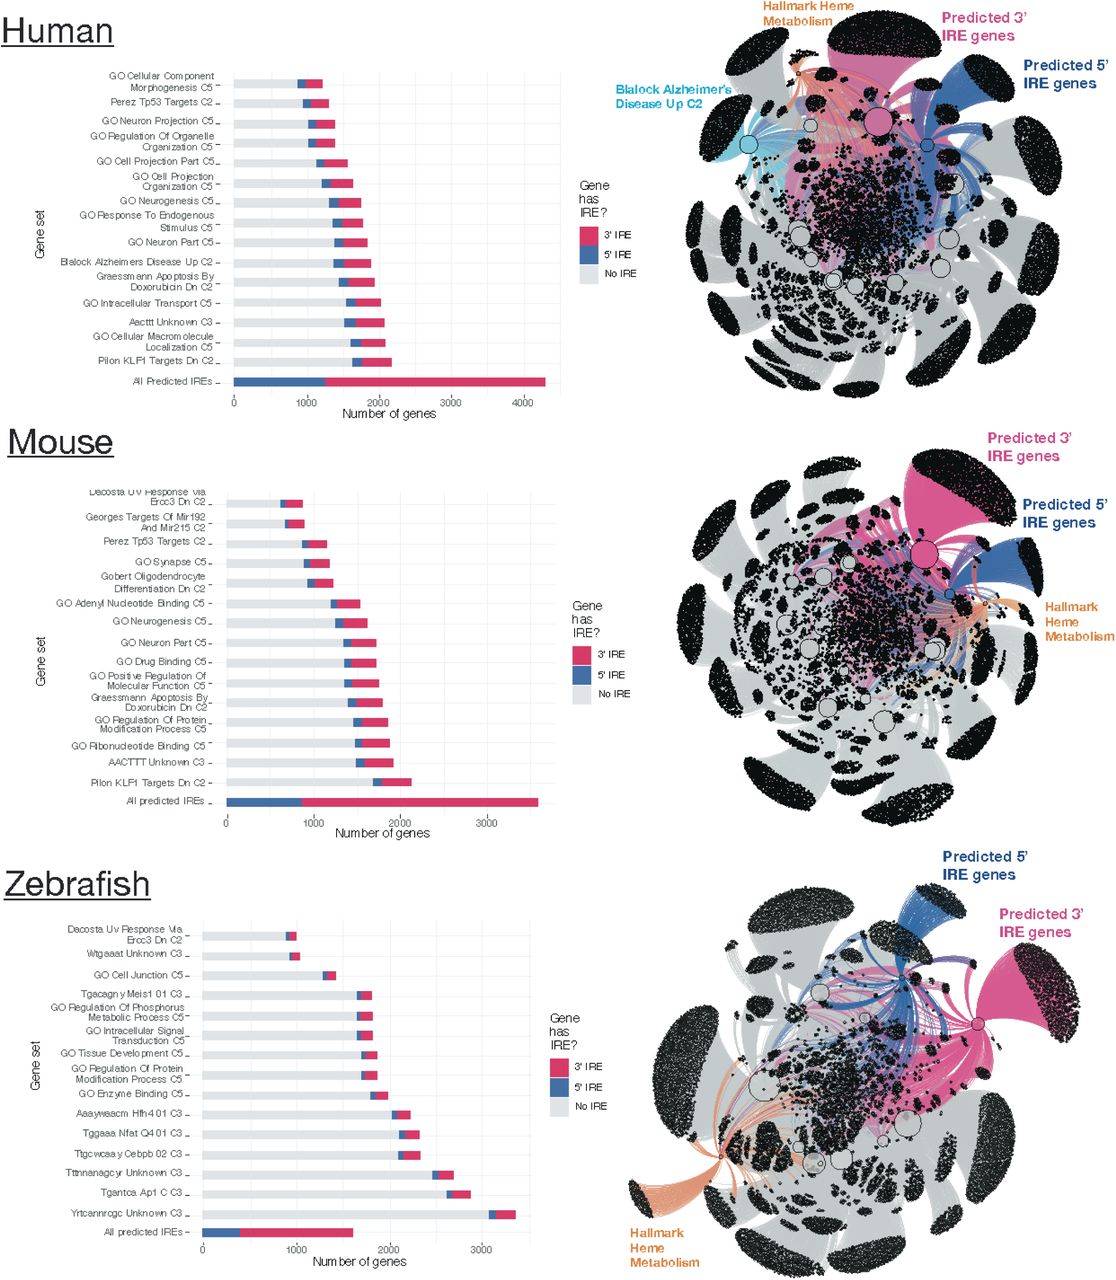
The top 15 MSigDB gene sets ranked by Fisher’s exact test p-value (testing for over-representation of the all 3’ IREs and/or all 5’ IREs sets) are shown for each species. In the network plots, the top 15 MSigDB gene sets are shown as large nodes, with genes represented as small nodes. Edges connecting genes to gene sets indicate the gene set(s) that a gene belongs to. Overall, the all 3’ IREs and all 5’ IREs gene sets have a large proportion of genes which are not included in any of the top ranked MSigDB gene sets for each species.
3. Involvement of transcription factor regulation within IRE gene sets
To be confident that IRE gene sets accurately capture information about the IRP/IRE-mediated responses, we needed to investigate possible co-ordinate regulation by other factors. As a starting point, we examined whether known binding motifs for transcription factors were significantly over-represented in the promoter regions of genes within each IRE gene set (all 3’ IREs, all 5’ IREs, HQ 3’ IREs, and HQ 5’ IREs) for each species. We detected significant over-representation of several transcription factors including the Klf14 motif in the zebrafish all 3’ IREs set (FDR-adjusted p-value = 0.049), the E2F motif in the human all 5’ IREs set (FDR-adjusted p-value = 0.049) and the Bach1 (FDR-adjusted p-value = 0.012), Nrf2 (FDR-adjusted p-value = 0.013), and NF-E2 (FDR-adjusted p-value = 0.019) motifs in the zebrafish HQ 5’ IREs set (Supplementary Table 3). This suggests that the expression of subsets of genes in some of the IRE gene sets may be influenced by other factors.
4. Gene set enrichment testing approach
Our predicted IRE gene sets can be used in any standard gene set enrichment testing approach to detect potential changes in iron homeostasis between conditions. Our workflow, which we later successfully apply on human, mouse, and zebrafish datasets, is shown in Figure 4. Due to variability in the results produced by different gene set enrichment testing methods, we were inspired by the EGSEA framework [31] to combine the results from different methods. Based on an initial analysis using EGSEA, we chose fry/mroast [32,33], camera [34], and fgsea [35,36] as the representative methods to use. (See Supplementary Figure 1 for a principal component analysis of results from different gene set enrichment analysis approaches.) A summary of the different characteristics of the three methods is shown in Table 1. The raw enrichment p-values from these approaches can be combined to obtain an overall enrichment p-value for each gene set. In accordance with EGSEA default parameters, we used Wilkinson’s method to combine raw p-values, and then applied adjustment for multiple testing on all combined p-values. Along with performing this gene set enrichment testing on our IRE gene sets, we also recommend using the same method to test for enrichment for the MSigDB Hallmark gene sets as the diverse biological activities they represent help to provide context for interpreting the IRE enrichment results. To explore further the results of IRE gene set enrichment analysis, we use UpSet plots to display the overlap between sets of “leading-edge” genes in the all 3’ IREs and all 5’ IREs gene sets. The leading-edge genes can be interpreted as the core (often biologically important) genes of a gene set that account for the significant enrichment as calculated by GSEA [36].

The section including identification of candidate 3’ IRE genes stabilised under iron deficiency was only applied to the fAD-like zebrafish dataset due to unavailable raw RNA-seq reads for the other datasets needed to identify expression of unspliced genes.
5. Differences in IRE gene set enrichment during iron deficiency and iron overload in a cultured cell line
We first tested how our enrichment approach illuminated the effects of iron overload and deficiency in a cultured cell line microarray dataset from Caco-2 cells (GEO accession: GSE3573). As only one cell type contributed to this dataset, interpretation of the IRE enrichment results is simplified by not having to consider the differing iron requirements of different cell types. This allowed us to focus on whether the iron dyshomeostasis treatments (iron overload and iron deficiency) could be detected and distinguished in terms of their IRP/IRE system-driven transcript abundance response. Because the dataset was from a microarray experiment, we performed only the differential gene expression and gene set enrichment testing portions of our workflow. The results of Principal Component Analysis and differential gene expression analysis are provided in Supplementary Figure 2.
In general, we found iron deficiency and iron overload treatments resulted in different gene expression responses. In terms of differential gene expression, iron deficiency was associated with 96 differentially expressed genes of which 10 possess predicted IREs while iron overload was associated with 212 differentially expressed genes (FDR-adjusted p-value from limma < 0.05) of which 33 possess predicted IREs (Supplementary Figure 2). There were 17 differentially expressed genes in common between iron deficiency and iron overload treatments, and all moved in opposite directions according to the treatment (i.e. increased abundance under iron deficiency and decreased abundance under iron overload, or vice versa). These differences between iron deficiency and iron overload were reflected in gene set enrichment analyses using the MSigDB Hallmark gene sets, where the gene sets involved and the proportions of gene transcripts with increased or decreased abundance differed (Figure 5A). As expected, IRE gene sets also showed significant enrichment under iron deficiency and overload conditions (Figure 5B) (Bonferroni adjusted p-value < 0.05).

A. Gene set enrichment testing results for human predicted IRE gene sets for the iron overload and iron deficiency treatments. Dots indicate if a gene set was considered significantly enriched (Bonferroni-adjusted p-value < 0.05) in the iron overload (on left) or iron deficiency (on right) treatment. B. Gene set enrichment testing results for MSigDB Hallmark gene sets in the iron overload and iron deficiency treatments. Dots indicate if a gene set was considered significantly enriched (FDR-adjusted p-value < 0.05) in the iron overload (on left) or iron deficiency (on right) treatments. C. UpSet plots showing overlap between iron overload and iron deficiency treatments in GSEA leading-edge genes for the “All predicted 3’ IRE genes” and “All predicted 5’ IRE genes” gene sets. The bars to the lower-left indicate the number of the leading-edge genes for iron overload and iron deficiency treatments, while the bars in the main plot region indicate the number of leading-edge genes which are unique or shared between the treatments.
We expected that iron deficiency would result in increased expression of genes with 3’ IREs under the IRP/IRE paradigm. However, both the 3’ and 5’ IRE gene sets displayed mixed patterns of increased and decreased expression under both the iron deficiency and iron overload treatments (Figure 5B). This indicates it would be difficult to distinguish between these conditions based purely on overall increases or decreases in the expression of IRE gene sets. Despite this, we see that the iron deficiency and iron overload treatments can be distinguished by their “leading-edge” genes (those genes contributing most to the enrichment signal for the predicted IRE gene sets (all 3’ IREs and all 5’ IREs) (Figure 5C). This supports that gene set enrichment using our predicted IRE gene sets is sufficiently sensitive to detect whether iron dyshomeostasis is present and to distinguish between different IRE-mediated gene expression responses in iron deficiency and iron overload treatments.
6. A distinct iron homeostasis response in human AD patients compared to other neuropathologies
Given that IRE gene sets could distinguish between iron overload and deficiency in a cultured cell line, we next tested our gene sets on a more complex data set including cerebellum and temporal cortex tissue samples from post-mortem human brains. The brains originated from either healthy controls or patients with one of three conditions: AD; pathological aging (PA), a condition involving amyloid pathology but no significant dementia symptoms; or progressive supranuclear palsy (PSP), a tauopathy without amyloid pathology [37]. An important characteristic of the dataset is that both cerebellum and temporal cortex tissue samples were available from each patient. A summary of the 236 patients whose data we included in this analysis is shown in Table 2 and the results of differential gene expression analysis and IRE gene set enrichment analysis are shown in Table 3 and Figure 6A. In our analyses, we focus mainly on comparing conditions within each tissue rather than between tissues. This is because we found significant differences in the AD vs. control comparison in the temporal cortex compared to the cerebellum (see Supplementary Figure 3).
Shaded cells indicate significant enrichment (Bonferroni-adjusted Wilkinson’s p-value from fry, camera, and fgsea < 0.05).

A. Enrichment analysis results of IRE gene sets in comparisons of AD (Alzheimer’s Disease), PA (Pathological Aging), and PSP (Progressive Supranuclear Palsy) vs. control. The proportions of IRE genes within each IRE gene set with increased, decreased, or unchanged expression are indicated as coloured bars. The dots indicate that the IRE gene set was significantly enriched (Bonferroni-adjusted enrichment p-value < 0.05). B. UpSet plots showing overlap between leading-edge IRE genes in comparisons of AD (Alzheimer’s Disease), PA (Pathological Aging), and PSP (Progressive Supranuclear Palsy) vs. control. The bars to the lower-left region of each UpSet plot indicate the number of leading-edge IRE genes for each comparison, while bars in the main plot region indicate the number of leading-edge IRE genes which are unique or shared between comparisons.
Overall, our IRE enrichment analyses indicate significant enrichment of IRE gene sets in all pathological conditions (AD, PA or PSP) compared to healthy controls within the cerebellum and temporal cortex (Figure 6A). In all pathological conditions, 3’ and 5’ IRE gene transcripts show overall mixed patterns of abundance (e.g. increased and decreased). Further examination of the leading-edge genes from these IRE gene sets gives more insight regarding potential differences and similarities between AD, PA, and PSP (Figure 6B). Overall, AD, PSP, and PA appear to involve distinct yet partially overlapping IRE gene expression responses in a tissue-specific manner. Within the temporal cortex, there are 435 3’ IRE leading-edge genes and 178 5’ IRE leading-edge genes exclusively present in the “AD vs. control” comparison. These are greater numbers than for the other two conditions. Interestingly, AD and PA share only relatively small numbers of leading-edge genes despite the fact that many regard PA as a prodrome of AD [38]. These observations suggest that iron dyshomeostasis may be an essential component of AD cognitive change. Interestingly, in the cerebellum, while AD and PSP share many 3’ and 5’ IRE leading-edge genes, PA is associated with a large number of unique leading-edge 3’ and 5’ IRE genes, further emphasising its difference from AD and also PSP. In general, our IRE gene sets appear sufficiently sensitive to discern and identify potentially interesting biological differences between these different pathological conditions affecting the brain.
7. Age-dependent disruption of IRE-driven iron homeostasis in the 5XFAD mouse model
Alzheimer’s disease is thought to develop over decades [39–41]. However, detailed molecular studies of AD brains can only be based on post-mortem tissues. To reveal the early molecular changes that initiate the progression to AD we must study the brains of animal disease models. Given that the IRE gene sets appear to work well in human datasets, we then tested our mouse IRE gene sets on an RNA-seq dataset derived from brain cortex tissue of the 5XFAD transgenic mouse AD model (GEO: GSE140286). The 5XFAD mouse is one of the most common systems used to model the amyloid beta and tau histopathologies of AD brains. It possesses two transgenes that include a total of five different mutations, each of which individually causes fAD in humans. In this dataset, the mice analysed were either 3, 6 or 12 months of age.
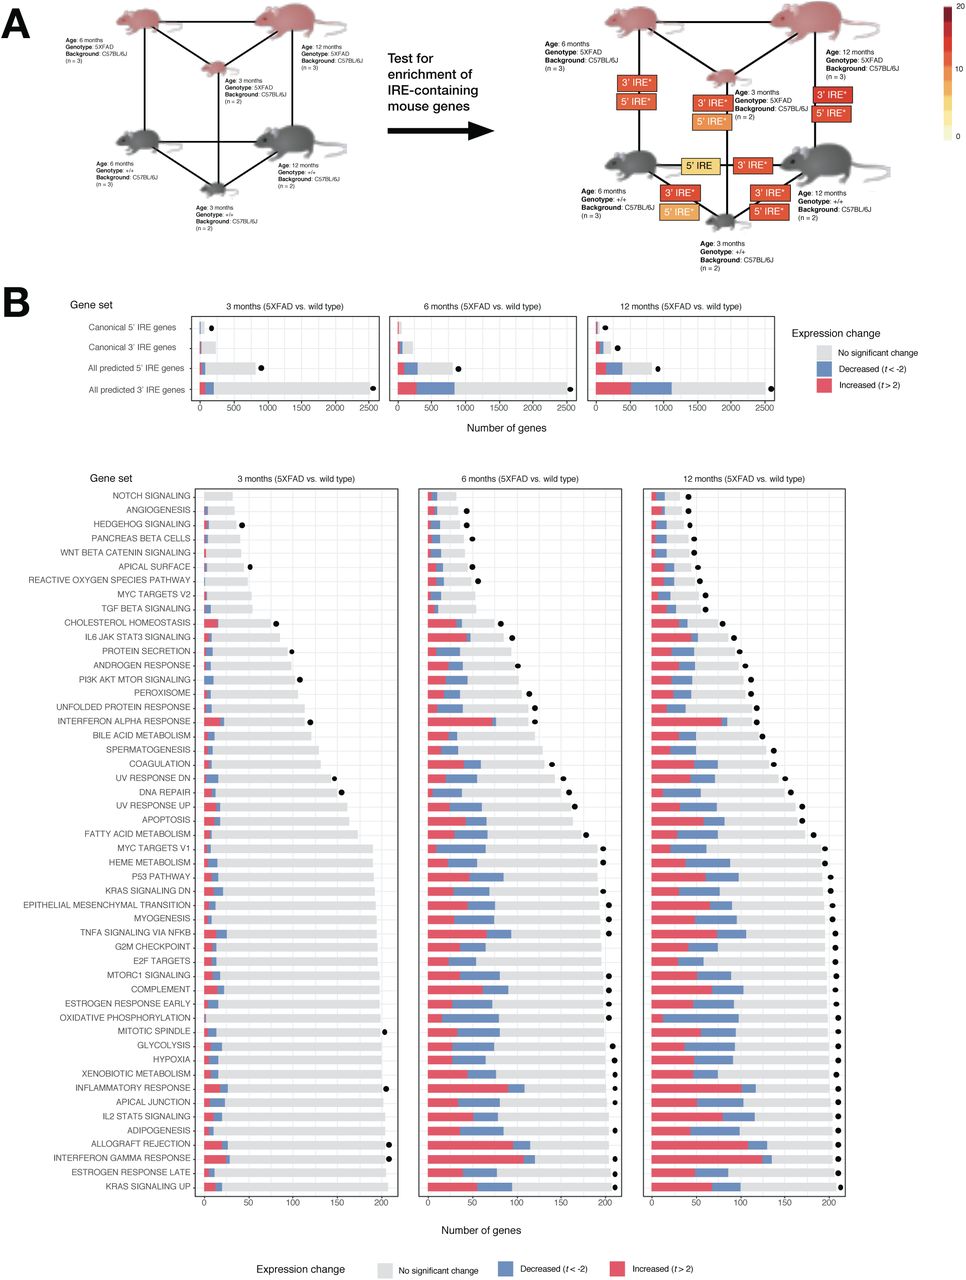
Using gene set enrichment testing methods as before, we observed significant enrichment of the all 3’ IREs and all 5’ IREs gene sets in several comparisons. These included 5XFAD vs. wild type comparisons and wild type aging comparisons (Bonferroni-adjusted enrichment p-value < 0.05) (Figure 7A). Notably, even the youngest age group of 5XFAD mutant mice (3 months) displayed significant enrichment of genes containing 3’ or 5’ IREs compared to age-matched wild types. This is consistent with an enrichment of immune-related Hallmark gene sets that we observed in this age group (see Figure 7B) and with a previous transcriptome analysis suggesting immune activation in 5XFAD mice as early as 2-4 months [42]. UpSet plots of overlapping leading-edge genes suggest that the IRE responses due to aging and due to the 5XFAD transgenes may involve partially overlapping gene expression changes (Figure 8). In addition, the UpSet plots reveal subsets containing large numbers of IRE-containing genes which uniquely contribute to enrichment of IRE gene sets in only one comparison (e.g. 256 3’ IRE genes only contribute to enrichment in the “5xFAD vs WT at 6 months” comparison). Notably, there are 126 shared 3’ IRE genes contributing to enrichment in the 5xFAD vs WT at 6 months” and 5xFAD vs WT at 3 months” comparisons, but no genes shared between these comparisons and the 5xFAD vs WT at 12 months” comparison. This suggests that enrichment of predicted IRE-genes (and hence the IRP/IRE-mediated response) may vary greatly between ages for this mouse AD model. Although beyond the scope of our current analysis, these subsets of genes may represent biologically distinct age-dependent iron dyshomeostasis responses caused by the transgenes which may be worthy of future investigation.

A. Experimental design and results of IRE gene set enrichment analysis. The gene sets all 3’ IREs and all 5’ IREs derived from searching for IRE sequences in the UTRs of genes in the reference mouse genome mm10 are represented here as “3’ IRE” and “5’ IRE” respectively. Asterisks (*) indicate that the gene set was significantly enriched in a particular comparison (Bonferroni-adjusted p-value < 0.05). B. Proportions of genes in IRE and MSigDB Hallmark gene sets which are increased (t > 2) or decreased (t < -2) in expression in all “5XFAD vs. wild type” comparisons. A dot next to a bar indicates that the gene set was significantly enriched (FDR-adjusted p-value < 0.05).

Numbers of genes for each intersection are shown above intersection bars.
8. Similarities in IRE-driven iron homeostasis responses during hypoxia and a familial AD-like mutation in a zebrafish model
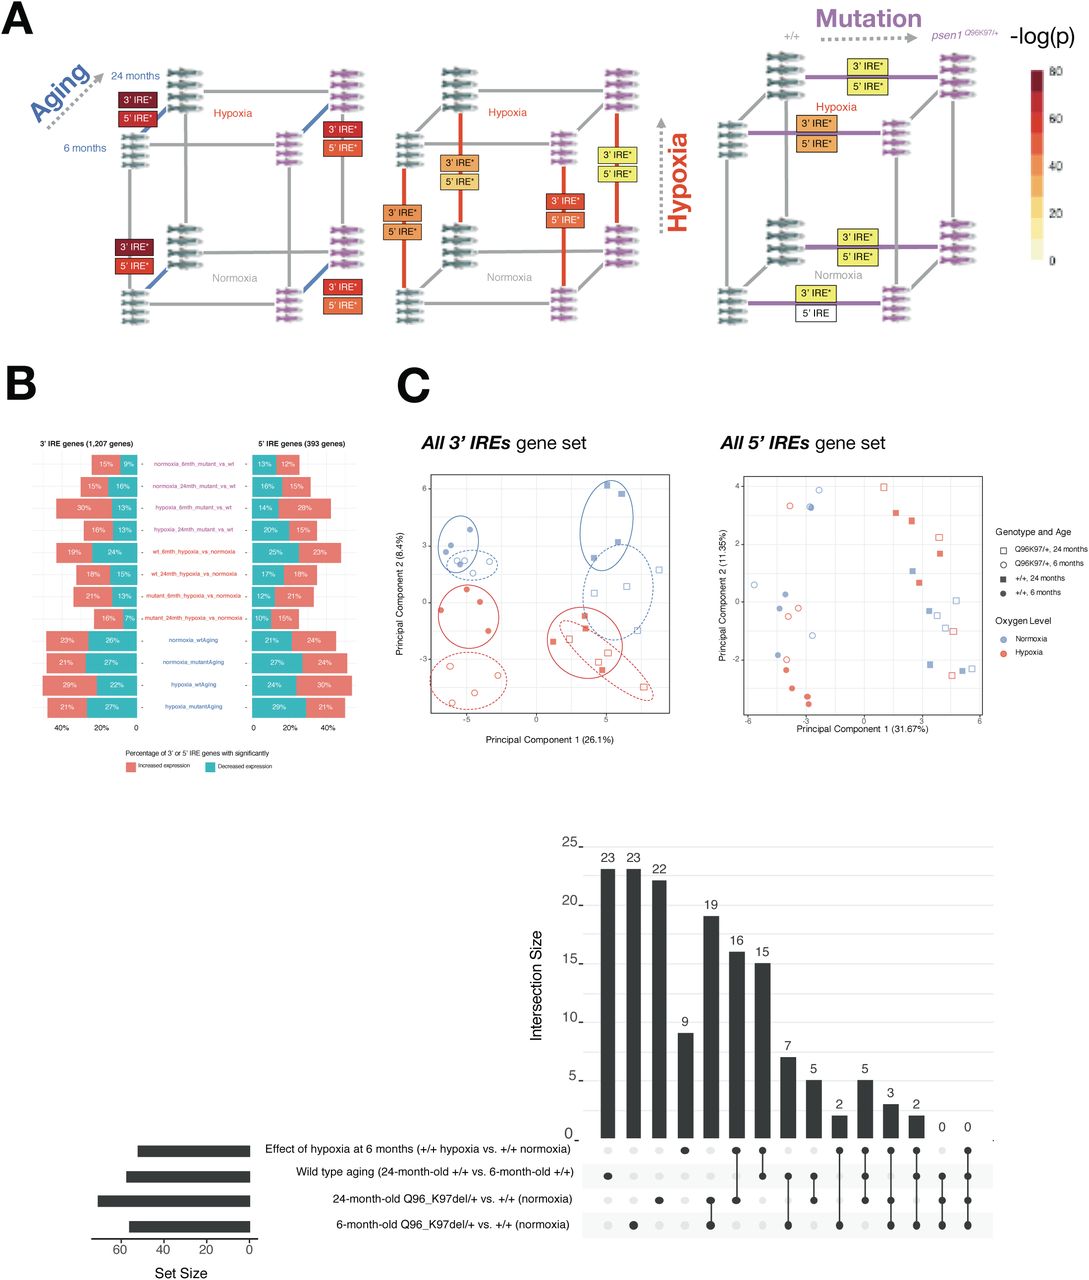
Concerns have been raised over the relevance of transgenic mouse models in modelling the early stages of AD (reviewed by [43]). In contrast, knock-in models of fAD only exhibit subtle pathological changes with little to no visible amyloid or tau pathology present [44]. However, because they more closely mimic the genetic state of fAD, knock-in models may reveal the early molecular changes that drive later fAD pathology. We had access to whole-brain RNA-seq data from a knock-in zebrafish model of fAD possessing a single fAD-like mutation in its endogenous psen1 gene (psen1Q96_K97del/+). Previous analysis of a subset of this dataset involving young adults (6-month-old brains) revealed gene expression changes related to altered energy metabolism [45]. (In contrast, the 3-month-old young adult 5XFAD mouse brain dataset is dominated by immune/inflammation responses, Figure 7B). Considering the critical role of iron homeostasis in energy metabolism, we decided to revisit this zebrafish dataset. We performed IRE gene set enrichment on the entire dataset in order to include exploration of the effects of aging and acute hypoxia (two important risk factors for sporadic late onset AD) and to analyse how these effects interact with the fAD-like psen1Q96_K97del/+ mutant genotype. The experimental design and the results of the differential gene expression analyses and gene set enrichment tests are summarised in Figure 9.
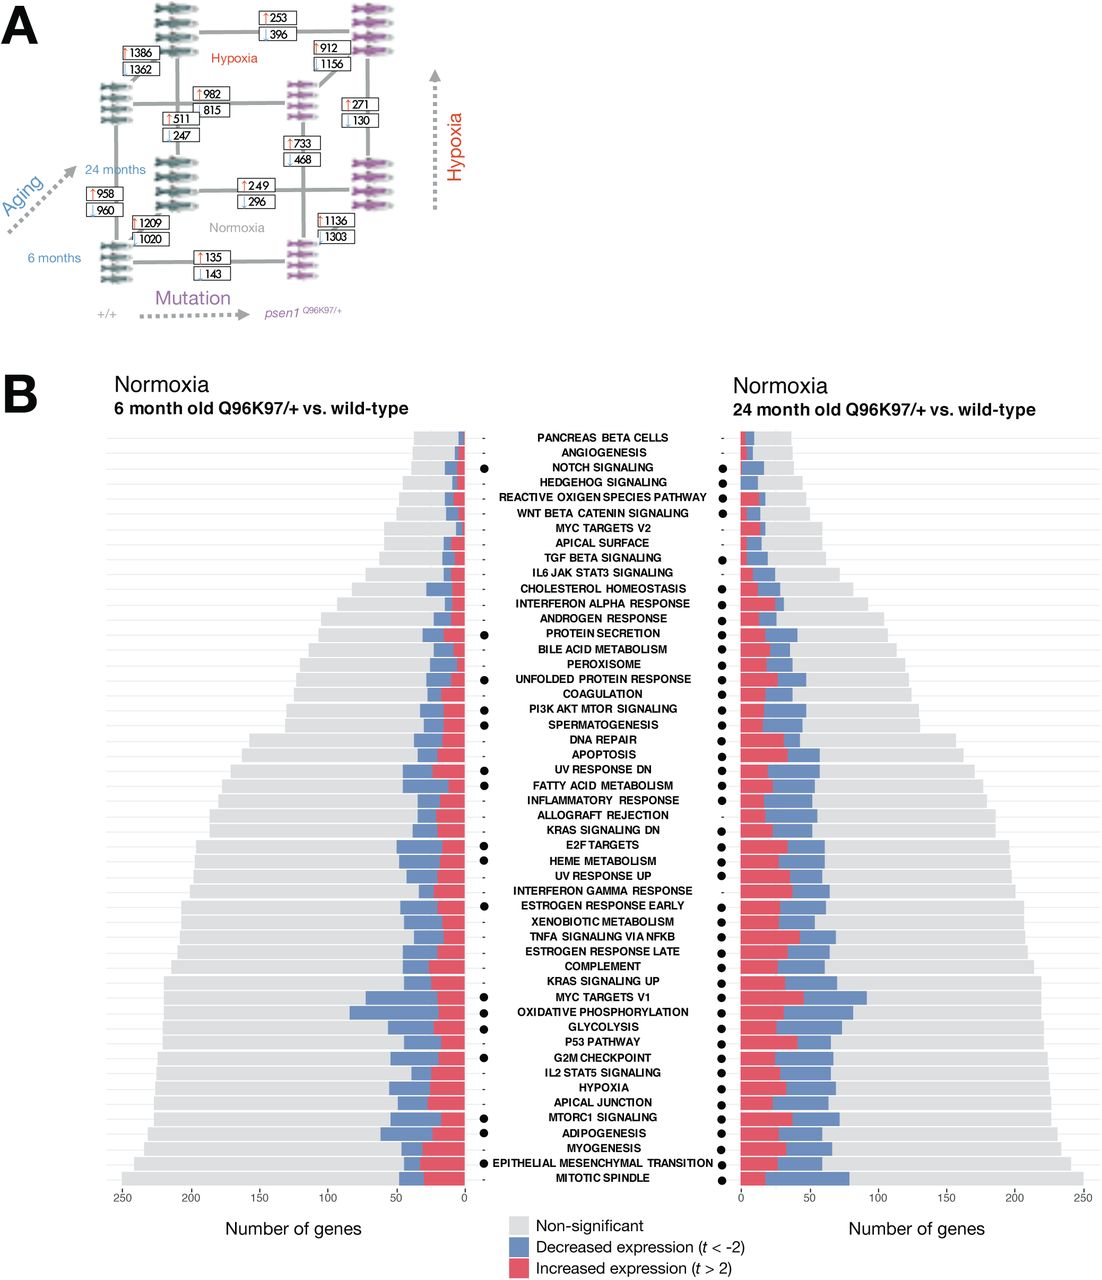
A. Results of differential gene expression analysis. Genes which were significantly increased or decreased in expression are indicated in boxes. These differentially expressed genes have FDR-adjusted p-value < 0.05. B. Gene set enrichment with MSigDB Hallmark gene sets. The comparisons between Q96_ K97del/+ fAD-like mutants and their wild-type siblings are shown for the 6-month-old (young adult) and 24-month-old (infertile adult) age groups. Dots indicate gene sets which are significantly enriched (FDR-adjusted p-value < 0.05).
We first turned our attention to the comparison between young adult (6-month-old) psen1Q96_K97del/+ mutant zebrafish and their wild-type siblings. At this age, gene expression changes in the mutant fish likely represent early stresses driving the development of fAD in humans. Gene set enrichment tests in this comparison identify alteration of energy metabolism-related Hallmark gene sets (e.g. OXIDATIVE PHOSPHORYLATION, GLYCOLYSIS) (Figure 9B) which is consistent with a previous analysis of gene ontology terms with this dataset [45]. In addition, we see enrichment of other gene sets including FATTY ACID METABOLISM, PI3K AKT MTOR SIGNALLING, MTORC1 SIGNALLING, and HEME METABOLISM. All of these gene sets which show enrichment in 6-month-old psen1Q96_K97del/+ mutants relative to wild-type siblings are also enriched in 24-month-old psen1Q96_K97del/+ mutants relative to their wild-type siblings (Figure 9B). This supports that the biological activities represented in these gene sets are amongst the earliest altered in this particular fAD mutation model.
In Lumsden et al. [16] we predicted that fAD mutations in the major locus PSEN1 would cause an early cellular deficiency of ferrous iron due to the observation of insufficient acidification of the endolysosomal pathway in in-vitro PSEN1 mutation studies [46,47]. In Newman et al. [45] we saw that GO analysis of 6 month old psen1Q96_K97del/+ zebrafish brain supported that lysosomal acidification was affected. Therefore, we decided to apply our IRE enrichment analysis to test for evidence of iron dyshomeostasis in these fish. The enrichment of the all 3’ IREs set in 6 month old psen1Q96_K97del/+ zebrafish brains supports that iron dyshomeostasis is an important stress in the early stages of fAD (Figure 10A).

A. Results of gene set enrichment testing using predicted IRE gene sets. We represent the gene sets all 3’ IREs and all 5’ IREs derived from searching for IRE and IRE-like sequences from z11 reference zebrafish gene UTRs as “3’ IRE” and “5’ IRE” in the panel. B. Proportions of predicted IRE genes which are increased (t > 2) or decreased (t < -2) in expression for each pairwise comparison in the dataset. C. Principal component analysis of all genes in the sets all 3’ IREs and all 5’ IREs for all samples. Circles on the 3’ IRE plot show that different conditions generally have distinct expression of genes in the all 3’ IREs set but not in the all 5’ IREs set. D. UpSet plot showing overlap in leading-edge genes for the “all predicted 3’ IRE genes” for select comparisons.
While almost all pairwise comparisons in the zebrafish dataset show significant enrichment of at least one IRE gene set (Figure 10A), the expression of IRE genes appears to differ in terms of the proportions of IRE-containing transcripts which show increased versus decreased abundance (Figure 10B). In addition, the Principal Component Analysis plot of expression of the all 3’ IREs set over all samples shown in Figure 10C suggests that different conditions appear to have distinct expression patterns of these genes. Across the first principal component, different age groups (6- and 24-month-old brains) differ in their expression of predicted 3’ IRE genes, while the second principal component appears to separate psen1Q96_K97del/+ mutants from their wild-type siblings. This separation between psen1Q96_K97del/+ mutants and wild type siblings is even more pronounced when both are exposed to hypoxia.
To gain more insight into the similarities and differences between the IRE responses in the psen1Q96_K97del/+ vs. wild type comparison, we plotted UpSet plots of overlapping leading-edge genes (Figure 10D). These plots suggest that the IRE responses during hypoxia, aging, and due to this fAD-like mutation are mostly distinct from each other with unique leading-edge genes. However, similarities in the IRE response between different conditions are suggested by the existence of some shared leading-edge genes. For example, for the set of all 3’ IREs, the “6-month-old psen1Q96_K97del/+ vs. wild type” comparison shares 19 leading-edge genes with the “24-month-old psen1Q96_K97del/+ vs. wild type” comparison. As an initial exploration of the biological relevance of these genes, we submitted them to the STRINGR tool. This indicated that the proteins products of these genes were significantly associated with each other (e.g. in terms of text-mining from Pubmed articles, experimentally determined interactions, and co-expression). These proteins were significantly over-represented in the sets “MAPK pathway”, “AP-1 transcription factor”, “Jun-like transcription factor”, and “signaling by TGF-beta family members” (FDR-adjusted over-representation p-value < 0.05; Supplementary Figure 4). The AP-1 and MAPK pathways have previously been shown to be stimulated by iron depletion [48,49]. Therefore, mechanistically, it is possible that the IRE-IRP response to iron dyshomeostasis in the fAD-like zebrafish mutant might involve these pathways, although this requires confirmation in vivo.
The fact that aging, hypoxia, and a fAD-like mutation all cause changes in the abundance of IRE-containing transcripts in zebrafish raised concerns regarding the specificity of such changes. Therefore, as a negative control, we examined changes in IRE transcript abundance in a brain transcriptome dataset derived from zebrafish heterozygous for a psen1 mutation now thought not to be fAD-like, psen1K97fs [50]. In this dataset, psen1K97fs/+ zebrafish are compared to their wild type siblings at 6 and 24 months. We tested this dataset for enrichment using our zebrafish 3’ and 5’ IRE gene sets but found no significant enrichment of any of our predicted IRE gene sets in psen1K97fs/+ vs. wild type comparisons at any age (Table 4; Supplementary Figure 5). Reassuringly, we still observed significant enrichment of both 3’ and 5’ IRE gene sets during wild type aging (24-month-old wild types vs. 6-month-old wild types), consistent with the equivalent comparison in the psen1Q96_K97del/+ dataset. These results support that IRE-containing transcript abundance changes are sufficiently sensitive to reflect differences in iron homeostasis between different mutation models.
Raw p-values from fry, camera and fgsea were combined with Wilkinson’s method, with combined p-values then Bonferroni-adjusted for multiple testing. The same process was repeated for the K97fs/+ dataset, which involves an independent family of fish (shaded cells).
9. Simultaneous stabilisation of some 3’ IRE transcripts and destabilisation of others
In the cultured cell line dataset analysed above, we noticed that even a straightforward iron deficiency treatment resulted in the simultaneous increase and decrease in expression of 3’ IRE-containing genes. These findings are difficult to reconcile with the current paradigm that stabilisation of 3’ IRE-containing genes occurs under iron deficiency and suggest that the current model of the IRP/IRE system may be incomplete or insufficient for describing the regulation of non-canonical IREs. Given that many predicted 3’ IRE genes with non-canonical IREs (e.g. in the all 3’ IREs set) displayed enrichment and different gene expression patterns in the fAD-like zebrafish dataset, we decided to explore further the stability changes of these genes by comparing the expression of spliced and unspliced transcripts for each gene (Supplementary Text 1). We found that transcripts of some predicted 3’ IRE genes were significantly increased in stability while others were significantly decreased in stability (Supplementary Figure 5; Supplementary Table 4).
Discussion
In this study we successfully identified sets of genes predicted to contain IREs in human, mouse, and zebrafish, and applied these gene sets to gain insight into the IRP/IRE system of post-transcriptional responses to iron dyshomeostasis. We found that IRE genes are generally not well-represented in the existing gene sets in MSigDB. Importantly, these gene sets are most significantly over-represented in an existing gene set previously shown to be up-regulated in AD brains (the “Blalock Alzheimer’s Disease Up” gene set from MSigDB). This supports the importance of iron dyshomeostasis in sporadic late onset Alzheimer’s disease. Furthermore, our IRE gene sets displayed significant enrichment in postmortem brains from a human AD cohort, from the 5XFAD mouse model, and from a zebrafish model of a fAD-like mutation. This demonstrates for the first time the involvement of a coordinated IRE-containing gene expression response to iron dyshomeostasis in the context of AD.
The relatively tightly controlled conditions in the mouse and zebrafish model datasets revealed a strong age-dependent effect on the transcript abundances of these predicted IRE-containing genes. Notably, 3’ IRE gene expression changes were amongst the earliest changes observable in the zebrafish fAD-like mutation model alongside changes in energy metabolism. These 3’ IRE gene expression changes preceded other signals of pathological change in the transcriptome (such as altered expression of inflammatory response pathways) commonly associated with AD. In addition, IRE gene sets were sufficiently sensitive to distinguish not only between iron overload and deficiency in a cultured cell line dataset, but also between AD and other pathological conditions affecting the brain (i.e. pathological aging and progressive supranuclear palsy). This suggests that the dysregulation of IRE-containing genes and iron homeostasis in AD may differ from other conditions. Whether iron deficiency or iron overload was present in the AD brain tissue samples (taken from either temporal cortex or cerebellum) was unclear.
Most previous work has assumed that accumulation of iron in the brain with age (a phenomenon observed broadly across animal phyla [51,52]) is indicative of cellular iron overload. However, a recent publication by [53] showed that disturbed lysosomal function leading to increased lysosomal pH causes a deficiency of functional ferrous iron (Fe2+) while non-functional ferric iron (Fe3+) accumulated in lysosomes. The deleterious effects of this on the brains of mice (defective mitochondrial biogenesis and function and stimulation of inflammatory responses) could be alleviated by increasing the levels of iron in their diet. The observations of Nixon and colleagues that acidification of the endolysomal pathway is affected both by fAD mutations in PSEN1 [46] and excessive dosage of the APP gene [54], together with our observations from our fAD-like psen1Q96_K97del/+ mutant zebrafish, support the possibility that fAD brains may suffer a ferrous iron deficiency in a background of ferric iron overload. Intriguingly, the greatest genetic risk factor for late onset AD, the ε4 allele of the gene APOE, appears to increase lysosomal pH [55] but ε4’s increased risk of AD is alleviated in individuals who possess the HFE 282Y allele that predisposes to the iron overload disease hemochromatosis [56]. Given that many other risk loci for sporadic late onset AD also affect endolysosomal pathway function (reviewed in [57]) it is reasonable to suggest that disturbed of iron homeostasis may afflict brains with this disease.
Outside our interest in AD, our analyses also revealed the surprising finding that 3’ IRE-containing genes could be both upregulated and downregulated by iron deficiency (at least in a cultured cell line). We also observed simultaneous stabilisation of some 3’IRE transcripts and destabilisation of others in our analysis of zebrafish brains. This challenges the simplistic paradigm of stabilisation of 3’ IRE-containing transcripts under ferrous iron deficiency. Previous research holds that under iron deficiency, 3’ IRE-containing genes such as DMT1 (divalent metal transporter and TFRC (transferrin receptor protein) are stabilised and hence increased in expression [23] in order to increase ferrous iron availability. However, our findings reveal that this same principle may not apply to other, less-characterised 3’ IRE-containing genes, including IREs deviating from the canonical IRE sequence. Many of these IRE-like sequences are likely to have some functionality [26–28], and their expression and stability changes in our analyses indicate that they are likely to be important in iron dyshomeostasis responses in AD. We emphasise the need to characterise further the stability of these predicted 3’ IRE-containing transcripts under conditions of altered iron availability to better understand iron dyshomeostasis responses at the gene expression level.
Collectively, our results strengthen the known association of iron dyshomeostasis with both fAD and AD in general, while also demonstrating how changes in the stability and abundance of IRE-containing transcripts can be used to give insight into iron dyshomeostasis responses in different species, tissues, and conditions.
The limitations of our study, the conservation of IRE gene sets between species, and the role of iron dyshomeostasis in AD are discussed further in Supplementary Text 2.
Materials and Methods
Reproducibility
Please see github.com/UofABioinformaticsHub/ireAnalysis for code to reproduce all analyses described below, in addition to .gtf files and R objects including the IRE gene sets for human, mouse, and zebrafish.
Defining IRE gene sets for human, mouse, and zebrafish
We extracted all 3’ and 5’ UTR sequences from the human, mouse and zebrafish genome assemblies using the Bioconductor packages BSgenome.Hsapiens.UCSC.hg38, BSgenome.Mmusculus.UCSC.mm10 and BSgenome.Drerio. UCSC.danRer11, and gene definitions from the Ensembl 94 release. Each set of UTR sequences was then submitted input into the SIREs web server (v.2.0 [24]). The SIREs algorithm assigns quality scores to predicted IREs taking into account whether the sequence is canonical, whether it contains any mismatches and bulges, and the free energy of the secondary structure. Canonical sequences are tagged by SIREs as being high-quality, while IRE-like sequences are tagged as low or medium quality. Given that High-quality IRE predictions miss the majority of true IREs, this enables a more comprehensive sampling of IRE motifs. For human, mouse, and zebrafish, we separately defined the following four gene sets: HQ 3’ IREs and HQ 5’ IREs (representing genes with high-quality predicted IREs), along with all 3’ IREs and all 5’ IREs, which included genes containing any predicted IRE in the respective UTR. Comparisons between gene sets were performed using the UpSetR package (v.1.4.0 [58]) with mappings between species obtained by BioMart [59].
Over-representation of IRE gene sets in existing MSigDB gene sets
We downloaded the following gene set collections from MSigDB (v.6.0 [60]): Hallmark, C2 (gene sets from online pathway databases and biomedical literature, including KEGG and the REACTOME databases), C3 (motif gene sets based on regulatory targets), and C5 (gene sets defined by Gene Ontology terms). We excluded the following collections from analysis: C1 (specific to human chromosomes and cytogenetic bands, while our analysis involves different species), C4 (computationally-defined cancer-focused gene sets), C6 (oncogenic signatures) and C7 (immunologic signatures). C4, C6, and C7 were not included as the level of detail in the gene sets in these specific collections is more domain-specific rather than broad-level. We used Fisher’s exact test to determine whether any IRE geneset was significantly over-represented in each MSigDB gene set. Gene sets were defined as having significant enrichment for IRE gene sets if the FDR-adjusted p-value from Fisher’s exact test was below 0.05. UpSet plots were produced using the UpSetR package (v.1.4.0 [58]) while network representations were produced in Gephi (v.0.9.3 [61]). To produce network visualisations, we exported node and edge tables from R. The nodes table contained the following gene sets: top 15 gene sets (ranked by Fisher’s exact test p-value), Hallmark Heme Metabolism gene set, all 3’ IREs, all 5’ IREs, and all genes contained within these gene sets. The edges table contained gene – gene set edges which indicated the gene set(s) that genes belonged to. To create the network plots, we used “Force Atlas 2” as the initial layout algorithm, followed by the “Yifan Hu” [62] layout algorithm to improve the separation between groups of genes.
Over-representation analysis of transcription factor motifs in IRE gene promoters
Defining promoter regions as being 1500 bp upstream and 200 bp downstream of the transcription start site for each gene, we used the findMotifs. pl script from HOMER (v.4.11) [63,64] to search for known transcription factor binding site (TFBS) motifs in the promoters of each IRE gene set. The HOMER Motif database contains 363 vertebrate transcription factor binding motifs based on analysis of high-quality public ChIP-seq datasets (http://homer.ucsd.edu/homer/motif/HomerMotifDB/homerResults.html). We considered TFBS motifs as being significantly enriched in a gene set if the FDR-adjusted p-value was less than 0.05.
Gene set enrichment testing
We performed all gene set enrichment tests in R v3.6.1 [65] using fry [32,33], camera [34], and fgsea [35,36]. For fry, and camera, we used model fits obtained using limma [66,67], whilst for fgsea, a ranked list was obtained using moderated t-statistics taken from limma. All genes were used in gene set enrichment tests (i.e. not just DE genes). We combined the raw p-values from fry, camera, and fgsea using Wilkinson’s method [68] with default parameters, followed by FDR-adjustment. All of this functionality is included in the combinedGSEA function (see GitHub). When performing gene set enrichment testing on the MSigDB Hallmark gene sets, we applied FDR-adjustment to combined p-values and defined significant enrichment as gene sets having an adjusted p-value < 0.05. When performing gene set enrichment on the four IRE gene sets (all 3’ IREs, all 5’ IREs, HQ 3’ IREs, HQ 5’ IREs), we applied Bonferroni-adjustment to combined p-values to further protect against Type I errors and defined significant enrichment as gene sets having an adjusted p-value < 0.05. Depending on the species in the dataset being analysed, we used the respective IRE gene sets defined for human, mouse, or zebrafish.
Analysis of the Caco-2 cultured cell line dataset
We downloaded processed microarray data from the GEO dataset GSE3573. This study investigated gene expression responses to iron treatments, including iron deficiency (cells treated with ferric ammonium citrate), and iron overload (cells grown in DMEM-FBS medium with hemin) [69]. We performed differential gene expression analysis using the “lmFit” and eBayes” functions in limma [66]. Genes were defined as differentially expressed when their FDR-adjusted p-value < 0.05.
Analysis of the Mayo Clinic RNA-seq dataset
We downloaded processed CPM count data from Synapse (https://www.synapse.org/#!Synapse:syn5550404). We matched cerebellum and temporal cortex samples by their patient ID, and only retained genes which were present across all samples and patients for which there were both cerebellum and temporal cortex samples (n=236 patients with measurements for cerebellum and temporal cortex, 472 samples in total). We performed analysis using limma [66,67] and determined differentially expressed genes between conditions. In addition, we used the “duplicateCorrelation” function in limma, setting the “block” parameter to the patient ID. Genes were considered differentially expressed if their FDR-adjusted p-value < 0.05.
fAD-like psen1Q96_K97del/+ zebrafish
The isolation of the psen1Q96_K97del mutation has previously been described [45]. Mutations were only analysed in the heterozygous state in this study.
Hypoxia treatment of female adult zebrafish
psen1Q96_ K97del/+ mutants and their wild-type siblings were treated in low oxygen levels by placing zebrafish in oxygen-depleted water for 3 hours (oxygen concentration of 6.6 ± 0.2 mg/L in normoxia and 0.6 ± 0.2 mg/L in hypoxia.
Whole brain removal from adult zebrafish
After normoxia or hypoxia treatment adult fish were euthanized by sudden immersion in an ice water slurry for at least ∼30 seconds before decapitation and removal of the entire brain for immediate RNA or protein extraction. All fish brains were removed during late morning/noon to minimise any influence of circadian rhythms.
RNA extraction from whole brain
Total RNA was isolated from heterozygous mutant and WT siblings using the mirVana miRNA isolation kit (Thermo Fisher). RNA isolation was performed according to the manufacturer’s protocol. First a brain was lysed in a denaturing lysis solution. The lysate was then extracted once with acid-phenol:chloroform leaving a semi-pure RNA sample. The sample was then purified further over a glass-fiber filter to yield total RNA. Total RNA was DNase treated using the DNA-free(tm) Kit from Ambion, Life Technologies according to the manufacturer’s instructions. Total RNA was then sent to the Genomics Facility at the South Australian Health and Medical Research Institute (Adelaide, Australia) to assess RNA quality and for subsequent RNA sequencing (using poly-A enriched RNA-seq technology, and estimated gene expression from the resulting single-end 75 bp reads using the reference GRCz11 zebrafish assembly transcriptome)
Pre-processing of RNA-seq data for fAD-like zebrafish dataset
RNA-seq libraries contained single-end 75bp Illumina NextSeq reads. We performed quality trimming with AdapterRemoval using default parameters, followed by quality assessment with FastQC and ngsReports. Trimmed reads were pseudo-aligned to the reference zebrafish transcriptome using Kallisto (v.0.45) [70] and transcript descriptions from Ensembl release 94. The “catchKallisto” function from edgeR [71] was used to import and summarise counts from transcript-level to gene-level, with all subsequent analyses performed at the gene-level.
Differential gene expression analysis for fAD-like zebrafish dataset
For differential gene expression analysis, we retained all genes with expression of at least 1 cpm in 4 or more samples, and used voomWithQualityWeights to downweight lower quality samples [67]. Contrasts were defined to include all relevant pairwise comparisons between conditions, and genes were considered as differentially expressed using an FDR-adjusted p-value < 0.05.
Estimation of spliced and unspliced gene expression in fAD-like zebrafish dataset
For spliced transcripts in Ensembl release 94, we additionally defined unspliced genes including intronic regions. Unspliced transcripts were appended to the end of the reference transcriptome and used to build a new Kallisto [70] index. Estimated counts for spliced transcripts and unspliced genes were imported into R using the “catchKallisto” function from edgeR [71].
Gene set enrichment tests for non-fAD-like (K97fs/+) zebrafish dataset
Please refer to [45] for details on RNA-seq data processing and analysis of the non-fAD-like dataset. In the current work, we used the gene expression counts matrix with limma. The voom, design, and contrasts objects produced as part of the limma analysis were used for gene set enrichment analysis with the zebrafish IRE gene sets we defined as well as the MSigDB Hallmark gene sets. Significantly enriched Hallmark gene sets had FDR-adjusted p-value < 0.05 while IRE gene sets were considered significantly enriched if the Bonferroni-adjusted p-value < 0.05.
Gene set enrichment tests for 7-day-old Q96_ K97del/+ dataset
Please refer to Dong et al. (GEO accession: GSE148631, manuscript in preparation) for details on RNA-seq data processing and analysis. In the current work, we used the gene expression counts matrix with limma to perform gene set enrichment analysis. IRE gene sets we defined as well as the MSigDB Hallmark gene sets. Significantly enriched Hallmark gene sets had FDR-adjusted p-value < 0.05 while IRE gene sets were considered significantly enriched if the Bonferroni-adjusted p-value < 0.05.
Differential transcript stability analysis
The estimated spliced and unspliced transcript count estimates from kallisto [70] were imported into R using the catchKallisto function from edgeR [71]. We used limma [66] to determine the logFC of spliced transcripts and unspliced transcripts for each comparison. To test for whether there was a significant difference in the logFC of the spliced and unspliced transcripts, we used Welch’s t-test with the s2.prior values from limma as the variances of the spliced and unspliced transcripts. We defined the null (no stabilisation of transcript) and alternate (stabilisation of transcript) hypotheses for each gene as follows, where s and u refer to the spliced and unspliced versions of a particular gene:

We defined genes with FDR-adjusted p-values < 0.05 as having differential stability.
Neural cell type proportion
The Mayo Clinic RNA-seq study, 5XFAD mice, and fAD-like zebrafish datasets are bulk RNA-seq datasets. To confirm that any gene expression changes were likely due to altered transcriptional programs rather than changes in cell type proportions, we compared expression of marker genes for four common neural cell types (astrocytes, neurons, oligodendrocytes, microglia) in conditions within each dataset. The marker genes for astrocytes, neurons, and oligodendrocytes were obtained from MSigDB gene sets from [72] which were based on studies in mice. The marker genes for microglia were derived from [73] which was based on studies in human and mouse. All gene IDs were converted to human, mouse, or zebrafish Ensembl IDs using BioMart [59] for each dataset.
References


