

Abstract
Liquid-liquid phase separation has emerged as a new paradigm for the compartmentalization of cells without membranes. Intrinsically disordered low-complexity domains (LCDs) are often sufficient for mediating phase separation, but how their phase behavior is modulated by the presence of attached folded domains is incompletely understood. Here, we interrogate the interplay between folded and disordered domains of the RNA-binding protein hnRNPA1, which localizes to stress granules under conditions of stress. The LCD of hnRNPA1 is sufficient for mediating phase separation in vitro. However, the stimulus-responsive phase behavior of a number of domain deletion constructs suggests that the folded RRM domains contribute to phase separation, even in the absence of RNA. Small-angle X-ray scattering experiments show that hnRNPA1 adopts compact conformations at low ionic strength, that the protein expands considerably with increasing ionic strength, and that it reaches a maximal plateau at 300 mM NaCl. These data point to electrostatically mediated interactions that compact hnRNPA1. NMR experiments and coarse-grained MD simulations showed that the LCD interacts transiently with the RRMs, providing a mechanistic explanation for the observed stimulus-responsiveness of phase separation. Disordered and folded domains that have evolved together likely encode a multitude of interactions that can modify and regulate phase separation.

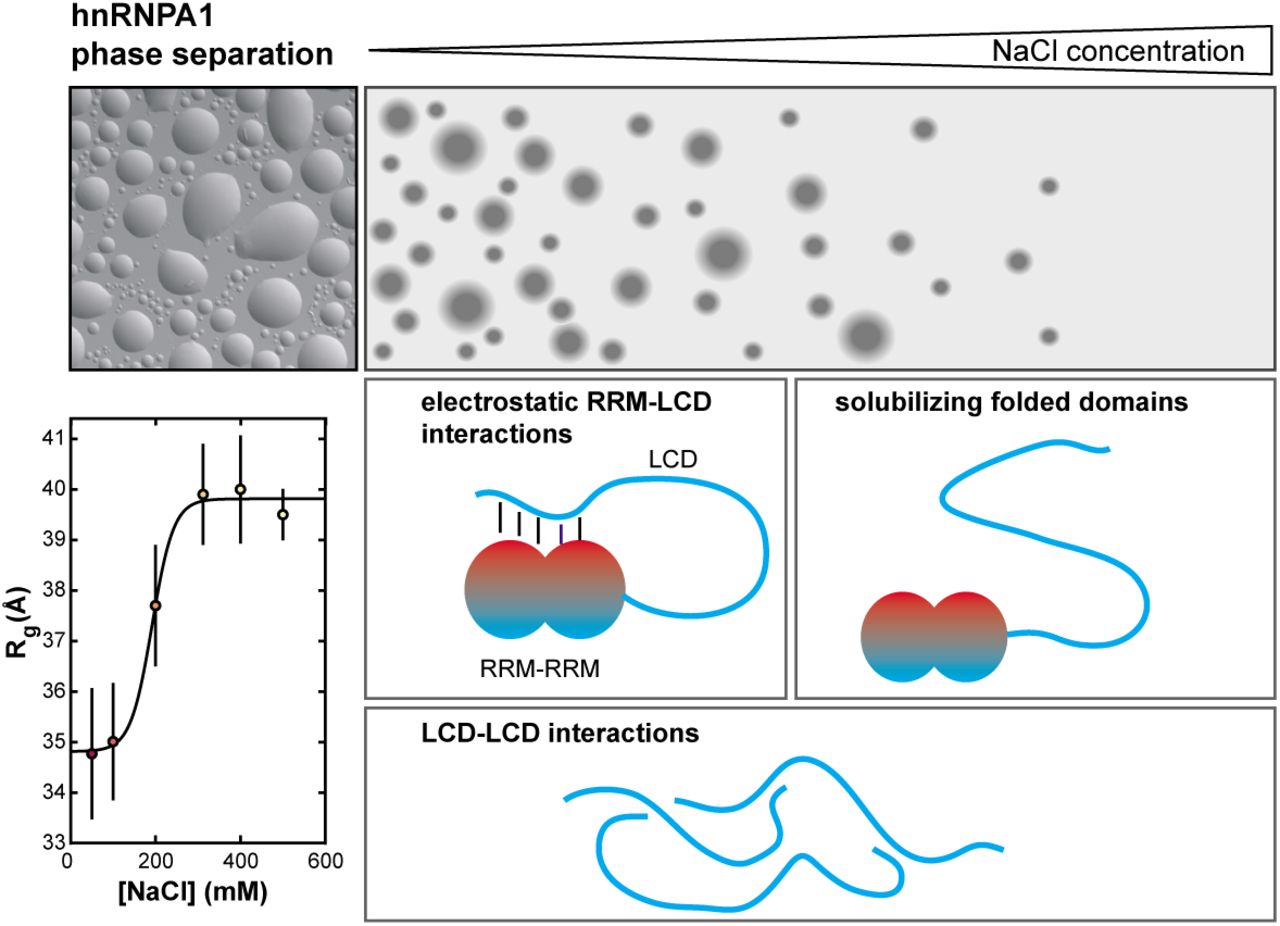
hnRNPA1 phase separation is highly salt sensitive LCD-LCD interactions can mediate phase separation over a wide range of NaCl concentrations. At low NaCl concentrations, electrostatic RRM-LCD interactions occur and can contribute positively to phase separation, but they are screened at high NaCl concentrations. The folded domains solubilize hnRNPA1 under these conditions and prevent phase separation.
Introduction
Liquid-liquid phase separation (LLPS) mediates the extensive compartmentalization of cells and leads to the formation of membraneless organelles including nucleoli, stress granules and P bodies (1-3). In addition to traditional membraneless organelles, other biomolecular condensates that are formed via LLPS include heterochromatin (4-6), transcriptional condensates (7-9) and membrane receptor clusters (10,11). Phase separation is driven by multivalent interactions such as those that occur between tandem repeats of folded domains and linear motifs in pairs of proteins, or between short motifs in intrinsically disordered low-complexity domains (LCDs) (12-17). These multivalent interactions mediate the formation of three-dimensional protein networks whose formation is typically coupled to a density transition that results in dilute and dense coexisting phases (12,18). Given the diversity and redundancy of potential interacting motifs and the fact that most biologically relevant phase-separating proteins contain multiple different domains, biomolecular condensates contain a hierarchy of interactions, some required for their formation, some less important. Changes in solution conditions may affect the relative affinities of different interactions and therefore shift their contributions to phase separation, rewire the multivalent network, change the driving force for phase separation and condensate structure. A redundancy of interactions in phase-separating proteins may therefore be critical to the ability of cells to regulate condensate formation in response to different stimuli.
Recent progress has improved our understanding of how phase behavior is encoded in LCDs (13,15,17,19,20). However, LCDs rarely exist in isolation and are typically connected to folded domains, either as tails or linkers. How such architectures modulate their phase behavior remains largely unexplored although it is exploited experimentally. For example, soluble folded domains can increase the saturation concentration of LCDs and can thus be used to prevent phase separation until the solubilizing domain is proteolytically cleaved (21,22). However, it is often assumed and sometimes observed that the direct fusion of an LCD with a fluorescent protein or reporter domain does not dramatically influence its phase behavior. The function of intrinsically disordered protein regions (IDRs) is determined by the conformational ensembles they sample (23,24), and folded domains influence the conformational ensembles accessible to IDRs (25). We can therefore also expect that folded domains modulate the phase behavior of LCDs by changing their accessible conformations. Given that folded domains have co-evolved with intrinsically disordered domains in many proteins, they may encode functional interactions between the two (26) that help regulate stimulus-responsive phase separation, both in the context of homotypic protein-protein interactions or heterotypic protein-RNA interactions. Taken together, these observations point to subtle, context-dependent interactions between folded domains and LCDs that determine protein phase behavior.
Here, we characterize the phase behavior of the RNA-binding protein hnRNPA1, an archetypal member of the heterogeneous nuclear ribonuclear protein (hnRNP) family, which shuttles in and out of the nucleus, associates with pre-mRNA and acts as a splicing factor (27). Under stress conditions, hnRNPA1 is sequestered in cytoplasmic stress granules (28). Mutations in the hnRNPA1 LCD lead to familial forms of amyotrophic lateral sclerosis and multisystem proteinopathy (29), two related neurodegenerative diseases. hnRNPA1 comprises tandem RNA recognition motifs (RRMs) that behave like a single, folded module due to their short connecting linker (30) and a long, intrinsically disordered LCD. This domain architecture is typical for many RNA-binding proteins, and hnRNPA1 thus serves as an archetypal member of a large family of proteins.
hnRNPA1 undergoes phase separation with RNA via multivalent interactions mediated by its two RRM domains and RGG motifs in the LCD. In the absence of RNA, the LCD is necessary and sufficient for phase separation (28). Here, we characterize the salt-dependence of phase separation of full-length hnRNPA1 and domain deletion constructs to characterize the nature of the interactions that drive stimulus-responsive phase separation. Our results suggest that interactions between the RRMs and the LCD contribute to phase separation. Small-angle X-ray scattering (SAXS) measurements demonstrate an increase of the dimensions of hnRNPA1 above salt concentrations that shield electrostatic interactions. Nuclear magnetic resonance (NMR) spectroscopy and coarse-grained molecular dynamics (MD) simulations provide direct evidence for transient interactions between the LCD and the RRMs. These interactions modulate the solution conditions under which the protein can undergo phase separation, pointing to the modulation of LCD-mediated phase separation by folded domains. Disordered and folded domains in phase-separating proteins may have co-evolved to encode a multitude of tunable interactions.
Results
Phase separation of hnRNPA1 is highly salt-sensitive
To explore the physicochemical nature of the interactions that mediate LLPS of hnRNPA1, we generated different constructs, encompassing the full-length protein, the folded RRMs without the intrinsically disordered LCD, and the LCD without the RRMs (full-length hnRNPA1, RRMs, and LCD, respectively; Fig. 1A). All constructs had an N-terminal His-SUMO tag, and the LCD-containing constructs were missing a hexapeptide that was previously shown to act as a steric zipper (residues 259-264) (29). The resulting constructs did not undergo fibrillization and were amenable to equilibrium biophysical characterization; this is particularly important when quantifying phase behavior. Full-length hnRNPA1 and the LCD readily underwent phase separation (Fig. 1B). In agreement with our previous report that the LCD of hnRNPA1 is necessary for mediating LLPS of hnRNPA1 in the absence of RNA (28), we found that the RRMs alone did not phase separate. These results also indicate that the N-terminal His-SUMO tag does not directly facilitate phase separation of hnRNPA1. While the His-SUMO domain may influence the phase behavior of the LCD, it is present in both constructs, and we thus assume that its influence on the phase behavior of each construct is similar.

(A) Cartoon schematics for the His-SUMO-tagged hnRNPA1 constructs used in this study. hnRNPA1 has two folded RNA binding domains (RRMs 1 and 2, grey), and a C-terminal disordered domain, the so-called low complexity domain (LCD, blue). A fibrillization-enhancing steric zipper motif (residues 259-264) (29) is removed. (B) DIC images of 300 μM hnRNPA1 constructs in 50 mM HEPES pH 7.5, 150 mM NaCl and 5 mM DTT at room temperature. Scale bar is 25 μm. (C) Cartoon schematic illustrating the procedure used for mapping the phase diagrams. A stock solution of hnRNPA1 in the one-phase regime is used and LLPS is induced by lowering the NaCl concentration. The phase separated sample is filtered and incubated at the desired temperature. The dense phase is sedimented in a temperature-equilibrated centrifuge, and the light phase concentration determined by UV/Vis spectrophotometric measurement of the light phase (31). (D) Phase diagram of full-length hnRNPA1 as a function of temperature and NaCl concentration. As NaCl concentration is increased (cool-to-warm color transition), the driving force for phase separation is decreased. The area underneath each curve represents the two-phase regime.
To explore the interactions that mediate phase separation of hnRNPA1, we determined the equilibrium dilute phase concentration, cL, of full-length hnRNPA1 as a function of temperature and NaCl concentration. From a condition in a high salt storage buffer, in which the protein is highly soluble, phase separation was induced by lowering the NaCl concentration via dilution, and the resulting dense phase was sedimented by centrifugation, resulting in a clear phase at the bottom of the tube. The concentration of the dilute phase was determined by UV absorbance measurements (Fig. 1C and Methods) as a function of temperature and NaCl concentration (Fig. 1D) (31). The resulting coexistence curves at different NaCl concentrations are clearly distinct; cL is higher at higher NaCl concentration, demonstrating that phase separation of full-length hnRNPA1 is highly salt-sensitive. The driving force for phase separation increases as salt concentration and temperature decrease implicating favorable electrostatic interactions.
Electrostatic interactions between RRMs and LCD of hnRNPA1
Given that the LCD of hnRNPA1 is sufficient for phase separation, and phase separation is strongly salt-sensitive as described above, we asked whether the salt-sensitivity could be encoded in the LCD of hnRNPA1. The LCD only contains 10 positively charged and three negatively charged residues in 132 residues, i.e. a fraction of charged residues (FCR) of only 10% with a net positive charge (Fig. 2A, grey background). This composition is difficult to reconcile with the observation of enthalpically favorable electrostatic interactions contributing to phase separation. The folded RRMs (Fig. 2A, white background) have a higher charge density than the LCD. Displaying the charge distribution on the surface of the structure of the hnRNPA1 RRMs (Fig. 2B, (30)) revealed two distinct faces; one face is predominantly positively charged (Fig. 2B, blue) and binds the negatively charged RNA; the other face is predominantly negatively charged (Fig. 2B, red). These observations lead us to hypothesize that transient interactions between the negatively charged face of the RRMs and the positively charged LCD may explain the salt-sensitivity of full-length hnRNPA1 phase separation. It should be noted that SUMO similarly has positive and negative surfaces. One would expect similar non-specific interactions but given their transient nature these will be treated as additive with the RRMs.

(A) Primary sequence of human hnRNPA1; residues 1-185 represent the folded RRM domains, and residues 186-320 represent the disordered LCD (background shaded grey). Positively charged residues are colored blue, negatively charged residues are colored red. The His-SUMO tag contains 16 positively charged and 21 negatively charged residues (31% charged).
(B) Electrostatic potential surface mapped onto the structure of the RRM domains of hnRNPA1; red and blue depict a net negative and positive potential, respectively. Chimera was used to generate the surface and Coulombic surface coloring was automatically generated with default settings. PDB: 4YOE (30).
(C) DIC images of hnRNPA1, RRMs and LCD at 300 μM protein concentration in 50 mM HEPES pH 7.5, 50-300 mM NaCl, 5 mM DTT. Camera settings were identical across each row. Scale bar is 25 μm.
(D) Dilute phase concentrations of full-length hnRNPA1 (black) and the LCD (red) as a function of NaCl concentration at 20°C. Asterisks represent concentrations of samples that did not undergo phase separation. The continuous line serves to guide the eye. The vertical dotted line represents the threshold above which the LCD continues to phase separate, whereas full-length hnRNPA1 does not phase separate under any conditions tested. Inset: Zoomed in portion of the larger graph to highlight cl below 100 mM NaCl concentration.
Our hypothesis led to the following two predictions: (1) In the absence of the charged RRMs, we expect phase separation of the LCD to be less salt-sensitive. (2) The additional electrostatic interactions between the RRMs and the LCD contribute to phase separation and decreased cL – an effect which should be manifest at lower salt concentration that do not screen electrostatic interactions. We tested these predictions by comparing phase separation of full-length hnRNPA1 and of the LCD over a large range of NaCl concentrations.
In line with predictions, the two constructs responded differently to changes in ionic strength. (Fig. 2C, D; Fig. S1). We made two main observations: (1) The LCD can phase separate at NaCl concentrations above 200 mM, whereas full-length hnRNPA1 has a steeper dependence on the NaCl concentration and loses the ability to undergo phase separation past 200 mM NaCl (Fig. 2C, D; tested at protein concentrations of up to ∼900 μM). Phase separation of the LCD is thus indeed less salt-sensitive than of full-length hnRNPA1. (2) At lower salt concentrations, between 50 and 100 mM NaCl, cL of full-length hnRNPA1 is lower than that of the LCD (Fig. 2D), indicating a stronger driving force for phase separation, which must be mediated by additional interactions. Taken together, these data support the hypothesis that electrostatic interactions between the RRMs and the LCD of hnRNPA1 contribute to phase separation of the full-length protein and that they are disrupted at high ionic strength.
The global dimensions of hnRNPA1 indicate salt-sensitive intramolecular interactions
We reasoned that the inferred intermolecular RRM-LCD interactions that contribute to phase separation should result in intramolecular RRM-LCD interactions in the dilute phase (32). We carried out size exclusion chromatography-coupled SAXS (SEC-SAXS) measurements at a variety of NaCl concentrations (Fig. 3A). The radius of gyration (Rg) of full-length hnRNPA1 is ∼35 Å at 50 mM NaCl, increases with increasing NaCl concentration and plateaus at ∼40 Å at 300 mM NaCl. The midpoint of the transition is at ∼175 mM NaCl. These observations are in agreement with a scenario in which intramolecular electrostatic interactions compact hnRNPA1; these interactions are screened at increasing ionic strength, which results in an expansion of hnRNPA1 and a maximal average expansion at NaCl concentrations above the physiological range. Notably, the salt sensitivity of the Rg occurs in the same concentration window as the dependence of the saturation concentration.

(A) SEC-SAXS data acquired of full-length hnRNPA1 in 50 mM Tris pH 7.5, 10 mM DTT, 2 mM TCEP and 50 mM NaCl - 500 mM NaCl. The fit of calculated data from simulations, before and after reweighting, to the experimental data is shown. Guinier analysis plots are shown in insets.
(B) Rg values from Guinier analysis of experimental data and calculated data from simulations as a function of NaCl concentration. The data was fit to logistic functions that indicate minimum dimensions at low NaCl concentration, a maximum extension at high NaCl concentration and a transition with a midpoint at ∼175 mM NaCl, suggesting screening of interactions between oppositely charged regions of hnRNPA1. Simulations recapitulate the trend and after reweighting show close agreement.
(C) Increasing NaCl concentrations progressively reduce the number of RRM-LCD interactions; average number shown as grey bar.
Coarse-grained MD simulations reveal RRM-LCD interactions
The SAXS analysis supports the existence of salt-sensitive, compacting interactions within hnRNPA1 but does not provide information of high enough resolution to answer the question whether these interactions are mainly between the LCD and the RRMs. We thus turned to coarse-grained MD simulations with the Martini forcefield and initially performed simulations at 100 mM NaCl. Comparing the resulting conformational ensemble with the SAXS data, however, revealed it was too compact (Fig. S2). We have previously demonstrated that rescaling of protein-water interactions may be used to alleviate this issue and results in conformational ensembles of RNA-binding proteins that agree well with experiment (33). We thus changed the protein-water interaction by tuning a parameter, λ, that increases the interaction between protein and water, and chose the value that resulted in the best fit between experimental and calculated SAXS data (Fig. S2). We find that an increase of 7% (λ=1.07) is sufficient to obtain a very good fit to the data, and note that we previously obtained a very similar value (λ=1.06) on a different protein (33), suggesting that the magnitude might be general and transferable. We thus proceeded to use λ=1.07 for coarse-grained simulations at NaCl concentrations from 50 and 500 mM.
The simulations captured the salt-sensitive expansion of hnRNPA1 and were generally in good agreement with the SAXS data and resulted in low values of χ2 (Fig. S2C). However, the calculated radii of gyration were slightly smaller than the experimental ones (Fig. 3B), and the calculated SAXS curves showed small, non-random deviations from experiment (Fig. 3A). We have previously demonstrated that reweighting against experiments is robust as long as the initial simulation is relatively good (33). We thus used a Bayesian/maximum entropy approach (34,35) to reweight the conformational ensembles against the experimental SAXS data (Fig. 3A,B, Fig. S2), and to obtain an improved fit to the experimental SAXS data and Rg values at all NaCl concentrations, thus generating ensembles that are in full accordance with the experiments.
Inspecting the resulting conformational ensembles showed extensive RRM-LCD interactions at low NaCl concentrations which were progressively disrupted at increasing concentrations (Fig. 3C). The simulations thus suggest that increasing salt concentrations shift the equilibrium between conformations in which the LCD associates with the RRMs and conformations in which the LCD is liberated from the RRMs. We note that a similar picture was obtained analyzing the ensembles prior to reweighting, demonstrating that the Martini force field itself captured the observed salt dependency of the interactions.
In agreement with these data, the shape factor f/f0 in a two-dimensional analytical ultracentrifugation sedimentation velocity analysis also becomes larger with increasing NaCl concentration, which signifies an increase in extended shape and supports the idea that the LCD is released from its interactions with the RRMs and increases the hydrodynamic drag of hnRNPA1 (Fig. S3). Together, these data support the existence of electrostatic RRM-LCD interactions.
The intrinsically disordered LCD transiently interacts with the folded RRM domains
To compare the simulations with experiment, we turned to NMR spectroscopy, which can provide residue-specific insight into transient interactions. Comparing chemical shifts of RRM resonances of samples in which the LCD was either fused to the RRMs or not showed only small differences (Fig. S4A), likely because the interactions between RRMs and LCD are transient and dynamic. Paramagnetic relaxation enhancement (PRE) experiments are sensitive to even such transient interactions. We hence generated a single cysteine variant of full-length hnRNPA1, so-called hnRNPA1Cys, by mutating the two native cysteines in the RRMs to a serine and an alanine, respectively (C43S and C175A), and introducing a single cysteine residue at position 231 in the LCD (S231C) (Fig. 4A). Given that samples of full-length hnRNPA1Cys were not stable over the time scale of NMR assignment experiments, we assigned the backbone resonances of a construct lacking the LCD, His-SUMO-RRMCys (Fig. 4B). We obtained assignments for 93% of non-proline backbone resonances of the RRMs. Assignments of the free LCD, which we have reported previously (17), could largely be transferred onto the spectrum of hnRNPA1Cys. The signals of the His-SUMO tag were largely weak, and we focused the analysis on the portion of the protein containing the two RRMs and the LCD.

(A) Cartoon schematics of hnRNPA1 constructs for NMR experiments. The single cysteine variant hnRNPA1Cys (C43S, C175A and S231C) was conjugated to the spin label MTSL at its cysteine in the LCD. NMR assignment experiments were collected for RRMCys, a construct lacking most of the LCD but which is 11 residues longer than the RRM construct used throughout this study; it is designed based on a previous construct used to assign the RRMs (36). (B) 1H,15N TROSY HSQC spectrum of RRMCys at 700 MHz and 298K with assignments. (C) PRE profiles of spin-labeled hnRNPA1Cys at 200 mM NaCl from experiment (orange) and simulations (black) show transient RRM/LCD contacts. The broken horizontal line indicates the labeling position.
hnRNPA1Cys was conjugated to the paramagnetic spin label MTSL. PRE effects, i.e. enhanced relaxation due to through-space interactions of nuclei with the free electron of the spin label, can be observed when the oxidized spin label approaches to within 30 Å of the observed nuclei. A reduced sample does not contain a free electron and serves as a control. We collected 1H,15N HSQC TROSY NMR spectra of the oxidized and reduced forms of MTSL-hnRNPA1Cys (Fig. S4B) at 200 mM NaCl and analyzed the relative signal intensities. As expected, some resonances from disordered LCD residues, which are found in the middle of the HSQC spectrum, were undetectable in the oxidized sample. This is caused by strong PRE effects of the MTSL label to nearby residues. But even effects on residues >20 residues away were observed (Fig. S4B). These observations point to self-interactions of the LCD consistent with the fact that the LCD can drive phase separation via homotypic interactions as we have previously reported (17). Many RRM resonances were also affected (Fig. 4C).
The experimental PREs were compared to PREs calculated from the simulated ensemble at 200 mM NaCl. They show a similar dip in intensity ratios around the spin labeling site; many PRE effects in the LCD and the RRMs are also highly similar (Fig. 4C). Small differences may stem from interactions not captured by the simulations, by incomplete MTSL labelling (the labeling efficiency was >90%) and by low signal-to-noise in NMR spectra of dilute full-length hnRNPA1.
Displaying the probability of the contacts on the structure of the RRM module shows clustering of the strongest effects on the face opposite of the RNA-binding face of hnRNPA1 but also extending to its edge (Fig. 4C). These data confirm our hypothesis that the net positively charged LCD interacts transiently with the negatively charged face of the folded RRMs at low NaCl concentrations.
High-quality NMR data was not accessible at lower NaCl concentrations because phase separation limited sample concentration and stability. The good overall agreement between the simulations, SAXS and PRE experiments at 200mM NaCl, however, allows us to make inferences from the simulated conformational ensemble at lower NaCl concentrations. These analyses reveal that it is the same contacts that are present at all salt concentrations, but that the salt concentration modulates their propensity to form (Fig. 5).

(A) Fractional contact population of the LCD with the RRMs. (B) Contacts are shown on a sausage diagram of the RRMs (pdb 1HA1). The diameter of the sausage and the color coding indicate the probability of a contact at a given position. (C) Electrostatic surface of the RRMs (on surface representation of 4YOE); on the left in the same orientation as in B, on the right turned by 90° to show where the RNA molecule is bound.
Discussion
Disordered LCDs of RNA-binding proteins are often alone sufficient for mediating phase separation, but how they function in the context of the full protein and how the folded domains modulate the LCD phase behavior has remained incompletely understood. Here, we show that phase separation of hnRNPA1 in the absence of RNA is more salt-sensitive than of the LCD alone. We find that electrostatic interactions between the folded RRMs and the disordered LCD may explain these differences (Fig. 6).

The LCD undergoes LLPS even at high salt concentrations. The electrostatic interactions between the RRMs and the LCD contribute to LLPS of full-length hnRNPA1. They are screened with increasing salt concentration and the resulting expanded conformation is more soluble than the LCD alone. This mechanism highlights the ability of the LCD to modulate phase behavior of hnRNPA1, e.g. also via post-translational modifications.
Typical LCDs of the type found in hnRNPA1 and related proteins are polar tracts interspersed with aromatic and charged residues (15). The main driving force for their phase separation seems to stem from a combination of aromatic-aromatic and aromatic-arginine interactions (13,15,17,20,37), which are compatible with high ionic strength. This is in agreement with our observation that the hnRNPA1 LCD can undergo phase separation even at high salt concentration. In contrast, we did not observe phase separation of full-length hnRNPA1 at NaCl concentrations above 200 mM, even at millimolar protein concentrations. This observation suggested the presence of salt-sensitive electrostatic interactions between the LCD and the RRMs that modulate phase behavior. Indeed, we observed intramolecular interactions between the LCD and the RRMs by coarse-grained MD simulations and PRE NMR spectroscopy. We further showed that the global dimensions of full-length hnRNPA1 expand concomitantly with increasing salt concentration, caused by screening electrostatic interactions that stabilize compact conformations involving LCD-RRM contacts.
The slightly enhanced driving force for phase separation of full-length hnRNPA1 as compared to the LCD at low salt concentration is in agreement with a model in which the RRM-LCD interactions can occur in trans and contribute to phase separation (Fig. 6). As the salt concentration increases and the RRM-LCD interactions are screened, the saturation concentration increases massively, to the point that we were unable to detect phase separation.
Why does hnRNPA1, when the LCD is liberated from interactions with the RRMs, not phase separate under the same conditions as the LCD in isolation? In low and intermediate salt conditions our findings are in agreement with our expectation that full-length hnRNPA1 has a lower saturation concentration than the LCD given the additional electrostatic interactions. But why is the phase behavior of the free LCD not recovered once these interactions are screened? Our and previously published data point to the solubilizing influence of the folded domains. Under conditions where the LCD does not associate with the RRMs, the excluded volume of the RRMs decreases the potential for LCD-LCD mediated phase separation and the higher charge content of the RRMs has a solubilizing effect. In fact, this solubilizing property of folded domains has been used to prevent phase separation of strongly self-associating LCDs until the solubilizing domain is proteolytically cleaved (21,22,38). The solubilizing effect of karyopherins on FUS and other RNA-binding proteins (39-42) may work through similar mechanisms. The reason for the steep increase of the saturation concentration of full-length hnRNPA1 above 175 mM NaCl is not entirely clear. The behavior does not seem in agreement with pure electrostatic screening unless salt ions partition unequally into the light and dense phase, which would be an interesting effect worth investigating.
The interplay between the folded RNA-binding domains and the disordered LCD suggests an interesting mechanism to tune hnRNPA1 phase separation in cells. RNA binding and posttranslational modifications are likely to modulate the attractive RRM-LCD interactions, and several independent inputs may thus be able to modulate the saturation concentration. The LCD-RRM interactions may increase the RNA concentrations required for RRM-RNA-mediated phase separation. Once RRM-RNA interactions have displaced the LCD, it may then be able to contribute to phase separation via LCD-LCD interactions. RNA may also screen the positive face of the RRMs and create more negative surfaces for interactions with the LCD. We thus speculate that hnRNPA1 encodes a conformational switch that enhances the cooperativity of its phase separation with RNA. It has recently been demonstrated that G3BP1 encodes interactions between several domains and that their modulation by posttranslational modifications tunes the sensitivity of G3BP1 to the levels of exposed mRNA in cells and therefore adjusts its driving force for stress granule assembly (43). These results and our current report suggest that the threshold concentration for phase separation of RNA-binding proteins is not a fixed value in cells but can be tuned depending on inputs from signaling pathways.
Modulating interactions between folded domains and LCDs may constitute a general principle for tuning the phase behavior of proteins in response to input signals. These insights should also be taken into account when phase-separating proteins are fused to reporter proteins. Further work is needed to disentangle the multitude of protein-protein and protein-RNA interactions and their balance in mediating phase separation under physiological conditions.
MATERIAL AND METHODS
Protein Expression and Purification
Human hnRNPA1 proteins (full-length A1, RRMs A1, LCD A1) were expressed as N-terminally tagged His-SUMO fusion proteins in BL21 (DE3) RIPL cells (Agilent) in LB media, and purified using Ni2+ affinity chromatography, followed by size exclusion chromatography (SEC), RNaseA digestion followed immediately by ion exchange, and SEC, as previously described (28). Briefly, cells were lysed in lysis/wash buffer (50 mM HEPES pH 7.5, 250 mM NaCl, 30 mM imidazole, 2 mM 2-mercaptoethanol (βME), and complete protease inhibitor cocktail) (Roche) with a microfluidizer (Microfluidics, 20,000 psi). Clarified lysate was filtered and passed over a Ni2+ affinity chromatography column by gravity and washed with the lysis/wash buffer. Protein was eluted with elution buffer (50 mM HEPES pH 7.5, 300 mM NaCl, 300 mM imidazole, 2 mM βME), concentrated, and passed over a SEC column (Superdex 200 16/60 column (full-length hnRNPA1, RRMs) or a Superdex 75 (16/60) (LCD)) equilibrated in storage buffer (50 mM HEPES pH 7.5, 300 mM NaCl, 5 mM DTT.) To remove bound RNA, full-length hnRNPA1 and RRMs were treated with 0.2 mg/mL RNaseA for 5 min at 37 °C, and LCD was passed over a 5 mL HiTrap Heparin HP column (GE Healthcare). The RNaseA treated proteins were then further purified by ion exchange chromatography on a 5mL HiTrap SP (full-length hnRNPA1) or Q Column (RRMs) (GE Healthcare). Lastly, proteins were passed over their respective SEC columns equilibrated in storage buffer.
All proteins were concentrated using an ultrafiltration concentrator with either a 3 kDa, or 30 kDa MWCO regenerated cellulose membrane (EMD Millipore), flash frozen in small aliquots in liquid nitrogen, and stored at -80 °C until needed. Protein purity was determined by Coomassie Blue stained SDS-PAGE gel and the homogeneity of samples were tested by dynamic light scattering. RNA content was analyzed by the ratio of the absorbance at 260 and 280 nm and/or polyacrylamide gel.
NMR Sample Preparation
His-Sumo tagged hnRNPA1Cys for PRE experiments was expressed in BL21 (DE3) RIPL cells in M9 minimal media supplemented with 15N ammonium chloride. hnRNPA1Cys was purified by Ni2+ affinity chromatography where RNaseA (0.5 mg/mL) was added to the wash buffer (75 mM Imidazole pH 7.8, 800 mM NaCl) to remove bound nucleic acid. The protein was reduced on the column with 0.5 mM TCEP, eluted in 300 mM Imidazole pH 7.8, 300 mM NaCl and subsequently labelled for two hours with a 3-5 fold molar excess of MTSL, followed by SEC chromatography in a 20 mM HEPES pH 7.5, 300 mM NaCl buffer. A labelling efficiency of greater than 90% was determined spectrophotometrically using Ellman’s reagent. Protein was concentrated to 250 μM and dialyzed into 50 mM sodium phosphate pH 6.5, where the NaCl concentration was either 200 or 300 mM for NMR experiments. The MTSL label was reduced with a 10fold molar excess of ascorbic acid to result in diamagnetic control samples in which no PRE effect would be observed.
His-Sumo tagged RRMCys for NMR assignments was expressed in BL21 (DE3) RIPL cells in M9 minimal media supplemented with 15N ammonium chloride and 13C glucose. The protein was purified in a similar manner as the hnRNPA1Cys construct.
Data Collection
NMR data were collected on Bruker Avance 600 (PRE-NMR experiments) and 700 (assignments) MHz spectrometers equipped with QCI quadruple-resonance (600 MHz) and TCI triple-resonance (700 MHz) cryogenic probes at 298K. All samples were prepared in an NMR buffer consisting of 50 mM sodium phosphate pH 6.5, 5 mM DTT, either 200 mM or 300 mM NaCl, 10% D2O, and spiked with DSS.
Assignment experiments of His-SUMO RRMCys (Fig. 4B) were collected at 700 MHz at 298K. 15N, 13C RRMsCys was prepared and standard TROSY based 3D assignment experiments were collected. These include HNCA, HNCACB, CBCA(CO)NH, HNCO, and HN(CA)CO, with the following parameters: 2D TROSY 1H-15N HSQC (8 scans, 2048 x 90 complex data points, with 13 ppm and 35 ppm as 1H and 15N sweep widths); HNCA(32 scans, 1024 (1H) × 32 (15N) × 40 (13C) complex data points, with 12 ppm, 35 ppm, and 32 ppm as 1H, 15N and 13C sweep width, respectively); HNCACB (48 scans, 1024 (1H) × 32 (15N) × 48 (13C) complex data points, with 12 ppm, 35 ppm, and 72 ppm as 1H, 15N and 13C sweep width, respectively) and CBCA(CO)NH (32 scans, 1024 (1H) × 32 (15N) × 40 (13C) complex data points, with 12 ppm, 35 ppm, and 70 ppm as 1H, 15N and 13C sweep width, respectively), HNCO (16 scans, 1024 (1H) × 32 (15N) × 40 (13C) complex data points, with 12 ppm, 35 ppm, and 14 ppm as 1H, 15N and 13C sweep width, respectively); HN(CA)CO (32 scans, 1024 (1H) × 24 (15N) × 48 (13C) complex data points, with 12 ppm, 35 ppm, and 14 ppm as 1H, 15N and 13C sweep width, respectively). In addition a TROSY-based 15N-resolved [1H, 1H]-NOESY spectrum was also recorded (32 scans, 1024 (1H) × 24 (15N) × 120 (1H) complex data points, with 12 ppm, 22 ppm, and 70 ppm as 1H, 15N and 13C sweep width, respectively) using a mixing time of 100 msec.
All the data were processed using BRUKER Topspin version 3.5, NMRPipe (v7.9) and analyzed using CARA (v1.8.4) and NMRfam-SPARKY. All spectra were referenced directly using DSS for the 1H dimension, 13C and 15N frequencies were referenced indirectly. Initially assignments were obtained from BMRB ID: 18728 and the assignments were confirmed using the data we collected. 23 backbone resonances of human hnRNPA1 RRMs could not be assigned (marked grey in Figure 4C). Using these methods, ∼90% of the sequence was confidently assigned. The assignments of hnRNPA1 RRMsCys were deposited in the BMRB with the accession number 50272.
Paramagnetic Relaxation Enhancement (PRE) Data Analysis
PRE data was collected using 2D TROSY 1H-15N HSQC (384 scans for 200mM NaCl & 64 scans for 300mM NaCl, 2048 x 75 complex data points, with 13 ppm and 35 ppm as 1H and 15N sweep widths) for both the oxidized and reduced forms. The peaks were integrated in CARA and the ratio of the intensity of the oxidized and reduced form is plotted versus residue numbers in Figure 4C.
Differential Interference Contrast (DIC) Microscopy
Protein samples (full-length hnRNPA1, RRMs, LCD) were diluted to 300 μM in 50 mM HEPES pH 7.5, 5 mM DTT and varying salt concentrations (50, 100, 200, 300 mM NaCl). Sealed sample chambers containing protein solutions comprised a microscope slide, and a coverslip, sandwiching 3M 300 LSE high-temperature double-sided tape (0.34 mm). Droplets were observed on a Nikon C2 laser scanning confocal microscope with a 20X (0.8NA) Plan Apo objective. Images were processed with the Nikon NIS Elements software. All images within the same row of figures were taken with the same camera settings.
In Vitro Determination of Phase Diagrams
Dilute phase concentrations were determined as reported previously (31). All protein constructs were purified and stored in storage buffer as above. Protein was diluted with a buffer containing no salt (50 mM HEPES pH 7.5, 5 mM DTT) to induce LLPS. The samples were then passed through 0.22 μm filters (4 mm diameter) to remove any particulate matter that could nucleate LLPS or aggregate formation. The samples were partitioned into 12 µL aliquots into clear, colorless tubes and incubated at the desired temperatures for 20 min. The dense phases in the temperature-equilibrated samples were then sedimented in a temperature-equilibrated centrifuge for 5 min at maximum speed (21,000 g). 7 µL of the resulting supernatant (i.e. the dilute phase) was gently removed and placed into a clean tube. The supernatants were then diluted two-fold with an appropriately matched buffer to ensure that the sample does not undergo LLPS at room temperature. The protein concentration of the dilute phase was determined from the absorbance at 280 nm on a NanoDrop UV/Vis spectrophotometer. Phase diagrams were determined for the various protein constructs at 50, 75, 100, 125, 150 mM NaCl and 5, 10, 15, 20, 25, and 30 °C. Each coexistence curve was fitted to the scaling relation for binary demixing adapted from renormalization-group theory (32-34):

Small Angle X-Ray Scattering (SAXS) Sample Preparation and Data Collection
Samples of full-length His-SUMO-hnRNPA1 were prepared in a buffer containing 50 mM Tris pH 7.5, 300 mM NaCl, 10 mM DTT, 2 mM TCEP. DTT and TCEP were used to scavenge radicals and prevent radiation damage. SAXS data was collected as a function of NaCl concentration. Experiments were performed at the BioCAT (beamline 18ID at the Advanced Photon Source, Chicago) with in-line size exclusion chromatography (SEC-SAXS) to separate monomeric protein from aggregates and ensure the best possible buffer subtraction. Concentrated protein samples were injected into a Superdex 200 increase column (GE Lifesciences) preequilibrated in a buffer containing 50 mM Tris pH 7.5, 10 mM DTT, 2 mM TCEP and the desired NaCl concentration, using an FPLC running at 0.8 mL/min. The output of the column passed through UV and conductance monitors before passing through a quartz capillary in the X-ray path. Scattering intensity was recorded using a Pilatus3 1M (Dectris) detector placed 3.5 m from the sample providing access to a q-range from 0.004-0.4 Å−1. One second exposures were acquired every two seconds during the elution. Data were reduced at the beamline using the BioXTAS RAW 1.4.0 software (35). The contribution of the buffer to the X-ray scattering curve was determined by averaging frames from the SEC eluent which contained baseline levels of integrated X-ray scattering, UV absorbance and conductance. Frames were selected as close to the protein elution as possible and, ideally, frames pre- and post-elution were averaged. Final q versus I(q) data sets were generated by subtracting the average buffer trace from all elution frames and averaging curves from elution volumes close to the maximum integrated scattering intensity; these frames were statistically similar in both small and large angles. Buffer subtraction, subsequent Guinier fits, and Kratky transformations were done using custom MATLAB (Mathworks) scripts.
Analytical Ultracentrifugation Sedimentation Velocity (AUC-SV)
Sedimentation velocity experiments were conducted in a ProteomeLab XL-I analytical ultracentrifuge (Beckman Coulter, Indianapolis, IN) following standard protocols unless mentioned otherwise (36,37). Samples in buffer containing 50 mM HEPES pH 7.5, 5 mM DTT and 100, or 200 or 300 mM NaCl were loaded into cell assemblies comprised of double sector charcoal-filled centerpieces with a 12 mm path length and sapphire windows. Buffer density and viscosity were determined in a DMA 5000 M density meter and an AMVn automated micro-viscometer (both Anton Paar, Graz, Austria), respectively. The partial specific volumes and the molecular mass of the protein was calculated based on their amino acid compositions in SEDFIT (https://sedfitsedphat.nibib.nih.gov/software/default.aspx). The cell assemblies, containing identical sample and reference buffer volumes of 390 µL, were placed in a rotor and temperature equilibrated at rest at 20 °C for 2 hours before it was accelerated from 0 to 50,000 rpm. Rayleigh interference optical data were collected at 1-minute intervals for 10 hours. The velocity data were modeled with diffusion-deconvoluted sedimentation coefficient distributions c(s) in SEDFIT (https://sedfitsedphat.nibib.nih.gov/software/default.aspx), using algebraic noise decomposition and with signal-average frictional ratio and meniscus position refined with non-linear regression (38). The s-values were corrected for time and finite acceleration of the rotor was accounted for in the evaluation of Lamm equation solutions (39). Maximum entropy regularization was applied at a confidence level of P-0.68.
For the sedimentation velocity data of hnRNPA1 samples in the various buffers with increasing salt concentration two-dimensional size-shape distributions, c(s, f/f0) (with the one dimension the s-distribution and the other the f/f0-distribution) was calculated with an equidistant f/f0-grid of 0.25 steps that varies from 0.5 to 3, a linear s-grid from 0.5 to 5 S with 100 s-values, and Tikhonov-Phillips regularization at one standard deviation. The velocity data were transformed to c(s,f/f0), and c(s,M) distributions with M the molecular weight, f/f0 the frictional ratio, s the sedimentation coefficient and plotted as contour plots. The color temperature of the contour lines indicates the population of the species (36,37,40).
Coarse-grained molecular dynamics simulations
Initial structure and system preparation
We used Modeller (41) to generate our initial mode for the simulations of SUMO-hnRNPA1 based on the NMR structure of SUMO1 (PDB: 1A5R) (42) and the crystal structure of the RRM1 and RRM2 domains (PDB: 1HA1) (43). The LCD and linker regions were left as an extended coil in the initial structure.
We performed all MD simulations with the MARTINI 3.0.beta.4.17 force-field (http://cgmartini.nl/index.php/martini3beta) (44) using GROMACS 2019.4 (45). The all-atom structure of hnRNPA1 was coarse-grained using the Martinize2 python script (46), placed in a cubic box using GROMACS and solvated with the intended NaCl concentration using the Insane python script (47). An elastic network was added to the folded SUMO, RRM1 and RRM2 domains using Martinize2. Interdomain elastic restraints and the elastic network in the LCD and linker regions were removed. The elastic restraints consisted of a harmonic potential of 500 kJ mol−1 nm−2 between backbone beads within a 1.2 nm cut-off. Energy minimization was performed for 0.3 ns with a 30 fs timestep using the Berendsen thermostat at 300 K, Berendsen barostat and Verlet cut-off scheme. The system was then equilibrated for 10 ns with a 2 fs timestep using the Velocity-Rescaling thermostat at 300 K, Parinello-Rahman barostat and Verlet cut-off scheme.
Molecular dynamics simulations
We first performed coarse-grained MD simulations of hnRNPA1 in which we varied a parameter that modulates the strength of interaction between protein and water. Specifically, we tuned a parameter, λ, to rescale the ε-parameter in the Lennard-Jones potential between protein and water beads. We then determined the value of λ that gave rise to the best agreement with SAXS data as quantified by the reduced χ2 (χ2r) between calculated and experimental SAXS profiles. We chose to tune λ at 100 mM NaCl, and performed simulations with λ = 1.00, 1.02, 1.04, 1.05, 1.06, 1.07, 1.08 or 1.10 for 10 μs with a 20 fs timestep using the Velocity-Rescaling thermostat at 300 K, Parinello-Rahman barostat and Verlet cut-off scheme, saving conformations every 1 ns. We used Pepsi-SAXS to calculate SAXS profiles from these simulations as previously described (48); specifically we determined the parameters r0 and Δρ as ensemble averages, and I(0) and B were fitted as free global parameters.
Having found λ = 1.07 to describe the data at 100mM NaCl well, we performed coarse-grained MD simulations of hnRNPA1 with this value fixed and varying the salt concentration to match the experiments (50, 100, 200, 300, 400 or 500 mM NaCl). We ran these simulations for 20 μs but otherwise with the same parameters as described above.
Calculation of SAXS and PRE data from simulations
We calculated SAXS and PRE from all-atom models obtained using a modified (48) version of the Backward algorithm (49), in which simulation runs are excluded and energy minimization steps are shortened to 200 steps.
SAXS profiles were calculated from all-atom back-mapped MD trajectories using Pepsi-SAXS 2.4 (50), with experimental SAXS profiles for optimization. Parameters fitted with Pepsi-SAXS are I(0): the forward scattering, B: the constant background, r0: the excluded water volume and Δρ: the density of the surface solvent layer.
PRE data was calculated from all-atom back-mapped trajectories using PREPredict (https://github.com/KULL-Centre/DEERpredict) which implements a spin-label rotamer library (51) to an approach to calculate PREs from conformational ensembles (52). The spin-label was positioned on residue 231 in the LCD. The parameters used were R2,dia: 8 s−1 (LCD) and 16 s−1 (RRMs), τc: 8 ns, τt: 200 ps and INEPT delay: 10 ms.
BME reweighting
BME reweighting (53) was performed for simulations with varying ionic strength to refine the ensembles against SAXS data. Fitting of Pepsi-SAXS parameters and BME reweighting was performed as in Larsen et al. 2019 (48), which includes an initial round of BME reweighting to determine optimal weighted ensemble average Pepsi-SAXS parameters, followed by BME reweighting to determine the optimal set of weights for agreement with experimental SAXS. The global scaling parameter θ used in the final round of BME reweighting was chosen to obtain a low χ2r to the experimental SAXS data while retaining a high fraction of effective frames feff. Data points at q > 0.2 Å−1 were excluded from experimental SAXS data for BME reweighting. Our MD simulations, SAXS data and the weights obtained from the reweighting procedure are available at https://github.com/KULL-Centre/papers/tree/master/2020/hnRNPA1-milkovic-et-al.
Rg and contacts
Rg from coordinates was calculated using GROMACS gyrate tool. Rg was also determined from calculated SAXS profiles by Guinier analysis, using the SAXS profiles from the final round of BME reweighting, calculated with weighted ensemble average Pepsi-SAXS parameters.
Interdomain contacts between the LCD and RRMs were calculated using GROMACS mindist tool with a 5 Å cut-off between the groups residue 14-97, 104-184 (RRMs) and residue 195-320 (LCD).
FUNDING
This work was supported by the American Lebanese Syrian Associated Charities (ALSAC) and St. Jude Children’s Research Hospital Collaborative on Membraneless Organelles in Health and Disease (to T.M.) and the Lundbeck Foundation BRAINSTRUC initiative (to K.L.-L.). Use of the Advanced Photon Source was supported by the U.S. Department of Energy under contract DE-AC02-06CH11357 and was supported by grant 9 P41 GM103622 from the NIGMS of the National Institutes of Health. Use of the Pilatus 3 1M detector was provided by grant 1S10OD018090-01 from NIGMS. Microscopy images were acquired at the Cell & Tissue Imaging Center which is supported by SJCRH and NCI (grant P30 CA021765).
CONFLICT OF INTEREST
T.M. is a consultant for Small Molecule RNA Co.
Supplementary Information

Dilute arms of binodals for hnRNPA1 (solid lines, same data as Fig. 1D) and the LCD as a function of temperature at a number of NaCl concentrations. As NaCl concentration is increased (cool-to-warm color transition), the driving force for phase separation decreases for both constructs. The area underneath each curve represents the two-phase regime.

(A) The protein-water interaction parameter λ was changed progressively in simulations of hnRNPA1 at 50 mM NaCl and the fit of the resulting ensembles to the experimental SAXS data determined. λ of 1.07 (i.e. the value that gave the best agreement with experiment; grey bar) was chosen for further simulations.
(B) The Rg values from simulation and experiment are similar at λ of 1.07. The grey bar shows the experimental Rg value.
(C) Fit of simulations to experimental SAXS data after reweighting.
(D) The extent of reweighting optimized a balance between the fit to the experimental SAXS data and usage of a large fraction of the trajectory.

The sedimentation velocity profiles (fringe displacement) were fitted to a two-dimensional size-and-shape distribution model and shown as contour plots (heat maps) of c(s,f/f0) with increasing color temperature indicating higher fringes/S values. Velocity data were acquired at a rotor speed of 50,000 rpm at 20 °C in 50 mM HEPES pH 7.5, 5 mM DTT and 100, or 200 or 300 mM NaCl, buffer at 20 °C. Rayleigh interference optical data were collected.

(A) Chemical shift differences between His-SUMO RRMCys and hnRNPA1Cys are small. (B) 1H,15N TROSY HSQC spectra of 15N MTSL-hnRNPA1Cys at 200 mM NaCl in the reduced (red) and oxidized (blue) states. The spin label was reduced with addition of 10-fold excess ascorbic acid.
ACKNOWLEDGEMENT
We are grateful to Jill Bouchard, Melissa Marzahn, Ivan Peran, Max Frenkel and Richard Kriwacki for technical help and useful discussions. We thank Irina Ritsch, Elisabeth Lehmann, Gunnar Jeschke and Frédéric Allain for fruitful discussions and for information on the identity of the hnRNPA1Cys mutant. We thank Yong Wang, Francesco Pesce and Giulio Tesei for help with and input to running and analyzing the MD simulations. We thank Victoria Frohlich, Aaron Pitre, Jennifer Peters, and Sharon King for help with microscopy. We acknowledge the use of the Molecular Interaction Analysis facility at SJCRH for analytical ultracentrifugation experiments. We thank Srinivas Chakravarthy and the BioCAT beamline staff at the Advanced Photon Source for assistance with SAXS measurements.
REFERENCES


