

ABSTRACT
Cell division requires dramatic reorganization of the cell cortex that is primarily driven by the actomyosin network. We previously reported that Protocadherin 7 (PCDH7) enriches at the cell surface during mitosis which is required for building up the full mitotic rounding pressure. Here we showed that PCDH7 gets palmitoylated and interacts with the palmitoyltransferase, ZDHHC5. Both PCDH7 and ZDHHC5 co-localize at the mitotic cell surface and get enriched at the cleavage furrow during cytokinesis. PCDH7’s localization is ZDHHC5 dependent. Loss of expression of ZDHHC5 or PCDH7 leads to defects in cleavage furrow ingression and cytokinesis. At the mitotic cell surface and cleavage furrow, PCDH7 interacts with Myosin Phosphatase Target Subunit1 (MYPT1). We propose that this interaction tunes phospho-myosin levels at the cleavage furrow for regulating the myosin activity during cytokinesis. This work uncovers a palmitoylation-dependent translocation for PCDH7 which regulates myosin activity at the cortex and cleavage furrow for a successful division in human cells.
INTRODUCTION
Cell division is central to life driving many vital cellular events such as proliferation, propagation, development, and regeneration (Rieder and Khodjakov, 2003). As the cell progresses into mitosis, its morphology and surface undergo dramatic reshaping. Adherent cells transiently round-up during mitosis which fulfills the geometric demand of cell division for accurate chromosome segregation (Lancaster et al., 2013; Stewart et al., 2011b). As chromosomes segregate during anaphase, contractile ring machinery assembles to physically divide cells into two, and the daughter cells spread back to regain their interphase morphology during cytokinesis (Ramkumar and Baum, 2016). Both morphologic changes during mitosis and cytokinesis are primarily driven by the reorganization of actomyosin cytoskeleton network and adhesive systems (Cramer and Mitchison, 1997; Eggert et al., 2006; Rosenblatt, 2008).
At the onset of mitosis, ECT2 activates Rho A at the plasma membrane which activates its downstream effectors, formins and, ROCK (Rho-associated protein kinase)(Ramkumar and Baum, 2016). A member of formins, mDia1 localizes to the cell cortex during mitosis and promotes cortical actin nucleation and polymerization (Bovellan et al., 2014). ROCK is a serine/threonine kinase that activates myosin through phosphorylation of its two main substrates. Phosphorylation of the myosin-binding subunit of myosin phosphatase (MYPT1) by ROCK inactivates myosin phosphatase (Kimura et al., 1996). ROCK can also directly phosphorylate the myosin light chain at Ser-19 (Amano et al., 1996) which results in activation of myosin ATPase that stimulates actin crosslinking and actomyosin contractility (Narumiya et al., 2009).
As a cell rounds up, myosin II progressively accumulates at the cell cortex and the amount of myosin at the cortex is correlated with the rounding pressure (Ramanathan et al., 2015). RNAi-based depletion of cortical myosin II substantially impairs the rounding pressure of mitotic cells (Toyoda et al., 2017). Thus, myosin II plays a fundamental role in cortical reorganization during mitosis by promoting cortical tension (Taubenberger et al., 2020). During cytokinesis, communication between the midzone to the actin cortex through Rho signaling drives the assembly of actomyosin contractile ring machinery in between segregating chromosomes (Eggert et al., 2006; Wadsworth, 2021).
Protocadherins (PCDHs) are the largest subgroup of cell surface proteins in the cadherin superfamily (Morishita and Yagi, 2007; Nollet et al., 2000). Although identified as adhesion molecules, the adhesive roles of PCDHs are context-dependent. PCDHs can form homophilic and heterophilic interactions that mediate and regulate cell-cell adhesion and downstream signaling during embryonic development as well as in adult tissues (Bradley et al., 1998; Chen et al., 2007; Kahr et al., 2013; Kim et al., 1998; Kuroda et al., 2002; Tai et al., 2010). In our previous study, we investigated how cell surface proteins change during cell division and compared the cell surface proteome of interphase and mitosis cells. Our proteomic analysis identified PCDH7 as one of the proteins that are enriched at the mitotic plasma membrane and retraction fibers. Knockdown of PCDH7 using siRNAs caused a decrease in the mitotic rounding pressure albeit not as strong as myosin II (Ozlu et al., 2015).
Here, we aimed to unravel the underlying mechanism of the cell cycle-dependent localization of PCDH7 and dissect its role in cell division. PCDH7 localizes to the cell surface at the onset of mitosis and concentrated at the cleavage furrow during cytokinesis. The mitotic cell surface localization of PCDH7 exhibits a dynamic behavior. Adhesion molecules, the actomyosin network and a palmitoyltransferase, ZDHHC5, were identified as proximal interactors of PCDH7. ZDHHC5 co-localize with PCDH7 at the mitotic cortex and cleavage furrow. Cell cycle specific localization of PCDH7 depends on palmitoylation and ZDHHC5. PCDH7 interacts with myosin phosphatase and the knockout of PCDH7 causes reduced myosin activity at the cleavage furrow thus cytokinesis failures. We propose that spatiotemporal regulation of PCDH7 though a palmitoylation dependent mechanism facilitates fine tuning of myosin activity at the cleavage furrow during cell division.
RESULTS
PCDH7 localizes to the cleavage furrow during cytokinesis
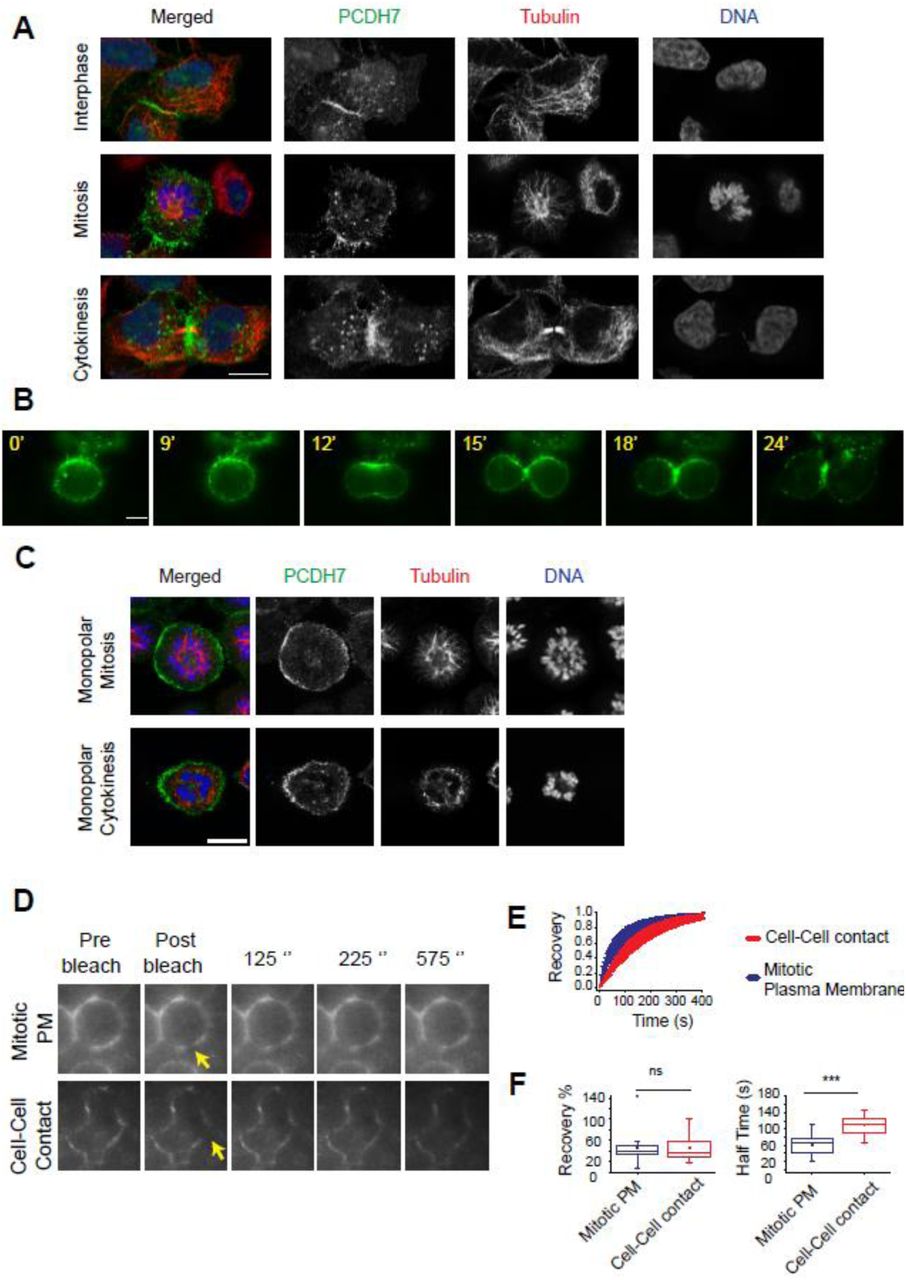
Our previous study revealed that PCDH7 gets enriched at the cell surface as the cell progresses into mitosis (Ozlu et al., 2015). To probe the spatiotemporal regulation of PCDH7, we analyzed its subcellular localization throughout the cell cycle. For this, we preferred to use the PCDH7-GFP-BAC cell line in which, GFP tagged PCDH7 is expressed under its own promoter using bacterial artificial chromosome (BAC) transgenomics (Poser et al., 2008). Immunostaining of PCDH7-GFP-BAC cells showed that PCDH7 localized to the cell-to-cell contacts during interphase (Figure 1A-top panel), enriched at the cell surface, and retraction fibers at the onset of mitosis (Figure 1A-middle panel) and concentrated at the contractile ring and midbody during cytokinesis (Figure 1A-bottom panel).

A. Fluorescence images show the subcellular localization of PCDH7 (green, anti-GFP), Microtubules (red, anti-Tubulin), and DNA (blue, DAPI) in fixed PCDH7-GFP-BAC cells during interphase, mitosis, and cytokinesis.
B. Live imaging snapshots of HeLa S3-PCDH7:GFP cells during cell division. Relative timing is shown in minutes.
C. Fluorescence images show the surface localization of PCDH7 (green, anti-GFP) in monopolar mitosis (top panel) and cleavage furrow localization in monopolar cytokinesis (lower panel) of fixed PCDH7-GFP-BAC cells. Microtubules (red, anti-β-Tubulin) and DNA (blue, DAPI).
D. Representative images for mitotic plasma membrane (upper panel) and cell-cell contact (bottom panel) localization of PCDH7 in FRAP analysis. Yellow arrows indicate the bleached area.
E. Recovery curve of PCDH7 in mitotic plasma membrane (blue) (n=23) and cell-cell contact regions (red) (n=25) after photobleaching.
F. Comparison of recovery halftimes in mitotic plasma membrane (blue) (n=23) and cell-cell contact regions (red)(n=25) (right). Statistics used Mann–Whitney U test.
Scale bars: 10 μm. ***: p<0.001, ns: non-significant.
We observed a similar cleavage furrow and contractile ring localization of PCDH7 in HeLa S3 cells expressing PCDH7:GFP (Figure 1B, Video S1). These results suggest that the localization of PCDH7 is regulated in a cell cycle-dependent manner. In order to understand whether cytokinesis-specific localization is due to cleavage furrow formation but not due to freshly forming cell-to-cell contacts region of two daughter cells, we utilized the monopolar cytokinesis approach (Hu et al., 2008; Karayel et al., 2018; Ozlu et al., 2010). In monopolar cytokinesis, cells are arrested in monopolar mitosis by using Kinesin-5 inhibitor S-trityl-L-cysteine (STC) followed by induction of monopolar cytokinesis using CDK inhibitor Purvalanol A. Chromosomes stay in one pole while plasma membrane forms a bud-like extension where the cleavage furrow is greatly expanded without a cell-to-cell contact region. PCDH7 was enriched at the plasma membrane of monopolar mitosis cells (Figure 1C-top panel) and in monopolar cytokinesis cells it was concentrated at the budding site, which corresponds to the cleavage furrow (Hu et al., 2008; Karayel et al., 2018; Ozlu et al., 2010) (Figure 1C-bottom panel). These results suggest that cleavage furrow localization of PCDH7 is independent of its cell-to-cell contact localization.
PCDH7 is more dynamic at the mitotic cell surface than at the cell-cell contact regions
To address the dynamicity of PCDH7 translocation to the mitotic cell surface by employing Fluorescence Recovery After Photobleaching (FRAP), we compared the mobility of PCDH7:GFP during interphase with mitosis using PCDH7-GFP-BAC cells. The GFP signal within the region of interest (ROI) at the plasma membrane of both mitotic (Figure 1D-top panel) and interphase (Figure 1D-bottom panel) cells were photobleached using a focused laser beam. The fluorescence recovery within ROI was analyzed (Figure 1E) using a double normalization algorithm (Phair et al., 2004) and fixed-sized ROI areas (Kappel, 2004). After photobleaching, a significant difference was not observed between the recovery levels of PCDH7:GFP in cell to cell contacts during interphase (average recovery 46.6%) and at the plasma membrane during mitosis (average recovery 45%), as shown in Figure 1F (left). However, PCDH7:GFP recovered significantly faster at the mitotic cell surface with an average FRAP half time around 62 seconds, when compared to the cell-to-cell contacts in interphase where the average FRAP half time was around 109 seconds (Figure 1F, right). We conclude that PCDH7 is much more dynamic and shows a high turnover rate at the mitotic cell surface in comparison to the cell-to-cell contact regions.
Actomyosin network and adhesion molecules are the proximal interaction partners of PCDH7
To address whether the interaction partners of PCDH7 are involved in its cell cycle-dependent translocation, we employed a proteomic approach using the proximity-dependent biotinylation (BioID) method (Roux et al., 2012). In this method, the protein of interest is fused to a promiscuous biotin ligase BirA*, which biotinylates proteins in proximity to the bait, and then the biotinylated proteins are identified using mass spectrometry. Initial immunofluorescence analysis revealed that the PCDH7:BirA* recombinant protein exhibited the expected localization pattern in both mitosis and interphase cells and specifically biotinylated the vicinity (Figure S1A).To biochemically assess the biotinylation efficiency and specificity, we performed streptavidin affinity purification. Western blotting analysis revealed that PCDH7:BirA* exhibited efficient and distinct biotinylation patterns (Figure S1B) and streptavidin affinity purification can successfully pull down PCDH7 (Figure S1C).
To discover the interphase and mitosis-specific interaction partners of PCDH7, the biotinylated proteins that were isolated from PCDH7 BioID transfected mitotic and interphase cells using streptavidin beads were analyzed in LC-MS/MS. Non-transfected, but biotin supplemented cells were used as a control. The significant interactors were then identified by calculating the spectral count-based fold change between control and PCDH7 BioID cells of 4 biological replicates with a false discovery rate (FDR) of 0.05 (Choi et al., 2015). We identified 78 proteins for mitosis and 129 for interphase cells (Table S1), 49 of which were common in both groups. Those proteins were then analyzed using the STRING database (Szklarczyk et al., 2019) and clustered according to GO and KEGG pathway enrichments (Raudvere et al., 2019) using StringApp (Cline et al., 2007; Doncheva et al., 2019). Significant clusters include cell adhesion and cadherin binding proteins, actomyosin network-related proteins, vesicular proteins, and ERM family proteins (Figure 2A).

A. Mapping the proximity interaction networking of PCDH7. Different colors represent the significantly enriched clusters after GO and KEGG enrichment analysis. Interphase-specific interactions are represented with non-bordered nodes, mitosis-specific interactors are presented in bordered nodes and common interactors are presented with dashed-bordered nodes.
B. Fluorescence images show the co-localization of PCDH7 (green, anti-GFP) and ZDHHC5 (red, anti-ZDHHC5) in fixed PCDH7-GFP-BAC cells during interphase, mitosis, and cytokinesis. DNA (DAPI) is shown in blue.
C. Spatial analysis of the interactions between PCDH7 and ZDHHC5 during cytokinesis by in situ proximity ligation assay (PLA). PCDH7-GFP-BAC cells were used for analysis and PCDH7 was targeted using GFP antibody. Control cells were treated with anti-GFP and anti-ZDHHC5 antibody only. The representative images show the interactions between the examined antibody pairs as red fluorescent PLA puncta. DNA is shown in blue (DAPI) (left). Quantification of the PLA puncta observed in anti-GFP [PCDH7] only antibody-treated cells (n=77), anti-ZDHHC5 only treated cells (n=59) and GFP-ZDHHC5 antibody-treated cells (n=49) (right). Each image is the maximum intensity projection of a Z-stack. The statistic used one-way ANOVA with Sidak’s multiple comparison test.
D. Co-immunoprecipitation analysis of PCDH7 interaction partners in mitotic cells by GFP-trap approach. HeLa S3 cells that stably expressing PCDH7:GFP were used for the analysis, emptyGFP expressing cells were used as control. Whole-cell lysates (input), unbound fractions (Ub), and elutes (E) were analyzed by Western blotting using PCDH7, GFP, MYPT1 and, ZDHHC5 antibodies. Phospho-Histon H3 (pHH3) was used as mitosis marker, α-Tubulin was used as the loading control.
Scale bars: 10 μm, ****:p<0.0001, ***: p<0.001, ns: non-significant. I: Input, U: Unbound, E: Elute.
PCDH7 associates with Palmitoyltransferase, ZDHHC5, during cell division
Among many interesting candidates, one striking interaction partner of PCDH7 was a palmitoyltransferase (ZDHHC5) that adds the palmityl group to the proteins. Palmitoylation is a reversible post-translational modification that is known to affect the hydrophobicity, the membrane domain interactions, and the conformation of transmembrane proteins (Blaskovic et al., 2013). To address whether PCDH7 cooperates with ZDHHC5 during cell division, we first visualized subcellular localization of PCDH7 and ZDHH5 in PCDH7-GFP-BAC cells by using anti-GFP and anti-ZDHH5 antibodies respectively. During interphase both PCDH7 and ZDHHC5 localized to the cell-cell contact regions (Figure 2B-top panel). During mitosis, both proteins decorated the cell surface and retraction fibers (Figure 2B-middle panel) and as cells proceed to cytokinesis, they both accumulated at the cleavage furrow (Figure 2B-bottom panel). To further verify their colocalization, we applied the proximity ligation assay (Soderberg et al., 2006). For this, we used fixed PCDH7-GFP-BAC cells and anti-GFP and anti-ZDHHC5 antibodies to visualize target proteins’ interaction during cytokinesis (Figure 2C). As expected, we observed a significantly higher signal in cells treated with both primary antibodies than the control cells that were treated with only one primary antibody (Figure 2C, right). The PLA signals were accumulated around the cleavage furrow which is in line with the immunofluorescence assay (Figure 2B-bottom panel).
Given their co-localization, we tested whether PCDH7 physically interacts with ZDHHC5 during mitosis. To this end, we performed co-immunoprecipitation using the GFP-trap approach in mitotic PCDH7:GFP expressing cells. We observed that PCDH7 interacts with ZDHHC5 in mitotic cells (Figure 2D).
Palmitoylation is required for the mitotic surface localization of PCDH7
Interaction between PCDH7 and ZDHHC5 prompted us to test whether PCDH7 is palmitoylated. To this end, we performed a palmitoylation assay by using Acyl-biotin Exchange chemistry (ABE) (Cline et al., 2007). Briefly, after performing a high-speed centrifugation-based membrane enrichment, unmodified cysteine thiol groups were blocked using NEM. Half of the sample was treated with HA that cleaves the palmitate groups from cysteines which were then biotinylated using a thiol-reactive biotin molecule. As a negative control, the other half was not treated with HA. Subsequently, thiol-biotinylated proteins were purified by streptavidin beads (Figure 3A). Palmitoylated proteins are expected to be in the hydroxylamine treated (HA+) eluates. Palmitoylation of PCDH7 was tested by Western blotting against anti-PCDH7 antibody; anti-EGFR and anti-Calnexin antibodies were used as positive controls. We observed PCDH7 in the palmitoylated fraction similar to EGFR and Calnexin, which are known to be palmitoylated. As expected, PCDH7 was not detectable in the HA-fraction (Figure 3B).

A. Acyl-biotin Exchange (ABE) chemistry assay to identify palmitoylated proteins. NEM treatment blocks free thiols while Hydroxylamine (HA) treatment cleaves the palmitate groups from cysteines which are then biotinylated using a thiol-reactive biotin molecule. Streptavidin pulldown was used to capture the palmitoylated proteins.
B. Western blot analyses of palmitoylated proteins after ABE assay. HA+ represents hydroxylamine treated sample; HA-represents untreated ones. Proteins that are known to be palmitoylated, EGFR and Calnexin, were used as positive controls.
C. Western blot analyses of the effect of 2BP on plasma membrane localization of PCDH7. Plasma membrane proteins were labeled with amine-reactive biotin and pulled down by streptavidin beads. All fractions (I: Input, U: Unbound, E: Elute) were blotted against EGFR (as a cell surface marker), α-tubulin (as a cytoplasmic marker), and phospho Histone H3 (pHH3) (as a mitotic marker).
To further examine the palmitoylation of PCDH7, we utilized a standard palmitoylation inhibitor, 2-bromopalmitate (2BP) (Webb et al., 2000). We first tested the effect of the palmitoylation inhibitor on PCDH7’s hydrophobicity using TritonX-114 extraction, which separates proteins into detergent and aqueous phases according to their hydrophobic properties (Bordier, 1981). The inhibition of palmitoylation decreased the proportion of PCDH7 in the detergent phase suggesting a reduction in the hydrophobicity of PCDH7 (Figure S2).
To examine the role of palmitoylation in mitotic cell surface localization, we tested the association of PCDH7 to the cell surface after palmitoylation inhibitor (2BP) treatment. For this, we purified cell surface proteins and compared PCDH7 levels in control and 2BP treated cells. Briefly, HeLa S3 cells were treated with 2BP or DMSO (control) overnight, while being synchronized to interphase or mitosis. To enrich for cell surface-exposed proteins, intact cells were labeled with a non-permeable sulfo-NHS-SS-biotin reagent followed by affinity purification of biotinylated proteins using streptavidin (Ozkan Kucuk et al., 2018). While the 2BP treatment did not affect the PCDH7 level exposed to the surface in interphase cells (Figure 3C-left panel), it strikingly decreased the amount of PCDH7 at the mitotic cell surface (Figure 3C-right panel). These results suggest that palmitoylation of PCDH7 is required for its mitotic cell surface localization.
ZDHHC5 directs PCDH7 to the plasma membrane and cleavage furrow in a palmitoylation dependent manner
To further examine the impact of the palmitoylation inhibitor on the subcellular localization of PCDH7 in mitosis and interphase cells, we performed immunostaining and live imaging of a PCDH7-GFP-BAC cell line treated with 2BP. In line with our previous findings (Figure 3), the inhibition of palmitoylation did not show a noticeable effect on the localization of PCDH7 at the cell-to-cell contacts during interphase (Figure S3A). However, it dramatically decreased the surface localization of PCDH7 in mitotic cells and increased the concentration of PCDH7 at the inner part of the cell (Figure 4A). Live imaging of PCDH7 also supported these results (Figure S3B, Video S2).

A. PCDH7 (green, anti-GFP) localization at mitosis in control (DMSO) (top) and palmitoylation inhibitor, 2BP treated (bottom) cells those are stably expressing PCDH7-GFP-BAC. Cells are synchronized to monopolar mitosis. Microtubules (anti-β-Tubulin) are shown in red and DNA (DAPI) in blue (left). Quantification of the plasma membrane enrichment of PCDH7 in the control (n=56) and 2BP treated (n=54) mitotic cells (right). Statistics used unpaired two-tailed t-test.
B. FRAP analysis of PCDH7 in palmitoylation inhibitor 2BP treated cells. Recovery half times of PCDH7 in cell-cell contacts in 2BP treated (n=6) and control (n=25) cells (left). Recovery half times of PCDH7 in the mitotic plasma membrane in 2BP treated (n=9) and to control (n=23) cells (right). Statistics used Mann–Whitney U test.
C. Representative maximum intensity projections of Z-stacks show PCDH7 (green, anti-GFP) localization at the cleavage furrow during cytokinesis in control (top panel) and 2BP treated (bottom panel) PCDH7-GFP-BAC expressing cells. Actin filaments (Phalloidin) are shown in red and DNA (DAPI) in blue (left). Intensity profiles of PCDH7 at the cleavage furrow during cytokinesis in the control (n=13) (gray) and 2BP treated (n=26) (red) cells (middle). Quantification of the PCDH7 intensities at the middle zone (+/- 15%) of intensity profile graph (right). Intensity profiles were obtained in ImageJ software for the indicated region of interest as previously described (Uretmen Kagiali et al., 2020). Statistics used unpaired two-tailed t-test.
Scale bars: 10 μm,*: p<0.05; **: p<0.01; ***: p<0.001 ns: non-significant.
To further investigate the effect of the palmitoylation inhibitor on the dynamic behavior of PCDH7 at the mitotic cell surface, we again took the FRAP approach and measured the extent of PCDH7:GFP recovery at the plasma membrane after photobleaching, in the absence or presence of 2BP. As expected, the inhibition of palmitoylation did not have a significant effect on the FRAP recovery of PCDH7 at the cell-to-cell contacts during interphase (Figure 4B-left). On the other hand, 2BP treatment dramatically increased the FRAP recovery time of PCDH7 at the mitotic plasma membrane (Figure 4B-right). Finally, we analyzed the effect of 2BP on PCDH7’s localization during cytokinesis. Inhibition of palmitoylation explicitly perturbed the cleavage furrow localization of PCDH7 during cytokinesis (Figure 4C-left) and led to a decrease in the fluorescence intensity of PCDH7 at the cleavage furrow (Figure 4C-right). We conclude that palmitoylation is dispensable for a stable cell-to-cell contact localization of PCDH7 during interphase, but essential for the cortical and cleavage furrow localization of PCDH7 during mitosis and cytokinesis, respectively.
Building upon results of palmitoylation-dependent localization of PCDH7 in mitosis and cytokinesis, we next sought to examine the role of ZDHHC5 in PCDH7 localization. Knock-down of expression of ZDHHC5 in HeLa cells is achieved via retrovirus-mediated shRNA against ZDHHC5, a non-targeting shRNA is used as a control (Figure 5A). In line with our previous observation, in control shRNA-treated cells, we observed that ZDHHC5 and PCDH7 largely co-localize at the mitotic cell surface and at retraction fibers (Figure 5B, left-top panel). Strikingly, ZDHCC5 depletion significantly decreased the PCDH7 signal at the mitotic cell surface (Figure 5B, left-bottom panel, Figure 5B-right). Knockdown of ZDHHC5 using siRNA against ZDHHC5 (Figure S4A) also gave similar results (Figure S4B). Cell surface localization of PCDH7 during mitosis was significantly decreased upon siZDHHC5 treatment (Figure S4B-right). Similarly, during cytokinesis PCDH7 was no longer enriched at the cleavage furrow of shZDHHC5 treated cells (Figure 5C). These results suggest that ZDHHC5 directs PCDH7 to the cell surface and cleavage furrow in a palmitoylation-dependent manner.

A. Western blot analysis of shZDHHC5 and shCONTROL cells. shZDHHC5 treatment successfully depleted the ZDHHC5 proteins while PCDH7 levels remain unchanged. α-Tubulin was used as the loading control.
B. PCDH7 (green, anti-GFP) localization in mitotic control (shCONTROL) (top) and ZDHHC5 knockdown (KD) (shZDHHC5) (bottom) cells that are stably expressing PCDH7-GFP-BAC. Cells are synchronized to monopolar mitosis. ZDHHC5 is shown in red (anti-ZDHHC5) and DNA in blue (DAPI) (left). Quantification of the plasma membrane enrichment of PCDH7 during mitosis in the control (n=68) and ZDHHC5 KD (n=52) cells (right). Statistics used unpaired two-tailed t-test.
C. Representative maximum intensity projections of Z-stacks show PCDH7 (green, anti-GFP) localization at the cleavage furrow during cytokinesis in shCONTROL (top panel) and shZDHHC5 (bottom panel) treated PCDH7-GFP-BAC cells. Actin filaments (Phalloidin) are shown in red and DNA (DAPI) in blue (left). Intensity profiles of PCDH7 at the cleavage furrow during cytokinesis in the control (shCONTROL-gray) (n=35) and ZDHHC5 KD (shZDHHC5-red) (n=43) cells (middle). Quantification of the PCDH7 intensities at the middle zone (+/- 15%) of intensity profile graph (right). Intensity profiles were obtained in ImageJ software for the indicated region of interest as previously described (Uretmen Kagiali et al., 2020). Statistics used unpaired two-tailed t-test, error bars: SEM.
Scale bars: 10 μm, *: p<0.05; **: p<0.01; ***: p<0.001 ns: non-significant.
Depletion of PCDH7 and ZDHHC5 lead to multinucleation and abscission defects
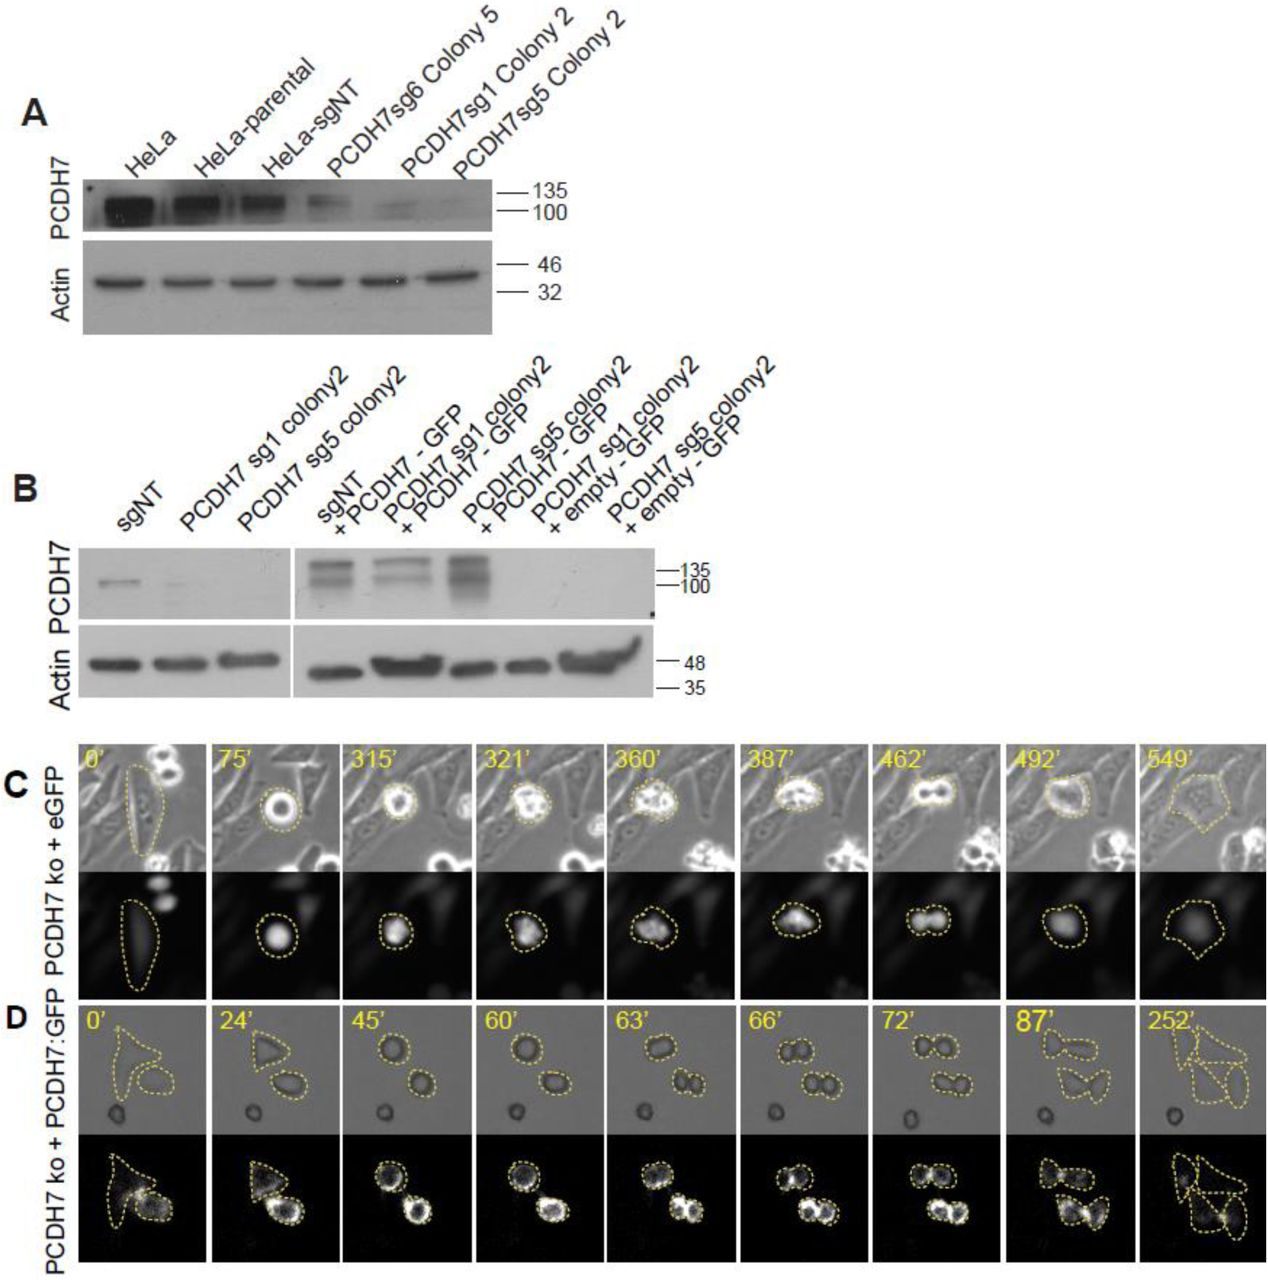
Next, we asked about the function of PCDH7 during cell division. Our previous investigation by siRNA-based depletion of PCDH7 revealed that PCDH7 is required for the development of mitotic rounding pressure at the onset of mitosis (Ozlu et al., 2015). To obtain more rigorous data, we utilized the CRISPR-Cas9 genome editing system (Ran et al., 2013) to knockout PCDH7 in HeLa cells. PCDH7 was targeted using four individual guide RNAs (sgRNA). Control cells were treated with non-targeting guide RNA (sgNT) in parallel. The knockout of PCDH7 in isolated colonies was validated by Western blot analysis (Figure S5A). One colony was selected (sg1 colony2) to proceed with the phenotypic characterization and non-targeting guide RNA (sgNT) treated cells were used as control. PCDH7 expression levels in rescue (PCDH7 KO+PCDH7:GFP) and rescue-control (PCDH7 KO + eGFP) cells were also validated with Western blotting analysis (Figure S5B).
We first examined the extent of cell division failures in PCDH7 knockout (KO) HeLa by analyzing the multinucleation percentage in fixed cells. We observed a moderate but statistically significant increase in the multinucleation rate in PCDH7 KO HeLa S3 cells (Figure 6A-red bar, Figure S6A). The expression of PCDH7:GFP in PCDH7 KO significantly decreased the multinucleation percentage back to control levels thus rescued the phenotype (Figure 6A-navy blue bar).

A. Quantification of multinucleation percentages of control (2.3%, n=4337, gray), PCDH7 knockout (3.3%, n=4582, red) and rescue cells (+ PCDH7:eGFP) (2%, n=4591, navy blue). Statistics used one-way ANOVA with Tukey’s multiple comparison test, error bars: SEM
B. Comparison of the mitosis duration in control (n=142, gray), PCDH7 knockout (n=286, red), rescue-control (PCDH7 KO + eGFP) (n=189, blue) and rescue (PCDH7 KO+ PCDH7:GFP) (n=206, navy blue) cells. Mitosis duration is determined from cell rounding until the initiation of cleavage furrow formation. Statistics used one-way ANOVA with Tukey’s multiple comparison test, error bars: SEM
C. The quantification of division abnormalities in control (n=142, gray), PCDH7 knockout (n=286, red), rescue-control (PCDH7 KO + eGFP) (n=189, blue) and rescue (PCDH7 KO + PCDH7:GFP) (n=206, navy blue) cells. Statistics used one-way ANOVA with Tukey’s multiple comparison test, error bars: SEM.
D. Representative live imaging snapshots of cell division in control cells (top panel) and PCDH7 knockout cells (bottom panel). Dashed lines indicate cell margins. Relative timing is shown in minutes.
E. Quantification of multinucleation percentages of control (shCONTROL) (n=1415, gray) and ZDHHC5 knockdown (shZDHHC5) (n=1276, red) cells. Statistics used t test, error bars:SEM.
F. The quantification of division abnormalities in control (shCONTROL) (n=214, gray) and ZDHHC5 knockdown (shZDHHC5) (n=230, red) cells. Statistics used unpaired two-tailed t-test, error bars: SEM.
G. Representative live imaging snapshots of cell division in control cells (shCONTROL) (top panel) and ZDHHC5 knockout (shZDHHC5) cells (bottom panel). Dashed lines indicate cell margins. Relative timing is shown in minutes.
Scale bars: 10 μm. *: p<0.05; **: p<0.01; ***: p<0.001.
To characterize the defect leading to multinucleation, we performed live imaging of both control and PCDH7 KO cells. PCDH7 KO cells (Figure 6B-red bar) spent significantly longer time in mitosis compared to control cells (Figure 6B-gray bar). This could be rescued by the ectopic expression of PCDH7:GFP (Figure 6B-navy blue bar) but not with the expression of the backbone vector (eGFP) alone (Figure 6B-blue bar). In agreement with an increased rate of multinucleation, about 50% of PCDH7 KO cells showed division abnormalities or failed to divide and died (Figure 6C-red bar, Figure S6C). In about 20% of PCDH7 KO cells, the cleavage furrow initially formed, but the failure in the completion of cleavage furrow ingression or abscission resulted in the frequent reunion of daughter cells (Figure 6D, Video S3, Figure S6C). About half of these multinucleated cells died after re-merging (Figure S6C). While the expression of PCDH7:GFP in knockout cells successfully rescued this phenotype (Figure 6C-navy blue bar, Figure S5D, Video S3), the expression of GFP alone did not (Figure 6C-blue bar, Figure S5C, Video S3). This result suggests that knock-out of PCDH7 leads to cell division abnormalities such as furrow ingression and abscission failures.
As ZDHHC5 directs PCDH7 to the cleavage furrow, next we examined the role of ZDHHC5 in cell division. Intriguingly, similar to PCDH7, we observed that in ZDHHC5 shRNA cells had more multinucleation (8.5%) in contrast to cells treated with control shRNA (4.6%) (Figure 6E, Figure S6B). Live imaging of shCONTROL and shZDHHC5 treated cells also revealed more abnormalities such as abscission failure and multipolar cell division during cytokinesis (Figure 6F). Like PCDH7 depletion, in shZDHHC5 cells, although cleavage furrow initially forms, regression of cleavage furrow results in binucleated cells (Figure 6G, Video S4). To draw a conclusion, both ZDHHC5 and PCDH7 are indispensable for cytokinesis and furrow ingression.
PCDH7 is required for full myosin II activation during cytokinesis in HeLa S3 cells
To gain insight into the mechanisms behind the role of PCDH7 during cytokinesis, we reviewed the interaction partners of PCDH7 that might be involved in its function in cytokinesis. Candidate interactors include multiple proteins related to the actomyosin network (Figure 2A). Another study from our group has shown that PCDH7 interacts with Myosin Phosphatase in migrating RPE cells (Qureshi et al., 2021). Both PP1cβ, the catalytic subunit, and MYPT1, the myosin targeting subunit of myosin phosphatase holoenzyme (Shirazi et al., 1994) were detected as an interactor of PCDH7 in migrating cells (Qureshi et al., 2021). Based on those findings we hypothesized that PCDH7’s function during cytokinesis may be related to its interaction with Myosin Phosphatase. To investigate whether myosin phosphatase and PCDH7 interact during cell division, we tested their association via co-immunoprecipitation using GFP-trap protocol in PCDH7:GFP expressing cells synchronized in mitosis. We observed MYPT1 in the eluants of PCDH7:GFP expressing cells but not in emptyGFP expressing cells (Figure 2D). Next, we examined their localization in dividing cells. MYPT1 enriched at the plasma membrane albeit not as strong as PCDH7 (Figure 7A, top). During cytokinesis, they both accumulated at the cleavage furrow, with a partial co-localization (Figure 7A, bottom). To further verify the interaction between PCDH7 and MYPT1 during cytokinesis, we again applied the proximity ligation assay (PLA) by using PCDH7-GFP-BAC cells. Anti-GFP and anti-MYPT1 antibodies were used to visualize PCDH7 and MYPT1 interaction (Figure 7B, left). In comparison to the single antibody treatment controls, the PLA signal was higher in both antibodies treated samples suggesting a direct interaction between MYPT1 and PCDH7 (Figure 7B, right).

A. Localization pattern of PCDH7 (green, anti-GFP) and MYPT1 (red, anti-MYPT1) in mitosis (top panel) and cytokinesis (bottom panel) (left). Inlets indicate the zoom area (right). DNA (DAPI) is shown in blue.
B. Spatial analysis of the interactions between PCDH7 and MYPT1 during cytokinesis by in situ proximity ligation assay (PLA). PCDH7-GFP-BAC cells were used for analysis and PCDH7 was targeted using GFP antibody. Control cells were treated with anti-GFP and anti-MYPT1 antibody only. The representative images show the interactions between the examined antibody pairs as red fluorescent PLA puncta. DNA is shown in blue (left). Quantification of the PLA puncta observed in anti-GFP [PCDH7] only antibody-treated cells (n=32), anti-MYPT only treated cells (n=34), and GFP-MYPT1 antibody-treated cells (n=42) (right). Each image is the maximum intensity projection of a Z-stack. Statistics used one-way ANOVA with Tukey’s multiple comparison test, error bars: SEM.
C. Represe ntative fluorescence images displaying phospho-myosin II (S19) (green), actin filaments (red, Phalloidin), and DNA (blue, DAPI) localization through cytokinesis in control (top panel) and PCDH7 knockout (middle panel) cells. Rescue cells that express PCDH7:GFP are represented in the bottom panel; phospho-myosin II (S19) (red), DNA (blue, DAPI). Maximum intensity projections of Z stacks are shown. (left). Intensity profiles of pMyosin at the cleavage furrow during cytokinesis in the Control (gray) (n=24), PCDH7 KO (red) (n=24) and rescue (PCDH7 KO+ PCDH7:GFP) (blue) (n=41) (middle). Quantification of the pMyosin intensities at the middle zone (+/- 15%) of intensity profile graph (right). Intensity profiles were obtained in ImageJ software for the indicated region of interest as previously described (Uretmen Kagiali et al., 2020). Statistics used one-way ANOVA with Tukey’s multiple comparison test, error bars: SEM.
Scale bars: 10 μm, *: p<0.05; **: p<0.01; ***: p<0.001.
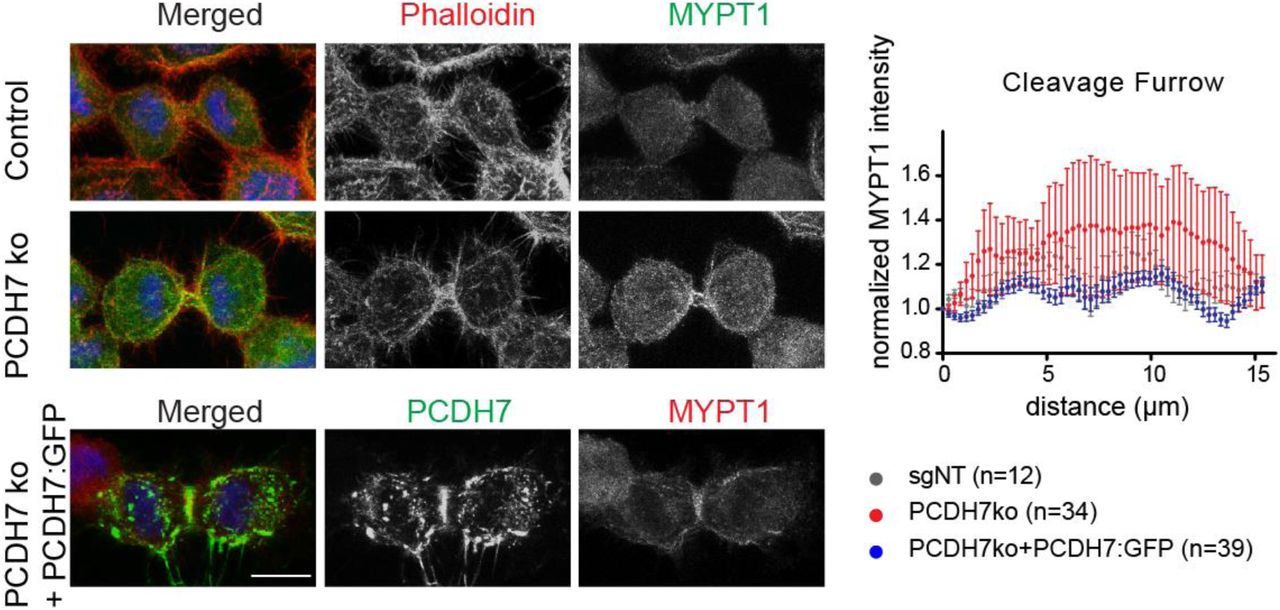
The interaction between Myosin phosphatase and PCDH7 prompted us to hypothesize that PCDH7 plays a role in the activation of myosin during cleavage furrow constriction. To test this, we analyzed the phospho-myosin II (S19) (Matsumura et al., 1998) levels at the cleavage furrow in PCDH7 KO cells. The phosphorylated myosin is significantly enriched at the cleavage furrow in control cells (Figure 7C, gray). In PCDH7 KO cells phospho-myosin II intensity is significantly reduced at the cleavage furrow (Figure 7C, red) while MYPT1 levels remained unchanged (Figure S7). The expression of ectopic PCDH7 in PCDH7 KO cells significantly replenished the phospho-myosin levels (Figure 7C, blue). Taken together, our data suggest that PCDH7 positively regulates myosin II activity at the cleavage furrow.
DISCUSSION
This study aimed to understand how PCDH7 becomes enriched on the surface of mitotic cells, and its function in cell division. Our analysis revealed an unprecedented role of palmitoylation in the translocation of PCDH7 to the mitotic cell surface and cleavage furrow. Palmitoylation is a reversible posttranslational modification that plays a key role in controlling protein targeting by increasing the hydrophobicity of a protein (Linder and Deschenes, 2007). Our data support a mechanism by which palmitoylation of PCDH7 stabilizes its cell surface and cleavage furrow localization. Indeed, the cell surface and cleavage furrow localization during mitosis and cytokinesis respectively, was dependent on the palmitoylation, whereas the localization to the cell-to-cell contacts during interphase was not affected by the palmitoylation inhibition. This suggests that two different pools via different mechanisms are targeted to the mitotic cell surface and cell-to-cell contact regions. This notion is also supported by the FRAP analysis which reveals that the turnover rate and dynamics of these two pools are different. Our analysis revealed that PCDH7 gets palmitoylated however our attempts of finding palmitoylation sites by mutating some potential cysteine residues that affect protein localization failed. It is rather challenging to determine the palmitoylation sites because of the lack of a consensus motif. Besides cysteine, palmitoylation can also occur on serine and lysine residues. In addition, a cumulative effect of palmitoylation on multiple cysteines, and even on serine or lysine (Brownlee and Heald, 2019) residues might be involved, thus mutating individual residues might not be enough to mimic the unpalmitoylated form. Similarly, PCDH1, which shares 46% homology with PCDH7, was also stated to be palmitoylated and localize to the membrane in a palmitoylation-dependent manner. However, mutating one palmitoylated cysteine residue was not enough to mimic the palmitoylation inhibitor and exhibit the membrane localization phenotype (Kahr et al., 2013). More work is required to understand the molecular details of PCDH palmitoylation.
Our BioID based proximity interactome identified a palmitoyl transferase ZDHHC5, as a significant interactor of PCDH7. In contrast to the majority of PAT members that localize to Golgi or endoplasmic reticulum, ZDHHC5 localizes in the plasma membrane (Ohno et al., 2006). ZDHHC5 has been implicated in multiple cellular processes such as endocytosis, cell adhesion, Na-pump activity, and pathogen-host interaction partly by regulating the localization of related proteins (Plain et al., 2020; Pradhan et al., 2021; Woodley and Collins, 2019, 2021). In this study for the first time, we analyzed the function of ZDHHC5 in the context of cell division. At metaphase, ZDHHC5 localizes to the mitotic cell surface and retraction fibers and it concentrates at the cleavage furrow during cytokinesis. The translocation of PCDH7 to the mitotic cortex and cleavage furrow occurs in ZDHHC5 dependent manner. Loss of ZCHHC5 caused cytokinesis defects and statistically significant increase in the rate of cleavage furrow regression and multinucleated cells. Imaging of protein fatty acylation in cells undergoing cell division revealed that at metaphase S-palmitoylation enriches at the cell surface and around the spindle, as cells progress into cytokinesis, palmitoylated proteins are concentrated at the cleavage furrow (Hannoush and Arenas-Ramirez, 2009). Based on those findings, it is entirely possible that PATs and partly ZCHHC5 may have a wider role in organizing the mitotic cell cortex and targeting cell division-related proteins to the plasma membrane and cleavage furrow. PCDH7 might be the very first example of many of those proteins. Although many studies have indicated the role of protein palmitoylation in protein trafficking (Linder and Deschenes, 2007) and different intracellular signaling pathways (Resh, 2006), the importance of palmitoylation in the context of cell division has been emerging only recently. Depalmitoylation activity has been shown to be required for the unequal partitioning of the Notch and Wnt signaling during asymmetric cell division (Stypulkowski et al., 2018). Palmitoylation-dependent membrane association of importin α has been shown to affect the mitotic spindle and nuclear scaling during Xenopus embryogenesis (Brownlee and Heald, 2019). Our findings attribute new functional aspects to the role of palmitoylation in cell division. Future studies will expand the palmitoylation dependent regulatory mechanisms during cell division by investigating palmitoyltransferases and their target molecules that function in mitosis and cytokinesis.
What is the function of PCDH7 during cell division? Our previous study showed that PCDH7 is required for the development of full mitotic rounding pressure (Ozlu et al., 2015). Rounding pressure is dependent on myosin II activity (Stewart et al., 2011a; Stewart et al., 2011b). In the present study, we have shown that the knockout of PCDH7 caused a statistically significant increase in mitosis duration and cytokinesis failure in HeLa cells. Even though PCDH7 KO cells were able to initiate furrowing, furrow regression caused abnormalities in cytokinesis. The multinucleation phenotype was moderate but significant. In our previous study, although we observed a reduced rounding pressure in PCDH7 siRNA cells, the cells were still able to round up. The weakness of the observed phenotypes may be due to a functional redundancy between PCDH1 and PCDH7 and the fact that multiple parallel pathways act together for mitotic rounding and cytokinesis (Cramer et al., 1994; Ramkumar and Baum, 2016).
Actomyosin network is important for mitotic rounding and cleavage furrow formation and both processes seem to be affected in the absence of PCDH7. Indeed, we observed that active myosin levels at the cleavage furrow were significantly reduced in the absence of PCDH7 when compared to the control cells. Previously it was reported that PCDH7 increases phospho-myosin light chain levels to enhance anchorage-independent cell growth (Wang et al., 2020). Similarly, in a parallel study, we observed that PCDH7 enhanced phospho-myosin levels during cell migration in Retinal Pigment Epithelial (RPE) cells and PCDH7 interacts with PP1cβ, the catalytic subunit, and MYPT1, the myosin targeting subunit of myosin phosphatase holoenzyme (Qureshi et al., 2021). Previous studies also reported interaction between PCDH7 and phosphatase subunits including PP1α and PPP2R1A (Wang et al., 2020; Zhou et al., 2017). Our analysis also identified an interaction between PCDH7 and myosin phosphatase by immunoprecipitation and PLA assays. We observed that both PCDH7 and MYPT1 get enriched at the cleavage furrow during cytokinesis. Our results support a model where palmitoylation and ZDHHC5 dependent plasma membrane and cleavage furrow localization of PCDH7 regulates the activity of myosin through its interaction with myosin phosphatase (Figure 8). Loss of PCDH7 releases its quenching effect for Myosin phosphatase, which leads to reduced myosin activity thus, impairments during cell rounding and cytokinesis. Given the fact that myosin phosphatase has a wide range of targets during the cell cycle where it regulates their phosphorylation levels through dephosphorylation including ERM and Aurora B (Capalbo et al., 2019; Kiss et al., 2019; Qureshi et al., 2021), it is very likely that the pathway that we describe here is not limited to the regulation of myosin.

Localization of PCDH7 (green) to the cell surface during mitosis and to the cleavage furrow during cytokinesis is governed by its interaction with ZDHHC5 (blue) and palmitoylation (red star).
Interaction of PCDH7 with MYPT1 (gray), prevents dephosphorylation of phosphorylated (pink) Myosin (purple) (pMyosin) by MYPT1 and ensures elevated pMyosin levels at the cleavage furrow, thus supports cytokinesis. PCDH7 knockout leads to decreased pMyosin levels at the cleavage furrow and causes cell division errors.
In summary, our study suggests a new pathway for the cell cycle dependent protein localization during cell division. We suggest that the ZDHHC5 dependent targeting of PCDH7 to the cell cortex and cleavage furrow regulates myosin phosphorylation through PCDH7-Myosin Phosphatase interaction. Further investigation of the underlying molecular mechanism of cortical regulation during cell division will unravel the fundamental mechanisms existing in human cells.
MATERIALS AND METHODS
Cell Lines and Culture
HeLa S3 cells (ATCC CCL-2.2, female) and HEK293T cells (a kind gift from Dr. Tamer Önder) were grown in Dulbecco’s modified Eagle’s medium (DMEM) (Sigma-Aldrich, D6429) supplemented with 1% penicillin-streptomycin (P/S) (Capricorn, PS-B) and 10% fetal bovine serum (FBS) (Gibco, 10270106). PCDH7-GFP-BAC (MCP Ky 5914 T457) (Poser et al., 2008) transgenic cell line was a kind gift from Dr. Ina Poser and was grown in DMEM supplemented with 1% P/S, 10% FBS, and 400 μg/ml G418 (Santa Cruz, sc-29065A).
To inhibit the palmitoylation, cells were incubated with 100 μM 2-Bromopalmitate (2BP) (Sigma, 21604) overnight (Webb et al., 2000).
Cell Synchronization
Cells were synchronized to mitosis, interphase (Ozlu et al., 2010) and, cytokinesis (Hu et al., 2008; Karayel et al., 2018) as described previously.
Briefly, HeLa S3 cells were incubated with 2 mM thymidine (Santa Cruz, sc-296542) containing media for 20 hours, then released with excessive PBS washes. Fresh complete media was then added and incubated for 8 hours. After the second thymidine block for another 19 hours, interphase cells were collected or fixed for immunofluorescence analysis. For monopolar mitosis, cells were released from the second thymidine block by PBS wash and incubated with fresh media containing 10 μM S-trityl-L-cysteine (STC) (Sigma-Aldrich, 164739) for 20 hours. For the monopolar cytokinesis, cells were released from the thymidine block by PBS wash, incubated with fresh media containing 10 μM STC for 16-20 hours, then incubated with 100 μM purvalanol A (Tocris Bioscience, 1580) for 15 minutes. For bipolar synchronization, cells were released from the thymidine block by PBS wash and incubated with 10 ng/ml of nocodazole (Calbiochem, 487928) for 5 hours. At the end of nocodazole incubation, cells were arrested in mitosis. For cytokinesis, cells were released from mitosis by removal of the nocodazole from the medium and incubated for 1 hour in the complete medium to collect cytokinesis cells.
Immunostaining and Microscopy
In order to visualize the PCDH7, PCDH7-GFP-BAC cells that stably express PCDH7:GFP near-physiological levels were used for both live imaging and fixed imaging experiments. For fixed images, the GFP signal of PCDH7-GFP-BAC cells was amplified using the GFP antibody. For immunostaining, cells were plated on coverslips (12 mm) fixed with 3% paraformaldehyde (PFA), blocked, and incubated with primary and secondary antibodies in 2% BSA in PBS containing 0.1% Triton-X. The following antibodies and reagents were used in immunostaining experiments: Beta-Tubulin (Cell Signaling, CS2128S), Alpha Tubulin (Cell Signaling, 3873S), Tubulin (Abcam, ab6160), GFP (non-commercial/Invitrogen, A11120), HA (Abcam, ab16918), pMyosin (Cell Signaling, CS3675), ZDHHC5 (Atlas Antibodies, HPA014670), MYPT1 (Santa Cruz, 514261). Alexa Fluor®-488 and Alexa Fluor®-555 (Cell Signaling), Streptavidin-Alexa Fluor 488 (Invitrogen, S32354), Phalloidin iFlour (Abcam, ab176756), DAPI (Sigma Aldrich, D8417).
Confocal images were taken either by Nikon-Eclipse 90i (EZ-C1 software) confocal microscope using the 60x Plan Apo 1.4 NA oil-immersion objective or by of Leica DMi8/SP8 TCS-DLS (LAS X Software) laser scanning confocal microscope using 40× Plan Apo 1.3 NA and 63x Plan Apo 1.4 NA oil-immersion objectives.
Prior to live-cell imaging, cells were plated either on ibiTreat, ibidi μ-Slide 8 Well (ibidi, 80826) or μ-Dish 35 mm (ibidi, 81156) plates. Live imaging experiments were performed using Zeiss Cell Observer SD spinning disk microscope (ZEN Software) with 20x Plan Apo 0.8 NA objective and Leica DMi8 widefield fluorescence microscope (LAS X Software) with 63× Plan Apo 1.4 NA oil immersion objective or 20× PL FLUOTAR L 0.40 NA objective equipped with 37°C and 5% CO2 chambers. Single images or Z-stacks were acquired every 3 minutes and a single focal plane was used in the figures unless specified in the figure legends.
Apart from FRAP data, all images were analyzed in Fiji. Graphs and statistical data were generated in GraphPad Prism. Statistical details of each experiment including the statistical test used, the exact value of n, and definition error bars can be found in the figure legend for each figure.
Fluorescence Recovery After Photobleaching (FRAP) Analysis
Microscopy setup
The microscopy set-up included a frequency-doubled femtosecond-pulsed Ti:Sa solid-state tunable laser source (Chameleon Ultra II, Coherent) equipped with a second harmonic generator. Laser output was tuned to 488 nm and the beam was directed through mirrors and a Keplerian telescope to the inverted microscope (Eclipse TE2000-U; Nikon) equipped with a dichroic mirror (Chroma, Q495LP) and 60X oil-immersion objective (Nikon Apo TIRF, NA=1.49). A 300 mm focal length lens was placed right before the microscope to focus the laser at the back focal plane of the microscope objective to obtain wide-field illumination. The microscope was equipped with two different cameras for brightfield and fluorescence image acquisitions. Brightfield images were captured by a CCD camera (Thorlabs, DCU223M). Fluorescence images were captured by an EMCCD camera (Hamamatsu ImagEM C9100-13) placed after an emission filter with a pass band 530 ± 30 nm. Photobleaching was performed by removing the neutral density optical filter and the lens right before the microscope, and simultaneously focusing the laser light at the desired area for 1 second. FRAP image acquisition was done every five seconds using an automated shutter and a minimum of 130 frames were captured following photobleaching of each sample.
Data Processing
Image analysis was done by using a MATLAB code based on the double normalization algorithm (Phair et al., 2004). In this method, the overall decrease in the fluorescence intensity of the samples is also considered and the normalized intensity of the region of interest (ROI). Inormalized is given by:

In which, Itotal, prebleached and Ibleached region, prebleached are prebleached intensities of the whole cell and the ROI, respectively. Ibleached region(t) and Itotal (t) are corresponding intensities at time t. BG is the intensity of the background region. The total number of frames and the first post bleached frame was defined for each sample. The size of the selected background and the ROI areas in each sample was fixed to 14×14 pixels (Kappel, 2004). Unhealthy cells and the motile cells that obstruct the tracking of the ROI throughout the frames are discharged from the data. Obtained Inormalized(t) data for each cell then is fitted to 1 − Ae−at − Be−bt (Phair et al., 2004) to get half time values t1/2. The recovery percentage was also calculated for each cell. The Mann–Whitney U test was applied to reveal statistical differences in the recovery and the half-time between samples. Average recovery curves for each group of cells (cell-cell contacts in interphase and mitotic plasma membrane) were obtained by normalizing all individual recovery graphs recorded within a group to 1 and calculating the average points as well as standard deviations of the recovery data at specified frames (time instances) after photobleaching.
Transfection and Viral Transduction
Transient transfection of cells was performed using polyethylenimine (PEI) or Lipofectamine 2000 protocols (Invitrogen, 11668019). For PEI protocol, transfection mixtures were prepared in Opti-MEM reduced serum medium (Invitrogen,31985047) using PEI with 60 μg DNA in the 3:1 ratio. After 30 minutes of incubation at room temperature, the transfection mixture was added onto cells that were in fresh complete media. For Lipofectamine 2000 protocol, the manufacturer’s instructions were followed.
For viral transduction, lentiviruses were packaged in HEK293T cells using PEI transfection of target sequence containing vector (pLenti), packaging vector (psPAX2, Addgene 12260), and envelope vector (pVSVg, Addgene 8454). Viral particles were collected after 48 and 72 hours of transfection and used to infect HeLa S3 in the presence of 2 μg/ml protamine sulfate (Sigma-Aldrich, P4505) as coadjutant. Transduced cells were then selected with the appropriate selective antibiotic.
Analysis of Proximal Interactions by BioID
PCDH7 sequence was amplified from PCDH7:eGFPN1 and cloned into BioID vector (pcDNA3.1 MCS-BirA* (R118G) Addgene; 36047). Appropriate restriction enzyme cut sites were introduced during amplification using specific primers: NheI_PCDH7_F 5’-GTCAGCTAGCACCATGCTGAGGATGCGGACC-3’, EcoRI_PCDH7_R 5’-GCTAGAATTCGCCCTCCCTGGGATATTTAAATATATTTG-3’.
To obtain cell cycle-specific proximal interactors, double thymidine/STC synchronization methods were modified for BioID protocol (Roux et al., 2012). Briefly, cells were transfected with BioID vector during the release after the first thymidine block (2 mM) and kept in the transfection media during the second thymidine block (2 mM). For interphase cells, cells were incubated with fresh media containing thymidine (2 mM) and 50 μM Biotin (Invitrogen, B20656). For mitosis cells, thymidine was released, and cells were incubated with fresh media containing 10 μM STC and Biotin. Both groups were either fixed for immunostaining or pelleted after 20 hours of incubation.
Cell pellets were lysed in lysis buffer (50 mM Tris, pH 7.4; 500 mM NaCl; 0.4% SDS; 5 mM EDTA; 2% TritonX; 1 mM DTT; Protease Inhibitor) and incubated with Streptavidin beads (Pierce,53117) overnight at 4°C in a tube rotator. Fractions of the whole-cell lysate (WCL) and Unbound (Ub) were kept at -20°C for further analysis. Beads were washed twice with Wash Buffer 1 (2% SDS in dH2O), once with Wash Buffer 2 (2% deoxycholate; 1% TritonX; 50 mM NaCl; 50 mM Hepes, pH 7.5; 1 mM EDTA), once with Wash Buffer 3 (0.5% NP-40; 0.5% deoxycholate; 1% TritonX; 500 mM NaCl; 1 mM EDTA; 10 mM Tris, pH 8.1) and once with Wash Buffer 4 (50 mM Tris, pH 7.4; 50 mM NaCl). For Western blot analysis, bound proteins were eluted from the streptavidin beads with 50 μl of Laemmli-DTT sample buffer containing 500 nM D-Biotin at 98°C by centrifugation at 1,000 rpm mixing for 10 minutes. For mass spectrometry analysis, on-bead tryptic digestion was performed. Briefly, beads were washed with urea buffer (8 M urea (Sigma-Aldrich, A2383) in 0.1 M Tris/HCl pH 8.5) Then, bead-bounded proteins were reduced with 100 mM Dithiothreitol (DTT) (Sigma-Aldrich, 43815) in urea buffer at 56°C for 30 minutes. After reduction, cysteine residues were alkylated using 100 mM iodoacetamide (Applichem, A1666) in urea buffer with 20 minutes incubation in dark. After alkylation, beads were washed with 50 mM ammonium bicarbonate (Applichem, A3583) and incubated with Trypsin (Thermo Scientific,25247) at 37°C overnight (14-16 hours) in ThermoMixer (Eppendorf™) with 1,000 rpm shaking. The next morning, digested peptides were collected and desalted using C18 STAGE Tips and analyzed in Thermo Scientific Q-Exactive Orbitrap LC-MS/MS mass spectrometer. The experiment was performed in 4 biological replicates with a minimum of 2 technical replicates for each.
Mass Spectrometry and Data Analysis
Peptides were analyzed by online C18 nanoflow reversed-phase nLC (NanoLC-II, Thermo Scientific) or C18 nanoflow reversed-phase HPLC (Dionex Ultimate 3000, 3500 RSLC nano, Thermo Scientific) connected with an orbitrap mass spectrometer (Q Exactive Orbitrap, Thermo Scientific). Samples were separated in an in-house packed 100 μm i.d. × 23 cm C18 column (Reprosil-Gold C18, 5 μm, 200 Å, Dr. Maisch) using 80-minutes linear gradients from 5-25%, 25-40%, 40-95% acetonitrile in 0.1% formic acid with 300 nL/min flow in 100 minutes total run time. The scan sequence began with an MS1 spectrum (Orbitrap analysis; resolution 70,000; mass range 400–1,500 m/z; automatic gain control (AGC) target 1e6; maximum injection time 32 ms). Up to 15 of the most intense ions per cycle were fragmented and analyzed in the orbitrap with Data Dependent Acquisition (DDA). MS2 analysis consisted of collision-induced dissociation (higher-energy collisional dissociation (HCD)) (resolution 17,500; AGC 1e6; normalized collision energy (NCE) 26; maximum injection time 85 ms). The isolation window for MS/MS was 2.0 m/z.
Raw files were processed with Proteome Discoverer 2.3 (Thermo Scientific) software. Carbamidomethylation of cysteine residues was used as fixed modification, and acetylation (protein N-termini) and oxidation of methionine residues were used as variable modifications. Maximal two missed cleavages were allowed for the tryptic peptides. The precursor mass tolerance was set to 10 ppm and fragment mass tolerance was set to 0.02 Da. Both peptide and protein false discovery rates (FDRs) were set to 0.01. The other parameters were used with default settings. The database search was performed against the human Uniprot database (release 2015) containing 21,039 entries using the SEQUEST HT search engine integrated into the Proteome Discoverer environment.
Network Analysis
The spectral counts of proteins were used to calculate fold change ratios and FDR values for identified proteins using the qspec-param program of qprot_v1.3.5 (Choi et al., 2015). Proteins are filtered with a 0.05 cut-off for FDR values. Significant protein hits were loaded into the String database v11.0 (Szklarczyk et al., 2019) by Cytoscape StringApp (Doncheva et al., 2019) with 0.7 confidence. MCODE clustering of the network was performed by Cytoscape (version 3.7.2) and its plugin clustermaker (Cline et al., 2007). GO and KEGG enrichment analysis of the network was performed via g:Profiler (Raudvere et al., 2019).
Proximity Ligation Assay (PLA)
HeLa S3 PCDH7-GFP-BAC cells were used to examine the proximity of PCDH7 with MYPT1 and ZDHHC5 by Duolink PLA Kit (Sigma-Alrich, 92101) based on the manufacturer’s procedure. Briefly, cells were seeded onto glass coverslips and synchronized to cytokinesis with bipolar synchronization. The cells were fixed by using 3.2% PFA in PBS and permeabilized by washing with 0.1 % TritonX-TBS. For blocking, cells were incubated with Duolink blocking solution for 30 minutes at 37ºC. Then, the coverslips were incubated overnight at 4ºC with the corresponding pair of primary antibodies: anti-GFP (Invitrogen, A11120) for PCDH7 and anti-ZDHHC5 (Sigma-Alrich, HPA014670)) or anti-GFP (non-commercial) for PCDH7 and anti-MYPT1 (Santa Cruz, 514261). “Only one primary antibody-treated” samples for each antibody were used as controls. Then, the cells were washed with Wash Buffer A for 10 minutes at room temperature and incubated with PLA probes for 1 hour at 37ºC. After another wash, cells were treated with the ligase for 30 minutes at 37ºC. The washing step is repeated with wash buffer A, then the cells were incubated with the polymerase for 100 minutes at 37ºC. After final washes using wash buffer B, the slides were mounted with a coverslip by using Duolink Mounting Medium with DAPI and incubated for 15 minutes before sealing.
GFP-trap Pull-Down Assay for the Protein Interactions
HeLa S3 PCDH7:GFP expressing cells were used for pulldown assay and HeLa S3 emptyGFP cells were used as control. Cells were arrested in mitosis with double thymidine/STC synchronization and mitotic cells were pelleted. The pellets were dissolved in PBS with 1% Triton X-100, EDTA-free protease inhibitor (Thermo Pierce, 88666), and Phostop (Roche, 4906845001) and then homogenized and centrifuged at 14,000 rpm for 10 minutes at 4ºC. Protein concentrations were determined by BCA protein assay (Pierce, 23225) and equal protein from each sample was loaded into pre-conditioned GFP-Trap A beads (gta-20; ChromoTek). Aliquots of the input sample(I) were saved for further analysis. After incubation for 3 hours at 4ºC, the unbound samples (Ub) were collected, and GFP-Trap A beads were washed with ice-cold PBS three times. To elute the bound proteins, GFP-Trap A beads were resuspended in 2x Laemmli with 100mM DTT and boiled for 10 minutes at 95ºC
Western Blotting Analysis
Samples were separated by molecular weight using 10% SDS-PAGE gels and transferred to a nitrocellulose membrane. The membrane was blocked with 4% w/v nonfat dry milk in TBS-0.1% Tween-20 and probed with 1 μg/ml of the described primary antibody diluted in 2% BSA TBS-0.1% Tween-20. The signal was visualized using ECL (Pierce, 32106) detection of the HRP-conjugated secondary antibodies (Cell Signaling, 7074S, 70765). The following primary antibodies were used in the Western blot analysis: PCDH7 (Abcam, ab139274), EGFR (Santa Cruz, SC-03), Tubulin (Cell Signaling, 3873), Actin (Abcam, ab6276), Phospho-Histone H3 (Upstate; 06-570) and Biotin (non-commercial), GFP (non-commercial), ZDHHC5 (Atlas Antibodies, HPA014670), MYPT1 (Santa Cruz, 514261), Calnexin (Abcam, ab22595).
Detection of Palmitoylation by Acyl-Biotin Exchange Assay
For detection of the protein palmitoylation, the Acyl-Biotin Exchange (ABE) procedure was performed as described (Wan et al., 2007). HeLa S3 PCDH7:GFP expressing cells were used to enrich the PCDH7 protein amount in the samples. Briefly, cell pellets were lysed in ice-cold Lysis buffer (LB; 150 mM NaCl, 50 mM Tris, 5 mM EDTA, pH 7.4 with 10 mM NEM, 2x PI, and 2x PMSF). After homogenization, membrane proteins were enriched by using high-speed centrifugation (Optima MAX-XP Ultracentrifuge, TLA-120.2 rotor) at 200,000g for 30 min at 4ºC. The membrane enriched pellet was dissolved in the LB with 10 mM NEM, 1x PI and 1x PMSF, and 1.7% Triton X-100 and incubated at 4ºC for 2 hours. To remove particulates, the sample was centrifuged at 250g for 5 minutes at 4ºC. Chloroform-methanol (CM) precipitation was applied with the sequential addition of methanol, chloroform, and ddH2O (in 4:1.5:3 ratio) and the sample was vortexed after each addition and centrifuged at 4470g for 35 min at 4ºC. After removal of the top aqueous phase, ice-cold methanol was added, and the sample was centrifuged at 4470g for 35 min at 4ºC to precipitate the proteins. The pellet was air-dried for 2-3 minutes and 4% SDS buffer (4SB; 4% SDS, 50 mM Tris, 5 mM EDTA, pH 7.4) with 10 mM NEM was added into the sample and incubated for 20 minutes at 37ºC to dissolve the protein pellet completely. The LB with 1 mM NEM, 1x PI, 1 mM PMSF, and 0.2% Triton X-100 was added into the sample and incubated overnight at 4ºC. After NEM incubation, three sequential CM precipitations were applied to remove NEM from the sample. After the final CM precipitation, the pellet was dissolved in 4SB by incubating for 10 minutes at 37ºC. The sample was divided into two tubes equally as HA- and HA+ sample and incubated for 1 hour at room temperature with HA- (50 mM Tris, 1 mM HPDP–biotin, 0.2% Triton X-100, 1 mM PMSF, 13 PI, pH7.4) and HA+ (0.7 M hydroxylamine, 1 mM HPDP–biotin, 0.2% Triton X-100, 1 mM PMSF, 1xPI pH 7.4) buffers respectively. Then, CM precipitation was applied, and the protein pellets were dissolved into 4SB and incubated in low HPDP–biotin buffer (150 mM NaCl, 50 mM Tris, 5 mM EDTA, 0.2 mM HPDP–biotin, 0.2% Triton X-100, 1 mM PMSF, 1x PI, pH 7.4) for 1 hour at room temperature. Three sequential CM precipitation was performed to remove unreacted biotin. The protein pellets were dissolved in 4SB and then SDS was diluted to 0.1 % by addition of 0.2% Triton X-100, 1x PI, 1mM PMSF, and samples were incubated at room temperature for 30 minutes. Then, samples were loaded on pre-conditioned Streptavidin Plus UltraLink Resin (Pierce, 53117) and incubated for 90 minutes at room temperature. Unbound fractions (Ub) from both samples were saved, beads were washed with LB containing 0.1%SDS and 0.2% Triton X-100 three times, and bound proteins were eluted in 2x Laemmli with 1% β-mercaptoethanol by boiling for 10 minutes at 95ºC.
Triton X-114 Extraction
Hydrophobic proteins were extracted from the hydrophilic ones using the Triton X-114 (TX-114) extraction protocol as described (Bordier, 1981; Taguchi et al., 2013). Briefly, precondensation of the TX-114 was performed by repeated cycles of clarifying at 4°C and incubation at 37°C to separate the detergent phase. Cells were lysed using 2% TX-114 lysis buffer in PBS and lysate was cleared by centrifugation at 16,100 g for 3 minutes at 4°C. The lysate was then centrifuged at 22,000 g for 10 minutes at room temperature for phase separation. The aqueous phase was removed, the detergent phase was washed with 0.1% TX-114 wash buffer and clarified on ice, and incubated at 37°C for phase separation. Centrifugation and washing steps were repeated 2 more times and detergent and aqueous phases were collected for further analysis.
Surface Labelling and Pulldown of Cell Surface Proteins
Plasma membrane proteins were labeled with sulfo-NHS-SS-biotin for membrane enrichment as previously described (Ozkan Kucuk et al., 2018). Briefly, cells were incubated with 5 mM S-NHS-SS-biotin (Pierce, 21331) for 30 minutes at 4°C with gentle shaking, the reaction was quenched with glycine, and cells were snap-frozen. Cells were lysed in a buffer (10 mM TrisCl pH 7.6, 0.5% SDS, 2% NP40, 150 mM NaCl, 1 mM EDTA, 10 mM Iodoacetamide) supplemented with protease inhibitors (Pierce, 88666) and lysates were incubated with pre-conditioned Streptavidin Plus UltraLink Resin (Pierce, 53117) overnight at 4°C. Unbound samples were collected and beads were washed with lysis buffer three times. Biotinylated surface proteins were eluted by boiling at 70°C for 20 minutes in SDS sample buffer including 100 mM DTT with agitation. All fractions including whole cell lysate (Input-I), unbound (U), and plasma membrane enriched (Elute-E) were analyzed by Western blot.
ZDHHC5 silencing with RNAi
ZDHHC5 expression was knocked down in PCDH7-GFP-BAC cells using shRNA and siRNA approaches. shZDHHC5 was gifted from Dr. G. Ekin Atilla-Gökcümen (Pradhan et al., 2021) and pLKO.1 was gifted from Dr. Elif Nur Fırat Karalar. The lentiviral particles of shZDHHC5 (target sequence 5’CCCAGTTACTAACTACGGAAA3’ in pLKO.1 vector) and empty pLKO.1 (Addgene, 8453) were packaged in HEK293T cells and used to transduce PCDH7-GFP-BAC cells. Virus incorporated stable cells that stably express shRNA’s were obtained after puromycin selection.
As an orthogonal approach, siZDHHC5 based silencing was performed. siGENOME siRNA pools that target ZDHHC5 (siZDHHC5, Dharmacon, D-026577-01-0020, target sequence: GGACUAAGCCUGUAUGUGU) and Non-targeting siRNA (Dharmacon, D-001210-01-05) were transfected with Lipofectamine RNAiMAX Transfection Reagent (Thermoscientific) according to manufacturer’s instructions. Briefly, cells were seeded and transfected with 15pmol of siRNA two times, at 24 hours and 48 hours. After 72 hours after seeding, cells were either pelleted for Western blot analysis or fixed for immunofluorescence analysis.
PCDH7 Knock Out with CRISPR
Single guide RNAs (sgRNAs) that target PCDH7 were designed using online “CRISPR design toll” (http://crispr.mit.edu). The following oligonucleotide sequences were used as top/bottom pairs: sg1 5’-CACCGCGACGTCCGCATCGGCAACG-3’/5’-AAACCGTTGCCGATGCGGACGTCG-3’, sg2 5’-CACCGTTGCCGATGCGGACGTCGGC-3’/5’-AAACGCCGACGTCCGCATCGGCAA-3’, sg5 5’-CACCGCATCGTGACCGGATCGGGTG-3’/5’-AAACCACCCGATCCGGTCACGATG-3’, sg6 5’-CACCGCGGGCTTCTCTTTGGCGCGC-3’/5’-AAACGCGCGCCAAAGAGAAGCCCGC-3’. All sgRNAs were cloned into lentiCRISPR plasmid (Shalem et al., 2014) (pXPR_001, 49535, Addgene) as described in (Ran et al., 2013).
PCDH7 knockout cell lines were generated by lipofectamine transfection of CRISPR plasmid to HeLa S3 cells followed by antibiotic selection. Single colonies were isolated with serial dilution of the pool population and PCDH7 knockout clones were selected after verifying the absence of PCDH7 protein expression with Western blot. CRISPR rescue cell lines were generated by viral transduction of pLenti (Campeau et al., 2009) PCDH7:eGFP plasmid to PCDH7 knockout cells.
AUTHOR CONTRIBUTIONS
N.E.Ö. designed and performed the experiments, analyzed the data, and wrote the manuscript. B.N.Y. and B.S.D performed experiments together with N.E.Ö. M.H.Q. designed and created CRISPR knockout cell lines and PCDH7:GFP constructs. A.Ka. analyzed the BioID data. N.B. performed FRAP experiments together with N.E.Ö and analyzed the FRAP data. A.Ki. designed and analyzed FRAP experiments. N.Ö. designed the research, provided funding and wrote the manuscript.
COMPETING INTERESTS
The authors declare no competing interests.
CONTACT FOR REAGENT AND RESOURCE SHARING
Further information and requests for resources and reagents should be directed to and will be fulfilled by the Lead Contact, Nurhan Özlü (nozlu{at}ku.edu.tr).
All unique/stable reagents and codes generated in this study are available from the Lead Contact without restriction.
LIST OF SUPPLEMENTAL ITEMS
Figure S1. Related to Figure 2.
Figure S2. Related to Figure 3.
Figure S3. Related to Figure 4.
Figure S4. Related to Figure 5.
Figure S5. Related to Figure 6.
Figure S6. Related to Figure 6.
Figure S7. Related to Figure 7.
Video S1. Related to Figure 1. Live imaging video of HeLa S3-PCDH7:GFP cells during cell division. Left panel; bright field. Right panel; GFP.
Video S2. Related to Figure 4. A. Live imaging video of PCDH7-GFP-BAC expressing control cells (DMSO treated).
B. Live imaging video of PCDH7-GFP-BAC expressing cells treated with palmitoylation inhibitor.
Video S3. Related to Figure 6B-D. Live imaging video of CRISPR HeLa S3 cells during cell division; sgNT Control, PCDH7 knockout (PCDH7 KO), PCDH7 rescue (PCDH7 KO+PCDH7:GFP), and mock rescue (PCDK7 KO+eGFP).
Video S4. Related to Figure 6E-G. Live imaging video of shCONTROL (left) and shZDHHC5 (right) cells.
Table S1. Related to Figure 2A.
SUPPLEMENTARY FIGURES

A. The cell cycle-specific localization of PCDH7:BirA*-HA in interphase (top panel) and mitosis (bottom panel) cells, fixed and stained with PCDH7 antibody (red) and fluorescence conjugated streptavidin (green), DAPI in blue.
B. Western blotting analysis shows the biotinylation efficiency of BioID constructs. Controls; non-transfected, backbone vector-transfected (BirA*-HA and mycBirA*). Samples; PCDH7:BirA*-HA, PCDH7Δcyt:BirA*-HA, myrPalm:BirA*-HA (an unrelated construct as negative control). Upper blot; Cells supplied with biotin. Lower blot; Cells not supplied with biotin. In the absence of biotin, only a basal level of biotinylation was observed for all cell lines (bottom panel). In the presence of biotin, while non-transfected cells showed a basal level of biotinylation, nonspecific biotinylation was observed for the empty BioID vector-transfected cells (top left panel). The inputs (I) obtained from PCDH7 BioID, truncated PCDH7 BioID and MyrPalm BioID transfected cells demonstrated different biotinylation patterns as expected. The biotinylated proteins were successfully enriched at the elute fractions (E) of each sample after streptavidin affinity pulldown (top right panel).
C. Western blotting analysis shows the biotinylation specificity of BioID constructs. Upper blot; Cells supplied with biotin. Lower blot; Cells not supplied with biotin. Both PCDH7 and truncated PCDH7 (PCDH7Δcyt) are enriched in the elute fractions (E) after streptavidin pulldown only in the biotin-supplied cells (top panel). No PCDH7 enrichment is observed in the negative control. The full-length PCDH7 was only present in the elute (E) fraction of PCDH7 BioID transfected cells, but not in the truncated PCDH7 BioID transfected cells. PCDH7 was not detected at all in the elute of MyrPalm BioID sample as expected. (top panel). The absence of actin in the elute fractions confirmed the lack of cytosolic contamination (bottom panel).
Scale bars: 10 μm

A. Western blotting analysis of the effect of 2BP on the hydrophobicity of PCDH7. Aqueous (Aqu) and detergent (det) phases are separated using Triton X-114 extraction and blotted against PCDH7, EGFR (a palmitoylated plasma membrane protein), and Actin (a cytoplasmic protein) (left). 2BP treatment increased the ratio of the EGFR, a known palmitoylated protein in the aqueous phase when compared with the DMSO control. A similar effect was also observed for the PCDH7. The quantification of the PCDH7 distribution among aqueous and detergent phases in control (DMSO) and 2BP treated cells (right).

A. PCDH7 (green, anti-GFP) localization in control (DMSO) (top) and palmitoylation inhibitor, 2BP treated (bottom) interphase cells those are stably expressing PCDH7-GFP-BAC. Microtubules (anti-α-Tubulin) are shown in red and DNA (DAPI) in blue (left).
B. Live imaging snapshots of the dividing PCDH7-GFP-BAC expressing cells in the control (top panel) and 2BP treated (bottom panel) cells. Relative timing after mitotic rounding is shown in minutes.
Scale bars: 10 μm

A. Western blotting analysis of siZDHHC5 and siCONTROL cells. siZDHHC5 treatment successfully depleted the ZDHHC5 proteins while PCDH7 levels remain unchanged. Tubulin was used as the loading control.
B. PCDH7 (green, anti-GFP) localization during mitosis in control (siCONTROL) (top) and ZDHHC5 knockdown (KD) (siZDHHC5) (bottom) cells that are stably expressing PCDH7-GFP-BAC. Cells are synchronized to monopolar mitosis. ZDHHC5 is shown in red (anti-ZDHHC5) and DNA in blue (DAPI) (left). Quantification of the plasma membrane enrichment of PCDH7 during mitosis in the control (n=39) and ZDHHC5 KD (n=83) cells (right). Statistics used unpaired two-tailed t-test. Scale bars: 10 μm; ***: p<0.001

A. PCDH7 levels in the HeLa S3 PCDH7 CRISPR cells. Western blotting analysis shows the PCDH7 levels in the different single colonies for PCDH7 CRISPR, non-treated HeLa S3 cells, and non-targeting sgRNA (sgNT) treated cells. Actin was used as the loading control. B. PCDH7 levels in CRISPR colonies and rescue cell lines. Western blotting analysis shows the PCDH7 levels of the PCDH7-CRISPR single colonies before (left) and after (right) viral transduction of PCDH7:eGFP or empty backbone vector (eGFP). The upper band corresponds to fusion protein (PCDH7:eGFP, 116+27) while the lower band corresponds to PCDH7 (116). Actin was used as the loading control.
C. Representative live imaging snapshots of PCDH7 knockout HeLa S3 cells expressing backbone rescue vector (eGFP). Bright-field (top panel) and GFP (bottom panel). Dashed lines indicate cell margins. Relative timing is shown in minutes. D. Representative live imaging snapshots of PCDH7 knockout HeLa S3 cells expressing rescue vector (PCDH7:eGFP). Bright-field (top panel) and GFP (bottom panel). Dashed lines indicate cell margins. Relative timing is shown in minutes.

A. Representative fluorescence images for multinucleation in control cells (top) and PCDH7 knockout cells (bottom). Cells were stained with anti-β-tubulin antibody (red) and DAPI for DNA (blue). Multinucleated cells are shown with white arrows.
B. Representative fluorescence images of shCONTROL (top) and shZDHHC5 (bottom) treated PCDH7-GFP-BAC cells. Cells were stained with anti-α-tubulin antibody (red) and DAPI for DNA (blue). White arrows indicate the multinucleated cells.
C. Subphenotypes of the cell division failures in control (n=69) and PCDH7 KO (n=58) cells. Scale bars: 10 μm

Representative fluorescence images displaying MYPT1 (green), actin filaments (red, Phalloidin), and DNA (blue, DAPI) localization through cytokinesis in control (top panel) and PCDH7 knockout (middle panel) cells. Rescue cells that express PCDH7:GFP are represented in the bottom panel; MYPT1(red), DNA (blue, DAPI). Maximum intensity projections of Z stacks are shown (left).
Intensity profiles of MYPT1 at the cleavage furrow during cytokinesis in the control (gray trace) (n=24), PCDH7 KO (red trace) (n=24) and rescue (PCDH7KO + PCDH7:GFP) (blue trace) (n=41) cells (right). Intensity profiles were obtained in ImageJ software for the indicated region of interest as previously described (Uretmen Kagiali et al., 2020).
Scale bars: 10 μm
Supplementary Videos
Video S1. Live imaging of HeLa S3-PCDH7:GFP cells during cell division. Left panel; bright field. Right panel; GFP.
Video S2. A. Live imaging of PCDH7-GFP-BAC expressing control cells (DMSO treated). B. Live imaging of PCDH7-GFP-BAC expressing cells treated with palmitoylation inhibitor.
Video S3. Live imaging of CRISPR HeLa S3 cells during cell division; sgNT Control, PCDH7 knockout (PCDH7 KO), PCDH7 rescue (PCDH7 KO +PCDH7:eGFP) and mock rescue (PCDK7 KO +eGFP).
Video S4. Live imaging of shZDHHC5 and shCONTROL cells.
ACKNOWLEDGMENTS
This study is funded by TUBITAK 1001 (116Z305) to N.Ö. We gratefully acknowledge Büşra Aytül Akarlar and the Proteomics Facility of Koç University for the technical assistance in mass spectrometry analyses. We thank Dr. Bilal Ersan Kerman and Medipol University Regenerative and Restorative Medicine Research Centre for the permission to use their imaging facility and for the critical discussions throughout the project. İlayda Aydınlı and Tuba Oğuz for their assistance during live imaging experiments. We also thank Dr. Alexandr Jonas for the critical discussions and interpretations of FRAP data. We thank Dr. Timothy Mitchison for the anti-biotin antibody and the critical reading of the manuscript. We thank Dr. G. Ekin Atilla-Gökcümen for sharing ZDHHC5 shRNAs, Dr. Elif Nur Fırat Karalar for sharing pLKO.1 plasmid and anti-GFP antibody, and Dr. Tamer Önder for sharing HEK293T cells. We also thank Dr. Nazan Saner and Dr. Aydanur Şentürk for the critical reading of the manuscript. We gratefully acknowledge the permission to use the facilities of the Cellular and Molecular Imaging Core of Koç University Research Center for Translational Medicine funded by the Republic of Turkey Ministry of Development.
REFERENCES


