

Abstract
Genetic variation segregates as linked sets of variants, or haplotypes. Haplotypes and linkage are central to genetics and underpin virtually all genetic and selection analysis. And yet, genomic data often lack haplotype information, due to constraints in sequencing technologies. Here we present “haplotagging”, a simple, low-cost linked-read sequencing technique that allows sequencing of hundreds of individuals while retaining linkage information. We apply haplotagging to construct megabase-size haplotypes for over 600 individual butterflies (Heliconius erato and H. melpomene), which form overlapping hybrid zones across an elevational gradient in Ecuador. Haplotagging identifies loci controlling distinctive high- and lowland wing colour patterns. Divergent haplotypes are found at the same major loci in both species, while chromosome rearrangements show no parallelism. Remarkably, in both species the geographic clines for the major wing pattern loci are displaced by 18 km, leading to the rise of a novel hybrid morph in the centre of the hybrid zone. We propose that shared warning signalling (Müllerian mimicry) may couple the cline shifts seen in both species, and facilitate the parallel co-emergence of a novel hybrid morph in both co-mimetic species. Our results show the power of efficient haplotyping methods when combined with large-scale sequencing data from natural populations.
One-sentence summary Haplotagging, a novel linked-read sequencing technique that enables whole genome haplotyping in large populations, reveals the formation of a novel hybrid race in parallel hybrid zones of two co-mimicking Heliconius butterfly species through strikingly parallel divergences in their genomes.
Main text
Introduction
Understanding how changes in DNA sequence affect traits and shape the evolution of populations and species has been a defining goal in genetics and evolution 1–3. DNA is naturally organized in the genome as long molecules consisting of linked chromosome segments. Linkage is a core concept in genetics: in genetic mapping, geneticists map causal variants not by tracking the actual mutation, but through many otherwise neutral and unremarkable linked variants. Likewise, the detection of selection relies on observing hitchhiking of linked variants, rather than seeing the mutation itself. This recognition makes it all the more paradoxical that haplotype information is routinely omitted from most genomic studies, as a technical compromise. Lacking haplotype information not only complicates analysis, but also precludes accurate ancestry reconstruction, detection of allele-specific expression 4 and chromosome rearrangements, and reduces power to detect selective sweeps, even entirely missing them when multiple haplotypes sweep together 5. Instead of sequencing genomes as haplotypes, short-read sequencing produces 150 bp reads. Until affordable long-read platforms become sufficiently reliable, this lack of haplotype context will continue to impact mapping and genomic studies, particularly those in non-model organisms.
One way to simplify haplotype reconstruction and inference from sequencing data is to avoid discarding haplotype information in the first place. A promising emerging technique is thus linked-read (LR) sequencing 6–9, which preserves long-range information via molecular barcoding of long DNA molecules before sequencing. Individual short reads can then be linked via a shared barcode to reconstruct the original haplotype. However, existing options all suffer from high cost, poor scalability and/or require custom sequencing primers or settings that have thus far prevented them from being applied as the default (Supplementary Tables 1 – 2). If linked-read sequencing can become scalable and affordable, it would significantly advance genetics by enabling, for the first time, the “haplotyping” of entire populations, i.e., the sequencing and systematic discovery of genomic variants as haplotypes in hundreds or even thousands of samples in model and non-model organisms alike.
Here we describe a novel solution called “haplotagging”, a simple and rapid protocol for linked-read (LR) sequencing. Importantly, haplotagging maintains full compatibility with standard Illumina sequencing and can easily scale to large populations with no extra costs. We demonstrate this in three steps. First, we show that direct haplotyping using haplotagging is robust in single human and mouse samples with known haplotypes (“phases”). Next, we show the feasibility of population haplotyping in 245 mice, even with very low-coverage LR sequencing. Finally, we apply haplotagging to investigate the emergence of a novel hybrid morph in a hybrid zone system in Ecuador featuring 670 individuals of two species of Heliconius butterflies.
Direct haplotype tagging
Haplotagging is a bead-based protocol for the production of linked-read DNA sequencing libraries. Haplotagging works by molecular barcoding of long, kilobase-spanning DNA molecules to generate short fragments for sequencing. In solution, DNA molecules tend to wrap around a single bead, a property that can be exploited for constructing linked-read libraries 8,9. Each haplotagging bead is tethered with Tn5 transposase carrying one of 85 million molecular barcodes directly integrated into an otherwise standard Nextera Tn5 transposon adaptor (Fig. 1a; Extended Data fig. 1; Supplementary Table 3). In a single transposition reaction, microbead-tethered Tn5 transposase transfers the barcoded sequencing adaptors into the long DNA molecule. A tube of beads carrying millions of unique molecular barcodes can be used to tag a pool of DNA molecules, each carrying its bead-specific barcode. Following sequencing, unique long-range haplotypes can be reconstructed from each DNA molecule (Fig. 1a).

a, The design of a haplotagging bead. Haplotagging beads are microbeads coated with activated Tn5 transposomes that correspond to the Nextera specifications. The key feature is a set of segmental barcodes (“beadTag”) that is integrated into the i7 and i5 indexing positions. In the current design, we use two segments each (designated A – C and B – D), linked by a single basepair overhang (X and Y). These oligonucleotides are attached to the bead via the strong streptavidin–biotin binding. An advantage of this design over other similar designs 8 is that there is no intervening adaptor sequences (which requires custom sequencing primers), nor is there major presence of splint hybridizing sequences (which would greatly extend the length of the indexing sequence), either of which would prevent the standard TruSeq sequencing protocol to be used on an Illumina sequencer. b, Assembly of the combinatorial beadTag barcode via a split-and-pool procedure. Pre-suspended 96-well plates bearing oligonucleotides are ordered directly from suppliers. Commercial streptavidin-coated dynabeads are aliquoted into each well, pooled, and then re-aliquoted into each well into the next plate. At each step, an individual microbead would be mixed with a single type of barcodes, but as a pool of beads, the entire mixture would feature up to approximately 85 million combinations. If the X and Y overhangs are varied, this can feature up to 1.4 billion combinations.

a, Principles of haplotagging. Microbeads coated with barcoded transposon adaptors enable simultaneous molecular barcoding and Tn5-mediated fragmentation of long DNA molecules into sequencing-ready libraries after PCR amplification, all in a single tube. This technique takes advantage of the tendency of DNA to interact only with a single bead in solution (inset). A key feature of haplotagging is that each bead is uniformly coated with a single segmental barcode combination (“beadTag”) made up of 4 segments of 96 barcodes each (designated “B”, “D”, olive; and “C”, “A”, green, at the standard i5/7 index positions of the Illumina Nextera design). Across beads, the four segments represent up to 964, or 85 million beadTags. Thus, DNA wrapped around a single bead can be reconstructed from individual short reads that share the same beadTag. b, Haplotagging in an F1 hybrid mouse between the reference strain C57BL/6 (BL6) and CAST/EiJ (CAST), with detailed view at Chr1: 52-52.5 megabase (Mbp). Each molecule is represented by a grey bar connecting short-reads (coloured bars for CAST, red; or BL6, blue) sharing a single beadTag, e.g., A30C94B16D20 tags a 116 kilobase molecule carrying a CAST allele. All but one molecule in this window match perfectly to CAST or BL6 alleles. Genome-wide, 99.97% of all reconstructed molecules correspond to CAST or BL6 haplotypes (2 million correct vs. 538 incorrect molecules). c, Vast expansion in molecular vs. read coverage for whole population haplotyping. Linked-read (LR) molecules typically span tens of kilobases, compared to ~500 bp of short reads. The increased overlap among molecules often lead to >10-fold increase in molecular coverage (Supplementary Table 4). In a large population, LR data allow both accurate haplotype reconstruction using pooled read depths and accurate imputation by leveraging linkage information, even with input read coverage reduced to 0.07x (Extended Data fig. 2b). Bead and Tn5 image modified with permission from Zinkia Entertainment, S.A./Pocoyo.

a. Barcode diversity, molecule size and phased block sizes from the same F1(BL6xCAST) sample. On average, each barcode is found on only 2 to 3 molecules scattered across the genome. Half of the genome is covered by molecules 42.1 kbp or longer. Phasing was successful across virtually the entire genome. Shown here are the largest phase blocks (dark grey boxes; up to 90% of the total length of all phase blocks, or N90) on the 19 autosomes of the mouse. Scale bar: 50 megabase. b, LR sequencing, phasing and imputation results from haplotagging 245 mice from the Longshanks selection experiment 12,13. LR sequencing allows molecular coverage (median: 2.23x)—as opposed to standard per-base read coverage (median: 0.24x)—to be leveraged across samples to infer and extend haplotype segments. Phasing and imputation while incorporating LR information consistently shows higher correlation with allele frequencies estimated from higher-depth sequencing 13 than standard short-read only attempts, even after subsampling to as low as 0.05x coverage per individual mouse. LR data also lead to a 100× increase in phased block lengths. Bottom: representative results from statistical phasing with down-sampled input, with or without LR information. Haplotypes can be visualized by runs of correlated allele frequencies. In this 2 Mbp region, phasing with or without LR information at 0.24x coverage show comparable results. By contrast, at 0.1x coverage, phasing remain robust using LR information (left; the sharper appearances of correlated frequencies suggest possibly improved phasing results) compared to poor phasing results if the input was treated as standard, paired-end reads (right).
Haplotagging features three main design improvements over other linked-read (LR) alternatives (Supplementary Table 1). Firstly, it avoids specialized instrumentation (c.f., microfluidics chips and controller for 10X Genomics’ discontinued Chromium platform). Haplotagging is, in essence, a one-step, 10-minute transposition reaction, followed by PCR. It requires only a magnet and standard molecular biology equipment available in most laboratories. A haplotagging library, in our hands, costs less than 1% of a 10X Genomics Chromium library, and despite featuring long-range haplotype information, costs about 1/20th as much as a Nextera DNAFlex short-read library (Supplementary Table 2). Secondly, we designed the segmental beadTag barcode and the protocol with scalability and high-order multiplexing in mind. A single person can thus prepare and sequence hundreds of uniquely barcoded libraries within weeks. Last but not least, one of the major design challenges we have solved in haplotagging is encoding 85 million barcodes and maintaining full compatibility with standard Illumina TruSeq sequencing that is available at most sequencing facilities, even when pooled with other library types (Fig. 1a).
To test the recovery of molecular haplotypes, we performed haplotagging on high molecular weight DNA from an F1 hybrid mouse between two inbred lab strains with known sequence differences, CAST/EiJ (CAST) and C57BL/6N (BL6 is the genome reference strain). We could assign 94.3% of 201 million read-pairs to a beadTag and inferred molecules based on beadTag sharing (Fig. 1b). Across the genome, we found that 99.97% of phase-informative molecules accurately capture the parental haplotypes with exclusively BL6 (reference, maternal) or CAST (alternate, paternal) alleles at multiple SNPs (Fig. 1b), with even representation of both alleles (50.6% and 49.4%, respectively; about 1.0 million molecules each on autosomes). Many of these molecules span many kilobases (kbp), up to as much as 415 kbp (N50 = 42.1 kbp; Supplementary Table 4). These results provide strong evidence that haplotagging can accurately capture and reconstruct haplotypes.
Using these data, we phased nearly all heterozygous SNPs (99.74%) using HAPCUT2 10 into large, megabase-spanning phased haplotype blocks (N50 = 15.5 Mbp; Extended Data fig. 2a; maximum: 61.46 Mbp; Supplementary Table 4; see Supplementary Notes for phasing performances in additional human and mouse samples, including comparison against other LR platforms).
Whole population haplotyping
We next tackled haplotype phasing using LR data in large populations. Unlike phasing in single individuals, population phasing can be challenging, because neither the number of haplotypes nor their frequencies are known in advance. To our knowledge this is the first study to apply population phasing using LR data, presumably because such large datasets have not been feasible before.
Our strategy involves leveraging naturally occurring haplotype blocks in populations and trading off linkage against coverage: first we reconstruct the set of haplotypes present in the study population, exploiting the fact that most segregating haplotypes are common such that we can pool reads from many individuals for maximum coverage. Then, we impute across the entire genome in every sample, using linkage from the expanded “molecular coverage” to boost accuracy. For example, there was a ten-fold increase from 12.6× read- to 165.6× molecular coverage in the F1 hybrid mouse, (i.e., each parental haplotype was sampled more than 80 times; Fig. 1c; Extended Data fig. 2b; Supplementary Table 4). This strategy dovetails neatly with STITCH, an algorithm for (short) read-based statistical phasing 11, which we have adopted to incorporate LR information. The implication of this principle of tandem molecular and statistical phasing is profound: with LR data, we can sequence populations at a fraction of current coverage (and costs), yet still obtain accurate haplotypes for the entire population.
To test this concept, we performed haplotagging on 245 “Longshanks” mice from a 20-generation selective breeding experiment for long tibia length 12,13. We sequenced these mice to an average depth of 0.24×, identified molecules (giving 2.23× molecular coverage), and phased the data using STITCH. We tested the accuracy of genotype imputation by comparing against higher-coverage conventional short-read data for 32 of these mice (2.9× coverage)13. Our results show that genotype imputation using data from haplotagging is remarkably robust (>96% accurate) and remains so even when read coverage is reduced to 0.07× (vs. 0.15× without using LR information; Extended Data fig. 2b; see Supplementary Methods for details). Compared to short read sequencing without linked-read data, there was a 100-fold expansion in the ability to assign SNPs into linked sets of phased blocks, with an average of 24.1 kbp using LR data (vs. 283 bp otherwise). We achieved these robust results despite having sequenced only about one-tenth as deeply (cf. typically 20–40x under classical phasing 14, or 2–5x when imputing using an external reference haplotype panel 11,15. Importantly, we are no longer dependent on a reference haplotype panel, which does not exist for most study populations. By multiplexing haplotagging libraries of hundreds of samples, users can now perform (ultra)low-coverage Illumina seqencing, achieve 10- to 100-fold deeper LR molecular coverage and thus accurately reconstruct haplotypes for each individual.
Parallel Heliconius hybrid zones
We next applied haplotagging to address key evolutionary questions in two Heliconius butterfly species in Ecuador. Local collectors have previously noticed the abundance of a morph of putative hybrid origin in Eastern Ecuador. Here, we investigate the patterns of phenotypic and genetic variation across the hybrid zone where this novel morph is found and test the hypothesis that the morph has arisen and spread in parallel in two species that mimic each other.
Heliconius butterflies have diversified into many species and subspecies (or “races”) across South and Central America and represent a classic example of adaptive radiation 16. They are toxic and advertise their unpalatability with bright warning colouration. Predators (mainly birds) learn to avoid the warning signal 17,18 and selection favours the locally common pattern 19. Heliconius species often converge on the same colour patterns to reinforce the advertising effect, a phenomenon known as Müllerian mimicry (Fig. 2a; 17). The striking variety notwithstanding, the genetics of these colour patterns is remarkably simple, involving only a few loci of large effect 16,20–25.

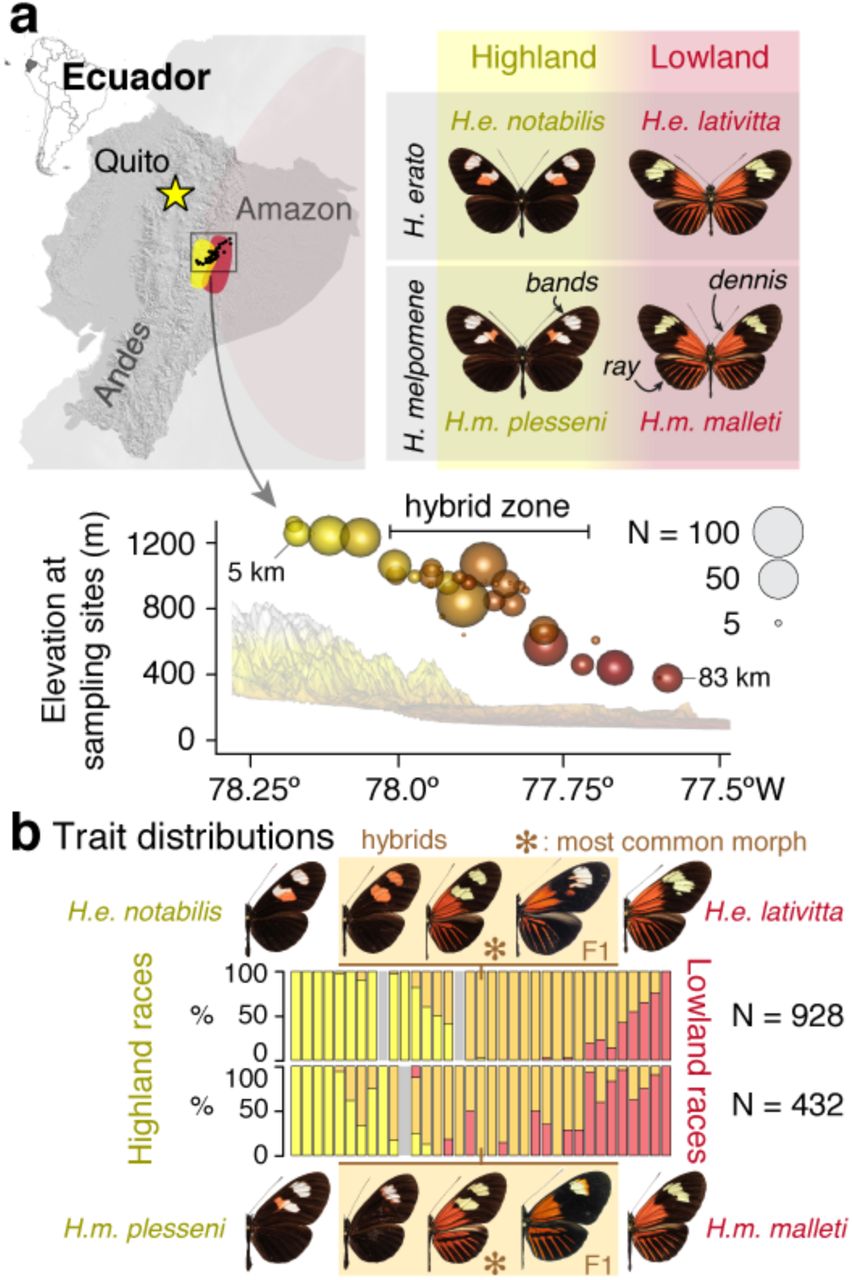
a, In eastern Ecuador, butterflies of the species H. erato and H. melpomene occur in the transition zone between the Andes (up to 1307 m elevation, “Highland”) and the Amazon basin (376 m, “Lowland”) as distinctive races with major wing colour pattern differences (labelled as “bands”, “dennis” and “ray”). Heliconius butterflies are unpalatable and share warning wing patterns (Müllerian co-mimicry) 17. We sampled a total of 1,360 butterflies of both species along an 83 km transect consisting of 35 sampling sites across the double hybrid zones (km 19 – 59; symbols scaled to sample size and colours indicate elevation) and 12 additional off-transect sites (Supplementary Table 5). b, Proportions of butterflies displaying the highland double-band phenotype (H. erato notabilis and H. melpomene plesseni: yellow) and lowland dennis-ray patterns (H. erato lativitta and H. melpomene malleti: red) as well as hybrid patterns (F1 and beyond: orange; ✻, most common morph; Extended Data fig. 3b; grey: sites with no specimen in one species) at sampling sites along the transect.

a, Sampling localities shown in Fig. 2a are shown at higher magnifications here. The colour coding corresponds to the same scale as in Fig. 2a. The transect is located along a Southwest–Northeast diagonal. b, Representative individuals of the pure races, F1 and the new hybrid morph in H. erato and H. melpomene. c-f Representative individuals visualising how different genotypes at WntA (c, d) in both species and at Ro in H. erato affect the forewing band shape (c-d), and how genotypes at optix in both species and cortex in H. melpomene affect the distribution of red scales (e-f).
Here we focus on two distantly related Heliconius species, H. erato and H. melpomene (diverged 12 million years ago) 26, which feature many distinct colour patterns and mimic each other (and other species) whenever they overlap 16. In the Pastaza valley of eastern Ecuador, a highland race of each species meets and forms a hybrid zone with a distinct lowland race (Fig. 2a; Extended Data fig. 3a; 27,28). The hybrid zones range from around 1,300 m to 400 m from the Andean mountains into the Amazon basin (highland race: H. erato notabilis and H. melpomene plesseni; and lowland race H. erato lativitta and H. melpomene malleti; Fig. 2). To survey the hybrid zone, we collected 975 H. erato and 394 H. melpomene butterflies (928 and 343 at 35 transect sites; Fig. 2; Extended Data fig. 3a; Supplementary Tables 6 – 7) and scored their colour traits as informed by controlled laboratory crosses (Extended Data fig. 3c – f) 27. Figure 2b shows that hybrid butterflies (both F1 and beyond) are observed in all but five highland and one lowland sites, with the core transition zone between 1,000–900 m of elevation (km 36 – 45 along the transect).
Divergence, selection and trait mapping
Using haplotagging, we sequenced 484 H. erato and 187 H. melpomene butterflies from the transect in 96-plex batches to a median read coverage of 1.29× for H. erato; and 2.72× for H. melpomene (samples both individually and molecularly barcoded; see Material and Methods; Supplementary Tables 3, 5 – 8). Following phasing and imputation, we retained a set of 49.2 M single nucleotide polymorphisms (SNPs) in H. erato and 26.3 M SNPs in H. melpomene, most of which were polymorphic throughout the zone (H. erato: 69.4%; H. melpomene: 81.1%), consistent with high gene flow. By contrast, only 232 SNPs were completely fixed for opposite alleles between H. e. notabilis and H. e. lativitta; and none between H. m. plesseni and H. m. malleti. Sequence diversity was high (131 and 97 SNPs / kbp in H. erato and H. melpomene, respectively), which helped to produce long average phased block sizes of 3.6 and 3.3 Mbp in H. erato and H. melpomene respectively (maximum: 20.7 Mbp, effectively spanning a whole chromosome; Extended Data fig. 4). This dataset represents a qualitative jump in quality and resolution over the state-of-the-art in a natural population study.

Following statistical phasing, each individual was also phased using molecular information across its imputed heterozygous sites using HAPCUT2. The phased block N50 is shown for H. erato (top) and H. melpomene (bottom). Among H. erato, the maximum phased block N50 is 20.7 Mbp, which spans the entire Herato1202 scaffold, the third longest scaffold in that assembly.
Across the genome, there was little background genomic differentiation between highland and lowland races in both H. erato and H. melpomene (mean genetic distance FST in H. erato: 0.0261 and in H. melpomene: 0.0189; Fig. 3). This is consistent with free introgression of neutral and globally adaptive variants in hybrid zones 29,30.

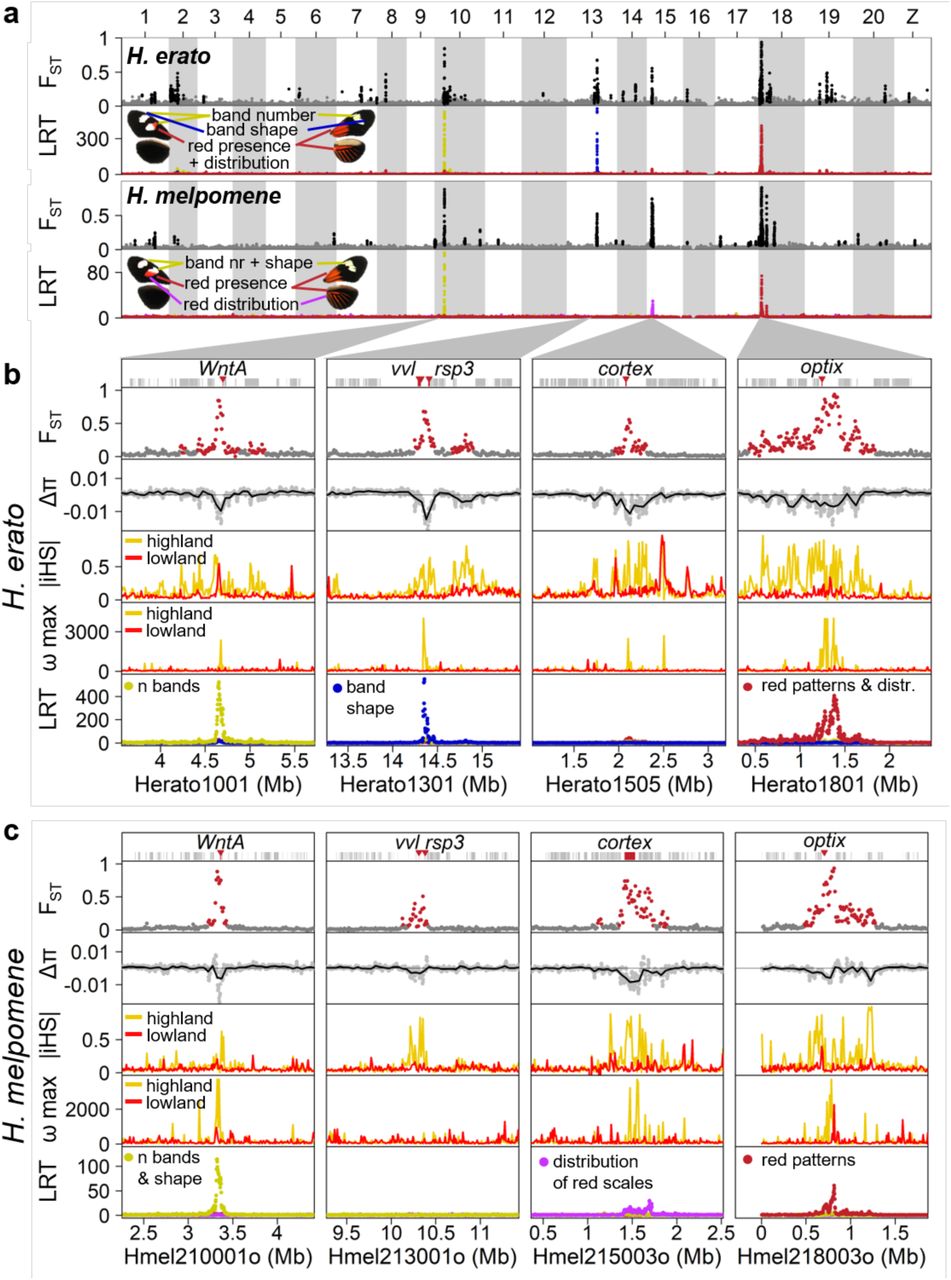
a, Major peaks of differentiation are shared across H. erato and H. melpomene (as indicated by FST; H. melpomene data is plotted at its homologous H. erato coordinates). FST values of windows assigned to the high differentiation state by the HMM analysis, are shown in black, others in grey. The three most strongly differentiated regions in each pair of subspecies all show strong association with colour pattern differences (LRT: likelihood ratio test). b and c, Detailed view at the four loci with strongest differentiation in H. erato (b) and H. melpomene (c). At all four major loci, the races also differ in nucleotide diversity (π; Δπ=πhighland – πlowland), whereby the highland races (H. e. notabilis and H. m. plesseni) consistently show greater reduction in diversity than the lowland races (H. e. lativitta and H. m. malleti), indicative of strongest selection in the highland races in both species. Compared to the Δπ values of all genomic 50 kb windows, the four major loci are among the most negative 1% in both species (Extended Data fig. 5). Stronger selection among highland races than lowland races is also supported by haplotype-based selection statistics such as absolute normalized iHS (integrated haplotype score) and the ω-statistic. Three of the four major loci in each species are associated with major colour patterns and all fall into the vicinity of the genes WntA (forewing band number), Ro (likely vvl and/or rsp3 24), cortex (distribution of red scales) and optix (presence of red either as forewing patch and hindwing bar and rays (dennis-ray) or in forewing band) in H. erato (b) and in H. melpomene (c). (for details see Extended Data fig. 9 and Supplementary Data 4 & 5).

In both Heliconius species, the difference in nucleotide diversity between highland and lowland races (Δπ) was computed in 50 kb windows. The density distribution of Δπ value across the genome is shown in black, with the most extreme 50 kb window at each colour pattern locus indicated as vertical coloured lines. Colour pattern loci show strongly negative Δπ values, indicating stronger reduction in nucleotide diversity in highland races than in lowland races. Empirical one-sided P-values are given for each colour pattern locus.
Against this backdrop, peaks in genomic differentiation stand out in stark contrast in each species. Using a Hidden Markov Model (HMM), we identified 24 and 52 regions of high differentiation in H. melpomene and H. erato, respectively (Fig 3; Supplementary Methods). The strongest divergence peaks are found at four major colour loci, namely WntA (Chromosome 10) 22, Ro (Chr13), cortex (Chr15) 31,32 and optix (Chr18) 16,21,33(Fig. 3b–c). The improved resolution from haplotagging reveals novel loci and greater parallelism than previously described 28, with FST peaks at cortex in H. erato and vvl in H. melpomene (the putative homologue of Ro in H. erato) being the most surprising, because they have not previously been hypothesized to play a role in phenotypic divergence in these races (see Extended Data fig. 6 for a direct comparison; 28). The windows with the highest FST values are all located in these four major colour loci and are highly correlated between the two species highlighting the fine-scale parallelism at these loci (Extended Data fig. 7).

Patterns of genomic differentiation (FST) across the genome show much higher resolution in haplotagging data (a) than in RAD data (b) despite the same number of individuals (10 individuals from each population) and comparable number of mapped reads (haplotagging: 127 million vs. RAD: 130 million). FST values were calculated in sliding windows of 10 kbp with a step size of 2.5 kbp. Windows with less than 10 SNPs were excluded. There are many more regions with marked differentiation using haplotagging data. Most of these regions are validated in the broader, main dataset presented in Fig. 3a. b, The difference in resolution is particularly obvious at the four regions of highest differentiation. c, Comparison the haplotpe-based ω-stastics 34, which detects LD signatures associated with genetic hitchhiking with or without LR information. The same data from 32 H. e. notabilis individuals were processed using either the STITCH/HAPCUT2 LR pipeline outlined in this paper, or a standard Beagle/SHAPEIT pipeline without using LR information. The ω test searches for increased LD within each flanking area adjacent to the inferred target of selection, but not across it. It is sensitive to accurately constructed haplotypes. The LR pipeline shows a peak ωMAX of 4014.5 in the region, especially in the area immediately flanking the strongest association with the wing pattern phenotypes (red arrowhead and black vertical bar) that is more than 100 kbp 3’ to the coding region of optix (red vertical bar). The major signals correspond to regulatory regions (blue shading: ray and dennis according to 54) and even overlap particular regulatory elements in this region (grey ticks above plot, labelled according to 25). By contrast, the maximum ω-statistics at this locus without using LR information is 29.3 (inset, magnified 20×) and seem to fluctuate.
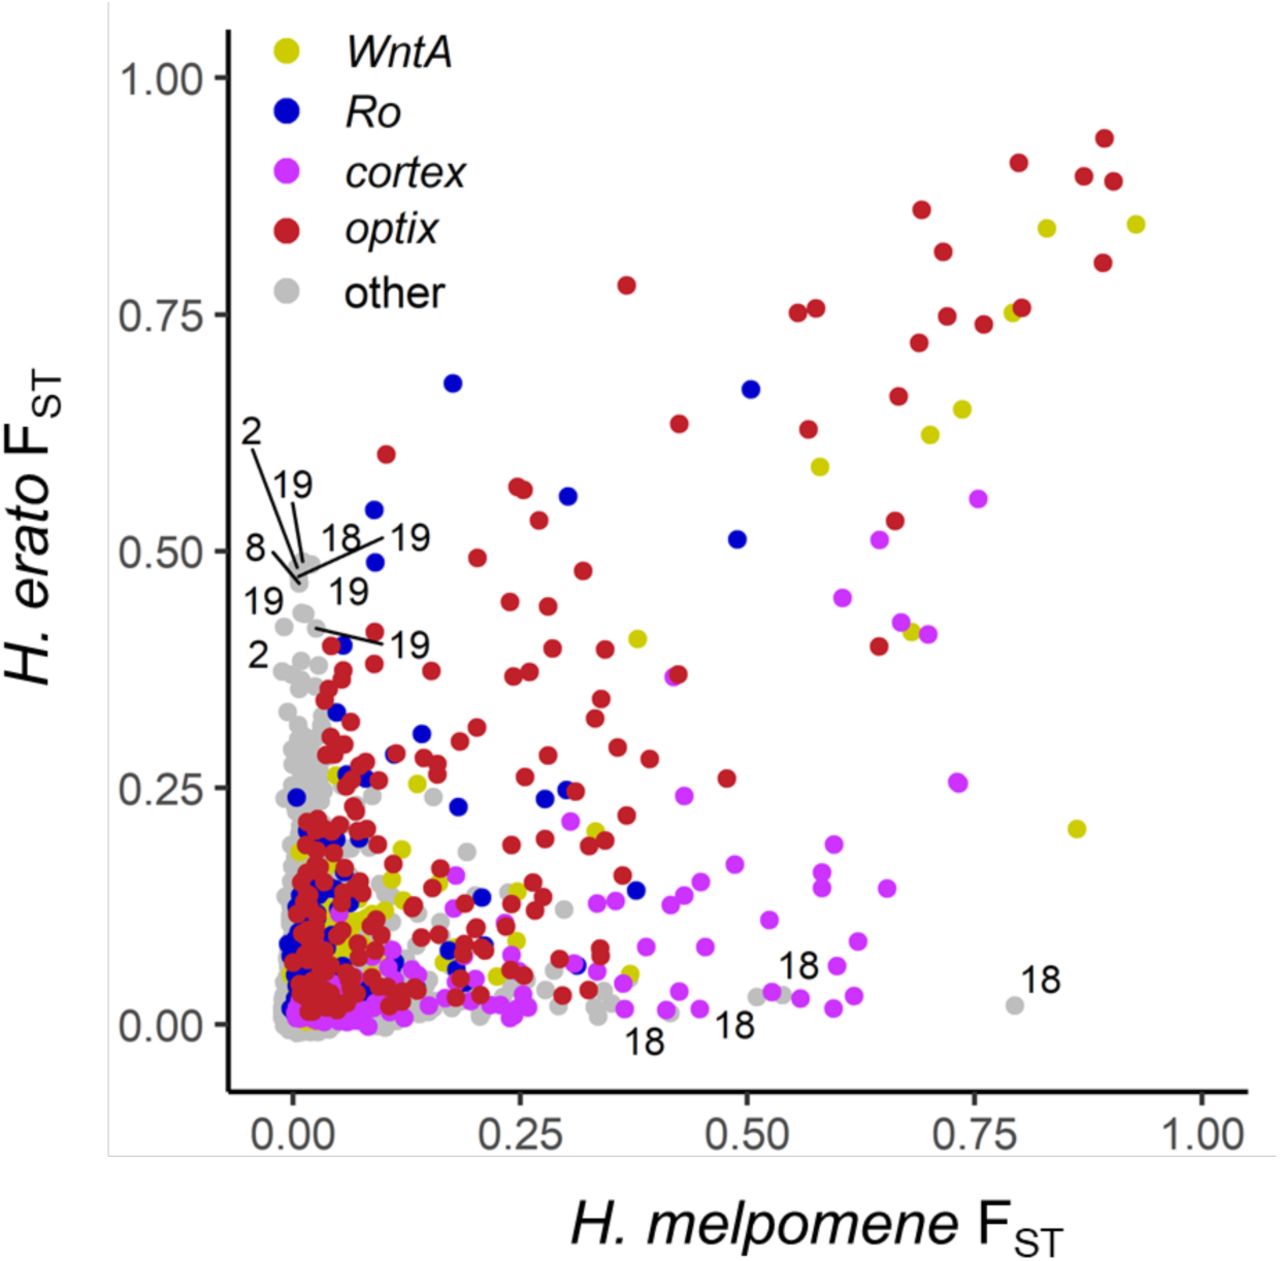
FST computed in 10kb windows between highland and lowland races for each species separately, (H. melpomene data were converted to H. erato coordinates before averaging). All windows within 0.5 Mbp from the centre of the four major colour loci in H. erato are shown in colour. For windows with an FST value above 0.4 that are not part of the major colour loci the chromosome number is indicated. The four windows that are highly differentiated only in H. melpomene are all located on chromosome 18 and are part of a second divergence peak about 2 Mbp away from optix unique to this species. This region also shows a steep cline in allele frequency which is coincident with the optix cline. Windows that are highly differentiated only in H. erato include a region on Chr2 which also shows steep clines shifted towards lower altitudes even compared to the WntA cline (Extended Data fig. 12). This region encompasses six genes of which four are putatively related to diet (fatty acid synthase, trypsin, gustatory receptor for sugar taste, odorant-binding protein).
All four loci show reduced nucleotide diversity and elevated linkage disequilibrium (LD), characteristic signatures of selective sweeps (captured by the π, ω, and iHS statistics; Supplementary Tables 9 – 10, Supplementary Data 4 & 5 34,35). Here, the LR data allows us to track the breakdown of haplotypes across the hybrid zone (Extended Data fig. 8) and greatly increase the power of the haplotype-based ω-statistic (especially compared to haplotypes reconstructed from short-read only data, Extended Data Fig. 6c). The resolution in these tests is high enough to separate the Dennis and Ray cis-regulatory regions from the target gene optix in H. erato (Extended Data fig. 6c). The data can reveal unsuspected molecular details, as evidenced by the detection of rare H. melpomene recombinants at the tightly linked Band, Dennis and Ray elements at optix (Extended Data fig. 9). Together, our data underscore the precision and power of population haplotyping.

Haplotypes from inferred selection targets are plotted in sample groups (Top: H. erato; bottom: H. melpomene). In each sample group, haplotypes are assigned to into highland (yellow), lowland (red), or ambiguous types (not plotted here), and plotted from the longest to the shortest length, calculated from the closest recombination breakpoints flanking the centre, focal position (see Methods for details). Summarized below each plot is a box plot depicting the median and the interquartile range of the haplotypes in each group (with a minimum of 3 haplotypes). To help visualize the breakdown of the average haplotype in the middle of the hybrid zone, some bars may be truncated at the top. This representation clearly shows the displacement between the optix and WntA clines. It also shows that haplotype lengths tend to be long at both ends of the hybrid zone, and become broken down through hybridization at the centre of each cline. Within a sample group, comparing the size distribution of haplotypes of each type may also reveal the direction of introgression. Note that the H. melpomene WntA locus contains far shorter haplotypes than those at the other depicted loci, and is plotted with an different Y-axis.

Genotypes at optix across all individuals shown as yellow for homozygotes for the highland (H. m. plesseni) allele, orange for heterozygotes and red for the lowland (H. m. malleti) allele. For clarity, only sites with at least 0.9 homozygote frequency difference between highland and lowland individuals are shown. The previously identified regulatory regions and the phenotype association scores (log likelihood test) are shown on top. Individuals are grouped by presence and absence of different red elements in the wings (dennis, ray, and red in the forewing bands, see Fig. 2 and Extended Data Fig. 3c – f). The two top groups represent individuals that are recombinants between different optix regulatory regions. The top group are individuals lacking red scales in the forewing band typical for the lowland race. They all carry lowland homozygous genotypes at dennis. These indviiuals are heterozygous at one or more other regulatory regions. The second group from the top are individuals that show a dennis patch in the forewing but no rays in the hindwings. These individuals are homozygous for the highland allele at ray (yellow), but become heterozygous at dennis. Accordingly, they display the lowland dennis patch. These individuals show an exact concordance with the regulatory elements reported in 54,84. In this hybrid zone the dennis element is the only region that is fully concordant with the presence of red scales in the forewing band, unlike other H. melpomene races, suggesting potentially a distinct different regulatory mechanisms.
Chromosome inversions and other structural rearrangements
In local adaptation and speciation, chromosome rearrangements, and inversions in particular, are thought to play a major role in holding together adaptive variants 36–39. However, they are hard to detect using short-read techniques. By contrast, longer LR molecules that span rearranged junctions can systematically reveal insertions, deletions, inversions and additional chromosome rearrangements. We therefore analysed beadTag sharing across adjacent 10 kbp windows to detect differences between the physical molecules and the reference assembly (Fig. 4; see Methods for details). We detected 685 and 415 indels; and 14 and 19 major inversion/translocation events in H. erato and H. melpomene, respectively (Supplementary Data 2 & 3).
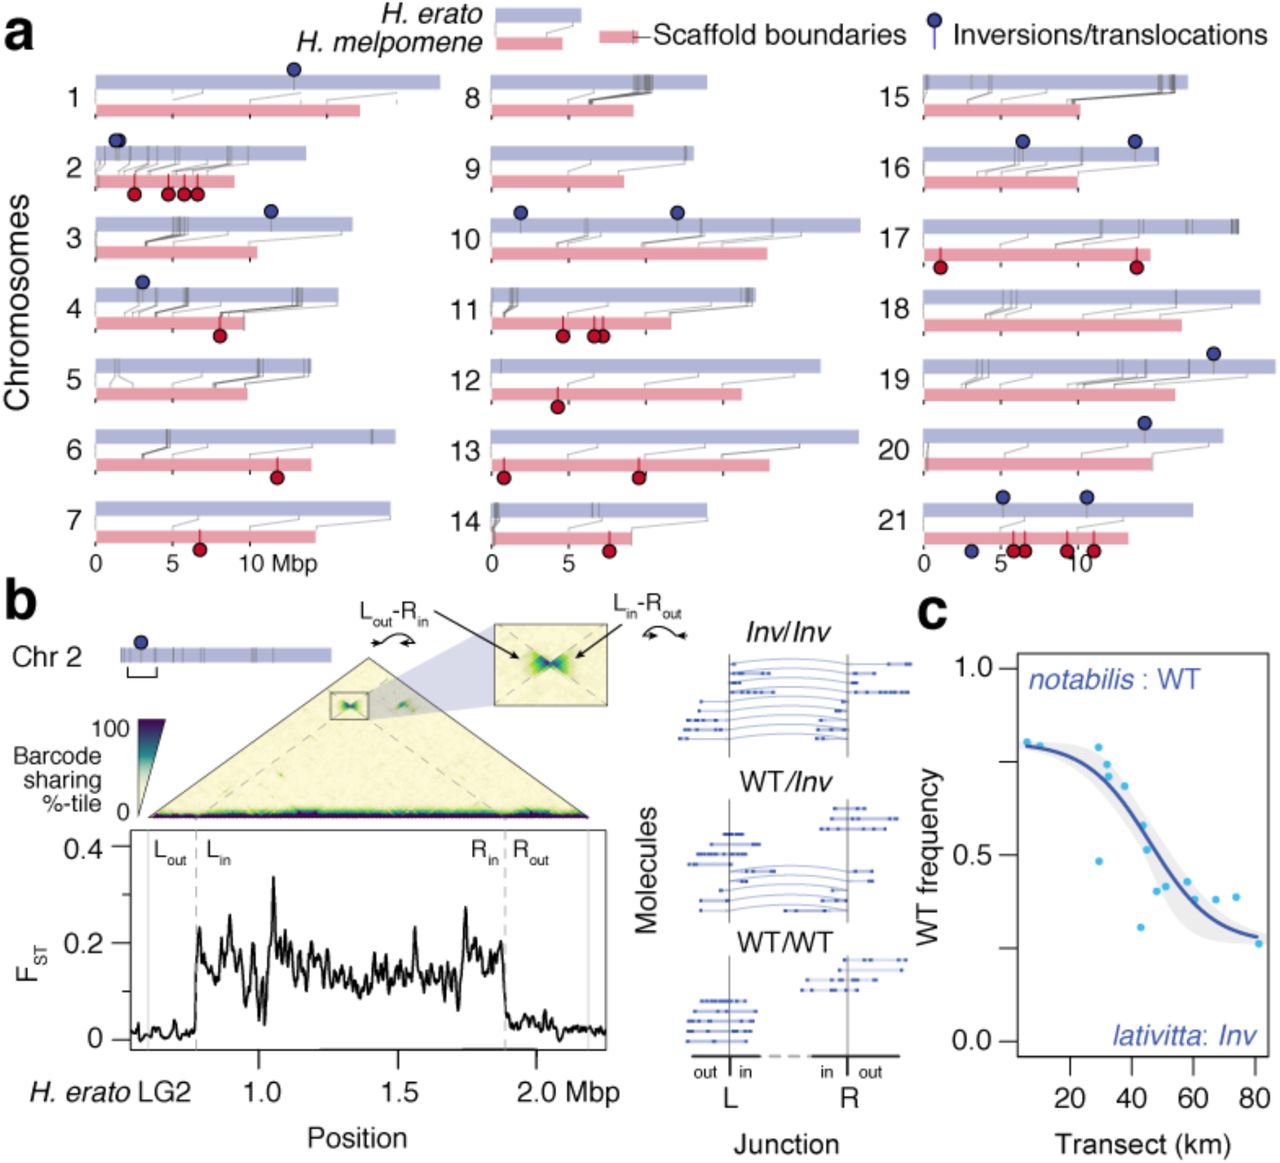
a, Locations of major structural rearrangements in the two Heliconius hybrid zones. Chromosome homologues are shown in pairs, with lines connecting syntenic positions between H. erato (grey) and H. mel. (red; lines; dark grey bars mark scaffold boundaries; circles mark major inversions or translocations). In contrast to the parallelism at divergent peaks shown in Fig. 3, major structural rearrangements tend to be unique for each species. b, Detection of a major inversion on H. erato Chr2. The average linked-read molecule spans multiple 10 kbp windows. Thus, the extent of beadTag sharing across windows (10 kbp here) can reveal discrepancies between the physical molecules and the reference assembly as well as across populations. The triangular matrix shows a heatmap of barcode sharing (colour indicates genome-wide percentile) juxtaposed against genetic distance (FST) across the pure notabilis and lativitta races. Inversions appear as a “bow-tie” shaped pattern across the inverted junction boundaries (L, left boundary of the inversion; R, right boundary of the inversion; out/in, outside or inside of the inversion; Leftin/Rightout and Leftout/Rightin, zoomed inset). This inversion coincides with a plateau of elevated genetic distance across the notabilis and lativitta races. Dotted lines mark the inferred inversion boundaries at Herato0204:172503– 1290057. Molecules from three individuals representing the three inversion collinear vs. hetero-karyotypes are shown (inferred inversion indicated with curved arrows). c, The Chr2 inversion shows a clinal distribution across the notabilis–lativitta hybrid zone (frequency of WT karyotype: blue dots; fitted cline: blue line; confidence interval: grey envelope).
Although structural rearrangements occasionally overlap divergent peaks or signatures of selection in single high- or lowland populations in either species, generally speaking they differ only very little between highland and lowland populations. There is also no sign of parallel rearrangements between H. erato and H. melpomene (Fig. 4a). However, a specific rearrangement on H. erato Chromosome 2 (Chr2) stands out. Here, among all H. erato samples we observed unusually high beadTag sharing between windows 1.1 Mbp apart, in a manner indicative of an inversion (Fig. 4b; inferred junctions at “Left”: Herato0204:172503 and “Right” Herato0204:1290057). This elevated signal is especially strong among lowland H. e. lativitta butterflies and is distinct from previously reported inversions on chromosome 2 24,40,41, suggesting that the inversion may have originated in H. e. lativitta or its close relatives. The two junctions bracket a region of elevated FST (Fig. 4b), suggesting reduced gene flow in this genomic region between the highland H. e. notabilis and lowland H. e. lativitta races. Using LR data, we have the opportunity to directly detect molecules that span the inverted Left and Right junctions, i.e., Leftout–Rightin and Leftin–Rightout (Fig. 4b, left, “bow-tie” pattern). This we find in 113 Inv/Inv individuals homozygous for the inverted allele (as well as 163 WT/Inv and 152 WT/WT individuals; Fig. 4b, middle panel), and show that the inversion is segregating across the H. erato hybrid zone.
Haplotype frequencies across the hybrid zone
In both species, migration and gene flow between the high- and lowland forms generated clines across the genome, i.e. gradient in gene frequencies along the transect (Extended Data fig. 10). For example, at the Chr2 inversion in H. erato, the wild type orientation decreases from 80.2% in the highland notabilis race to 26.3% in the lowland lativitta one (or 73.7% inverted; estimated centre of zone: 46. ± 3.2 km; width: 53.44 ± 23.7 km; Fig. 4c). This inversion contains 50 genes, and a spike in FST and ω within 25 kbp of a putative homeodomain transcription factor and a previous reported heat shock protein 28. In cline analysis, the steepness indicates selection: neutral loci introgress freely and produce wide and shallow clines, whereas strongly selected loci remain distinct between the races and produce sharp and narrow clines. Accordingly, the major colour loci are among the narrowest clines in the genome (Extended Data fig. 11). Plotting of both phenotypic and haplotype clines at optix (Chr18) and WntA (Chr10) in the two co-mimetic species shows a striking pattern: in each species, the WntA cline centre is shifted east towards the lowlands (at a large drop in elevation between km 45 – 50) relative to the optix cline, or indeed much of the genome (Fig. 5a; 15.28 and 20.87 km in H. erato and H. melpomene respectively; Extended Data fig. 11). However, at these two colour loci both the positions and widths of the clines closely mirror each other between H. erato and H. melpomene (optix, centres: 31.9 vs. 28.9 km; widths: 15.7 vs. 15.2 km; WntA, centres: 47.1 vs. 49.8 km; widths: 19.0 vs. 24.8 km; Fig. 5a & b; Supplementary Table 11). Interestingly, the minor colour loci (Ro and cortex) track with a different major colour locus in each species: Ro (Chr13) tracks with WntA in H. erato; and cortex (Chr15) tracks with optix in H. melpomene (Extended Data figs. 11 – 12). Both show broader cline widths, likely due to dominance and reduced phenotypic effects and thus weaker selection (Supplementary Table 11; 27). In fact, genetic crosses suggest that the displacement of the clines at these minor loci may reflect the underlying genetics in refining the match across the co-mimics: Ro acts as a modifier for WntA in shaping the forewing band in H. erato butterflies and its cline is shifted relative to other loci only in H. erato but not in H. melpomene. Likewise, cortex modifies optix to generate the fully dennis-ray phenotype only in H. melpomene and its cline shows a closer match with optix there than in H. erato (Extended Data fig. 3)27.
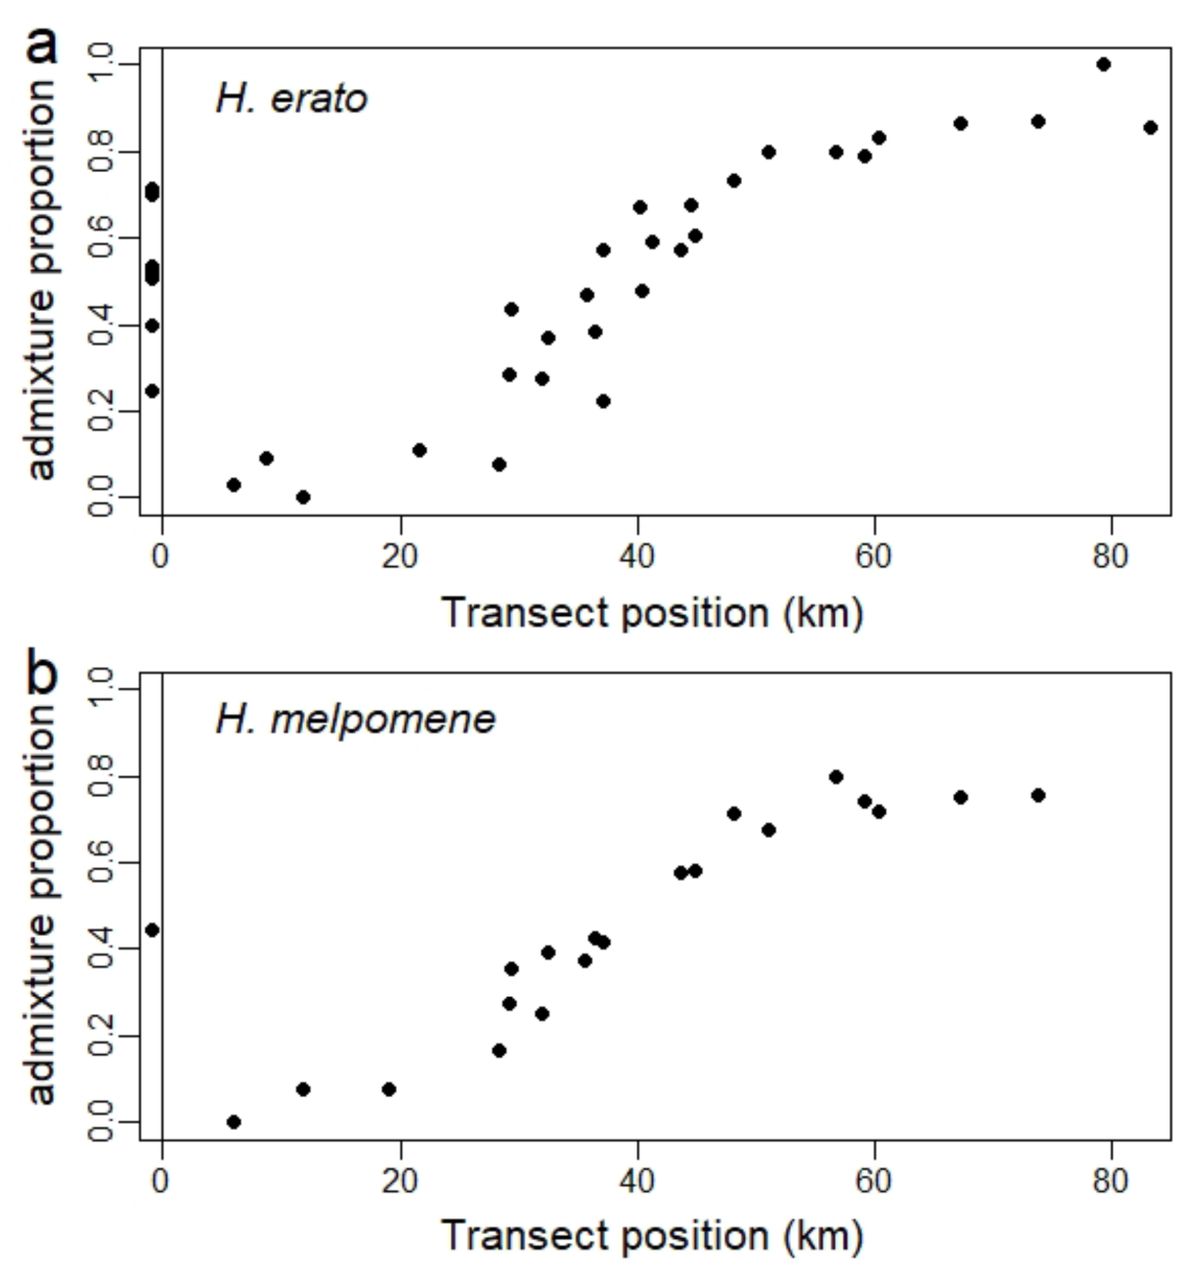
Admixture proportions derived from NGSadmix 64 results with K=2 for H. erato and K=3 for H. melpomene averaged across all samples of the same collection site and plotted against transect position. Sampling sites outside of the transect are shown below 0. Genomic sites have been randomly subsampled to 10% of the sites to reduce linkage and increase run efficiency. The whole genome shows clinal variation along the transect zone.

Clines of the most highly differentiated position of each 100 kbp window in H. erato (a-c) and in H. melpomene (d-f), excluding sites with FST below 0.5 in H. erato or below 0.4 in H. melpomene. Clines of the sites closest to the four colour loci are highlighted in colour and clines narrower than 30 km in darker grey. A list of the narrow clines is given in Supplementary Table 12 – 13. Histograms show the widths and centres of all clines, whereby the width and centre of the haplotype clines of optix and WntA are indicated with vertical lines in dark red and yellow, respectively. Note that the high number of narrow clines centred around 10 km represent SNPs where the population at El Topo in Baños (Tungurahua) is distinct from all other populations potentially due to isolation by distance.

a, Clines at the major colour loci optix, WntA, Ro (in H. erato, left column) and cortex (in H. melpomene, right column) across the hybrid zones are shown for haplotypes (genomic positions indicated above each panel; cline fits: solid lines with shading for confidence intervals; data points: circles) and phenotypes (cline fit: dashed lines; data points: diamonds). For the dominant loci Ro and cortex/N, the trait-based allele frequencies are estimated by assuming Hardy-Weinberg equilibrium. The haplotype cline fits for optix and WntA are repeated here to show the remarkable coincidence of these modifier loci with the major loci in each species.

a, Major colour traits segregating across the Ecuadorian hybrid zones show a clinal distribution of haplotype frequencies along the transect in both H. erato (left) and H. melpomene (right). There is strong agreement in cline fits between haplotype frequencies (filled circles; cline: coloured lines with 95% confidence envelope) and phenotype frequencies (diamonds and dashed lines). Optix (red) controls the red colour pattern (see Fig. 3 and Extended Data fig. 3e – f) and shows a steeper and west-shifted cline compared to WntA (yellow), which controls the number of forewing bands (Fig. 3). b, Clines are mirrored at both optix (left) and WntA (right) loci between H. erato (filled circles and coloured lines) and its H. melpomene co-mimic (empty circles and grey lines). c, Emergence of a novel hybrid morph in the middle of the hybrid zone. Due to the displaced clines, hybrid H. erato butterflies (left panel; orange symbols and lines; middle wings) can display the highland notabilis double-band (left; yellow) along with the lowland lativitta dennis and rays (right; red). This hybrid morph carries homozygous WntAH/H and optixL/L genotypes and is therefore true-breeding. Simulation results show the frequencies of the four morphs, assuming complete dominance at two loci. Morph i has fitness 1 + si (Pi - QI), which increases linearly with its own frequency, Pi. Even when clines at the two loci start fully coincident, they can shift apart and produce displaced clines over time (here, generation 1000), if there is a fitness advantage to one of the hybrid genotypes, here sA -; bb = 0.25, and the rest having si = 0.1.
The finding of displaced clines at the major colour loci makes this Ecuadorean hybrid zone unique among Heliconius hybrid zones. In all other Heliconius hybrid zones both H. erato or H. melpomene clines across the genome coincide regardless of mimicry (e.g., Peru 42,43 and Panama and Colombia 44). This may be because whenever clines overlap, they tend to be pulled together into coincidence due to increased LD 45.
To estimate the strength of selection, we analyzed the shape and correlation between clines at unlinked loci, and contrasted these results against previous estimates from the coincident zone in Peru 19. Whenever clines overlap, linkage disequilibrium (LD) is generated through the admixture of distinct populations, even between unlinked loci; the correlation between unlinked alleles is expected to have a maximum approximately equal to selection ( ; for linear FDS at two loci with complete dominance, = 0.73s). Previous studies in Peru gave R ~ 0.35 in H. erato, and R ~ 0.5 in H. melpomene 19,43. Here, we do not expect LD between shifted clines but neither do we see any significant association between coincident clines (Supplementary Tables 14 and 15). The maximum R consistent with our data is ~0.054 in H. erato, and ~0.154 in H. melpomene (Supplementary Table 15). Thus, we estimate selection to be substantially weaker (< 4% in H. erato and 11% in H. melpomene).
We can set upper limits to the dispersal rates () that would be consistent with observed cline widths () and weak LD; assuming linear FDS with complete dominance  42 so that
  in H. erato and 6.2 km in H. melpomene (Supplementary Table 15). These upper limits to dispersal are slightly larger than, and so consistent with, previous estimates in Peru 42. Thus, our data suggest that the clines here are maintained by substantially weaker selection, but dispersal rates may be similar. This weaker selection may in part be because the coincident clines involve loci with minor effects.
Emergence of a novel hybrid morph
One consequence of the displaced WntA and optix clines is that a novel, hybrid morph combining the highland double forewing band with the lowland dennis-ray pattern (WntAH/H;optixL/L) has become common in the middle of both Heliconius hybrid zones. Indeed, from 33 km – 45 km along the transect, this novel WntAH/H;optixL/L genotype is the most common morph in both species (Fig. 2b & 5c, left; Supplementary Tables 6 – 7). We used deterministic two-locus simulations to test whether positive FDS could maintain a novel hybrid morph. Our data with the shifted cline centres are largely consistent with dominance of the lowland over the highland allele at WntA and optix, and fit with the higher similarity of F1 individuals to lowland rather than highland individuals. This implies introgression of highland alleles into the lowland populations with four possible morphs (WntAH/H;optixH/H, WntAH/H;optixL/-, WntAL/-;optixH/H, WntAL/-;optixL/-; Supplementary Table 16). Over time, the cline centres are expected to shift west towards the highlands 46. All else being equal for the four morphs, clines that are well-displaced to start with can remain separate, because each cline moves at the same speed. But if they overlap, either initially or because the leading cline stops moving due to other factors, LD pulls them together (Extended Data fig. 13).

Each of the four morphs, labelled i, has fitness 1 + si (Pi - QI), where Pi is the frequency of morph i. In the top row, selection is symmetric, so that si = 0.1 for all i. a, Initially, there are step clines at each locus (red and yellow), centred at 20, 30. Clines move to the left, due to dominance, but remain ~10 apart; they are shown at 0, 500, 1000, 1500 generations, the two loci indicated by line thickness. Right: separation between clines over time, for different initial separations. If the clines are close enough, swamping and LD pulls them together, but otherwise, they remain separated. A density gradient or extrinsic selection gradient would pin the clines, and force them together even if initially well-separated. b, The same, but with stronger frequency-dependence sA -; bb favouring one of the hybrid phenotypes. If the clines are initially displaced such that the less fit hybrid morph is common, the red cline moves faster, and crosses the yellow cline, reaching an equilibrium shift such that the fitter hybrid is commoner. However, if the clines are far enough apart, the fitter hybrid can be maintained indefinitely (bottom right, lowest line). Right: the black line shows a scenario, where even if the two clines start off coincident, they become displaced due to the fitness advantage of the fitter hybrid morph. The simulation uses nearest-neighbour migration, with m=0.5.
The above scenario will produce a hybrid morph that can persist, perhaps indefinitely; but its distribution will shift west over time, given suitable habitats. Since the distribution of the hybrid morph appear to be stable, there must be additional factors that cause clines (including ones that at first coincide) to shift and remain apart. These could include genetic incompatibilities or a selective advantage of one hybrid morph over the other 47,48, but we favour a model in which the hybrid morph is favoured or experiences stronger FDS, perhaps due to a more memorable phenotype for predators, which can maintain stable shifted clines as observed in the empirical data (Extended Data fig. 13, bottom). Unlike hybrid morphs with heterozygous genotypes, this novel WntAH/H;optixL/L hybrid morph breeds true and has risen to appreciable frequencies, perhaps representing establishment of a novel hybrid race.
Discussion and Conclusions
The discovery and characterization of natural variation in the genome is a key first step in genetics and evolution. Such information can help us understand the genetic basis of trait variation and speciation. However, until now it has not been easy to capture this variation as haplotypes in large population samples. Haplotagging solves this problem by generating linked-read data from hundreds of samples efficiently and affordably. These data are far richer in information and permit the simultaneous characterization of both nucleotide and structural variation.
More broadly, this work highlights the advantage of combining broad population sampling with linkage information in large-scale LR data. Together, they allow efficient and accurate genome-wide haplotyping, as opposed to genotyping. We hope that this work will spur development of improved algorithms and experimental designs, such that future researchers may be able to perform (meta)genome assembly, phasing, imputation and mapping in a single experiment. We anticipate that haplotagging or similar approaches (and eventually long-read sequencing) may help drive the next phase of discoveries in model and non-model organisms alike.
We have used these data to demonstrate the early stages in establishment of a novel hybrid race, through the parallel displacement of clines in two species. In addition, we have also discovered >300 novel candidates under local or divergent selection, which opens up additional dimensions beyond wing colour patterns to investigate this double hybrid zone. Somewhat to our surprise, our survey for structural rearrangements such as inversions were not consistently associated with population differentiation in either species, suggesting that they do not play an early role in mediating divergence in the face of gene flow, despite widespread support in the literature (36,38,49,50, reviewed in 51 but see 40). More broadly, our results highlight further the evolutionary potential of hybridisation in local adaptation and the early stages of speciation 52–54.
Material and Methods
See Material and Methods in Supplementary Information
Funding statement
The authors declare competing financial interests in the form of patent and employment by the Max Planck Society. The European Research Council provides funding for the research but no other competing interests.
Acknowledgements
We thank Felicity Jones for input into experimental design, helpful discussion and improving the manuscript. We thank the Rolian, Jiggins, Chan and Jones Labs members for support, insightful scientific discussion and improving the manuscript. We thank the Rolian lab members, the Animal Resource Centre staff at the University of Calgary, and Caroline Schmid and Ann-Katrin Geysel at the Friedrich Miescher Laboratory for animal husbandry. We thank Christa Lanz, Rebecca Schwab and Ilja Bezrukov for assistance with high-throughput sequencing and associated data processing; Andre Noll and the MPI Tübingen IT team for computational support. We thank Ben Haller and Richard Durbin for helpful discussions. We thank David M. Kingsley for thoughtful input that has greatly improved our manuscript. J.I.M. is supported by a Research Fellowship from St. John’s College, Cambridge. A.D. was supported by a European Research Council Consolidator Grant (No. 617279 “EvolRecombAdapt”, P/I Felicity Jones). C.R. is supported by Discovery Grant #4181932 from the Natural Sciences and Engineering Research Council of Canada and by the Faculty of Veterinary Medicine at the University of Calgary. C.D.J. is supported by a BBSRC grant BB/R007500 and a European Research Council Advanced Grant (No. 339873 “SpeciationGenetics”). M.K. and Y.F.C. are supported by the Max Planck Society and a European Research Council Starting Grant (No. 639096 “HybridMiX”).
References


