

Abstract
Prior fMRI research indicates that lower resting-state functional connectivity between two specific brain networks is linked to better cognitive test performance in children and adults. However, most study samples are skewed towards higher-socioeconomic status individuals – and what is adaptive for one population may not be for another. In a pre-registered study, we analyzed resting-state fMRI data from 6839 children ages 9-10 years. For children above the federal poverty line, we replicated the prior finding: better cognitive performance was related to weaker connectivity between the lateral frontoparietal and default mode networks. However, for children living in poverty, this relation trended in the opposite direction. Follow-up cross-validated predictive analyses revealed that these results were driven by several key features of a child’s environment. Thus, “optimal” brain function depends in part on the external pressures children face, highlighting the need for more diverse samples in research on the human brain and behavior.
Introduction
In the United States, one fifth of children are estimated to live below the poverty line (Semega et al., 2019). Relative to children living just above poverty, these children are least likely to have access to the federal social safety net, and they are at heightened risk for poor health and educational outcomes (Hoynes & Schanzenbach, 2018; Reardon, 2016). Compared to their peers whose families earn more money, children living in poverty tend to perform worse on tests of cognitive functioning (for a review, see Farah, 2017), itself a risk factor for later outcomes (e.g., Spengler et al., 2015). However, such broad comparisons obscure substantial variability within the group of children living in poverty, a large segment of whom score on par with their higher-income peers. Here, we seek to understand this form of resilience—high cognitive test performance in the face of structural barriers to success. One way to begin to address this question is to identify sets of experiences that may be protective for children in poverty, given the wide range of experiences they have (DeJoseph et al., 2020; Gonzalez et al., 2019). Another way is to probe differences in brain function, to gain insight into the mechanisms underlying resilience. In this study, we examine the neural and environmental correlates of resilience in a sample of over 1,000 children across the United States likely to be living in poverty.
In one of the most influential theories of development, Waddington proposed that ontogenetic trajectories are variable across individuals and not inherently fixed at birth (Johnson & de Haan, 2015; Waddington, 1957). Instead, both biological and environmental influences interact across development to constrain the ultimate expression of cells in our bodies. This means that in some cases, environmental pressures, especially early in life, may cause two individuals with the same biological constraints to develop different phenotypes. In other cases, two individuals may take distinct developmental trajectories, but ultimately still develop the same phenotype (Edelman & Gally, 2001). Extending this metaphor to the current study, it is possible that two children who display the same level of performance on a cognitive test might achieve this through different developmental trajectories, if they grow up under different external pressures. The optimal developmental trajectory for a child, therefore, may be influenced by the child’s environment.
Accumulating evidence suggests that the brain is able to adapt flexibly to the constraints of the environment, especially in early life. Both humans and nonhuman animals develop skills that best suit the needs of their contexts. For example, in one set of studies, adults who had grown up in unpredictable early environments performed better on tests of task shifting, which may be an adaptive skill to possess during periods of instability (Mittal et al., 2015). Similar findings have been observed in humans and nonhuman animals across a wide range of early experiences and cognitive domains (Ellis et al., 2017; Frankenhuis et al., 2019; Young et al., 2018). The result of this flexibility may be that higher-level cognitive skills such as executive functions and reasoning develop in context-sensitive ways.
Thus, neural differences between groups of children growing up in different contexts need not indicate behavioral deficits or neural inefficiencies for either group—in some cases, they may point to alternate routes toward the development of these higher-level cognitive skills. Children living in poverty can have vastly different experiences, including varying levels of exposure to threatening circumstances or deprivation of resources (Humphreys & Zeanah, 2015; McLaughlin et al., 2014). Understanding the ways in which their brains may have been tuned by their respective environments can lend insight into mechanisms of adaptation, and, ultimately, how best to support each child within the specific constraints of their lives.
Strikingly, while much research has characterized the trajectories of brain development that support cognitive test performance for upper-middle class children—most of whom who tend to be living in urban places close to universities in the United States—only in the last decade has research begun to focus on children from lower socioeconomic status (SES) backgrounds. This new thrust of research has begun to uncover neural differences between higher- and lower-SES children in brain structure and function, beginning from an early age (e.g., Hair et al., 2015; Hanson et al., 2013; S. B. Johnson et al., 2016; Leonard et al., 2019; Mackey et al., 2015; Noble et al., 2015; Noble et al., 2006). However, even while this field of the developmental cognitive neuroscience of SES has grown, children living below the poverty line tend to be under-represented within the population considered to be lower SES. In addition, many studies group children considered lower SES together and compare them to a group of higher SES children, obscuring variability within the lower SES group. Characterizing optimal brain development for children living below poverty helps shift our questions away from how these children differ from children above poverty, and toward a closer understanding of mechanisms underlying variability among children who are underrepresented in cognitive neuroscience. Ultimately, this brings us toward a fuller understanding of brain development across the full spectrum of life experiences.
In line with the hypothesis that children may achieve the same behavior or phenotype through different developmental routes, studies examining brain function during higher-level cognitive tasks often find qualitatively different brain-behavior relations as a function of children’s family income. These differences appear particularly in lateral prefrontal cortex (PFC) and parietal regions—two regions involved in higher cognitive function which show protracted development (Casey et al., 2000), and are likely to be sensitive to environmental input (Farah, 2017; Mackey et al., 2013; Merz, Maskus, et al., 2019).
For example, an early study by Sheridan et al. found that nine-year-olds who fell below the median of their sample on the federal income-to-needs ratio (mean of 1.75 in the lower-income group) showed stronger lateral PFC activation when performing a novel rule-learning task. Further, increased levels of activation appeared to be marginally positively related to learning for the lower-SES children, while the opposite pattern was found among the higher-SES children (Sheridan et al., 2012). In another study, however, Finn et al. found that children who qualified for free or reduced lunch (those whose families made less than 185% of the federal poverty level) showed weaker activation of lateral PFC than their higher income peers as working memory load increased. Further, these differences in activation were related to children’s performance on a standardized math test (Finn et al., 2017).
Collectively, these and other studies suggest that children with lower versus higher family incomes may recruit different patterns of neural circuitry—particularly in lateral prefrontal and parietal regions—to complete tasks such as working memory, rule learning, and attention (see Merz, Wiltshire, & Noble, 2019 for a review). These differences in brain function are typically thought to reflect differences in either the cognitive mechanisms by which children approach the task or efficiency of neural processing. However, differences in tasks and task demands make it difficult to generalize across studies showing lower or higher PFC activation as a function of SES. When children are performing a specific task, differences in brain function cannot reveal whether there are differences in attentional allocation or strategies used to solve the task, or in the underlying neural systems that support that behavior.
One way to reconcile these findings of SES differences in brain function may be to measure the activity of large-scale brain networks in the absence of specific task demands to investigate how these more global patterns relate to cognitive performance. In this vein, researchers have probed large-scale brain networks by measuring brain function at “rest”—that is, they have measured patterns of low-wave fluctuations in neural activity over time while participants simply lay awake in the scanner. This approach, called resting-state fMRI, has revealed high correlations over time among anatomically distal brain regions. Brain regions that are highly correlated are thought to work in tandem with one another, forming several networks across the brain that each become more cohesive and segregated from one another across development (Power et al., 2010). Patterns of temporal coupling within and across networks are thought to reflect a prior history of co-activation, offering insight into recent thought patterns (Guerra-Carrillo et al., 2014). Indeed, there is evidence that children and adolescents living in disadvantaged neighborhoods show baseline differences in resting-state connectivity patterns (Marshall et al., 2018). Here, we sought to investigate the relations between resting-state connectivity and both cognitive performance and specific environmental factors.
In studies of higher-level cognition in adults, these large-scale brain network dynamics have been found to predict cognitive test performance (Barber et al., 2013; Hampson et al., 2010; Keller et al., 2015; Kelly et al., 2008). One such network, the lateral frontoparietal network (LFPN), includes regions in the lateral prefrontal and parietal areas, and is consistently activated in higher-level cognitive tasks, such as those taxing executive functions or reasoning. LFPN is more active during performance of externally directed tasks than during opportunities for unconstrained, internally directed thought (Vincent et al., 2008). In contrast, the default mode network (DMN), including regions in the medial frontal and medial parietal areas, is consistently de-activated during external tasks, relative to other brain networks. The DMN is more active during internally oriented processing (Raichle et al., 2001), as well as during tasks that require mentation outside of the here-and-now (Spreng, 2012).
In prior adult fMRI studies, stronger connectivity within LFPN and weaker connectivity between LFPN and DMN has been associated with higher cognitive performance (Barber et al., 2013; Hampson et al., 2010; Keller et al., 2015; Kelly et al., 2008). This set of findings has led to the view that, in order to perform well, individuals must practice focusing narrowly on the task at hand while inhibiting internally-directed or self-referential thoughts (Raichle et al., 2001; Simpson et al., 2001a, 2001b; Weissman et al., 2006). As with developmental work, however, the vast majority of participants in adult fMRI studies are relatively high in SES.
Consistent with adult research, studies focusing on generally higher-income children suggest that relations between LFPN and DMN are related to children’s cognitive test performance. As children develop, LFPN and DMN become more segregated from one another (Chai et al., 2014), and increased LFPN within-network correlation and diminished LFPN-DMN correlation at rest each predict better cognitive test performance at ages 10 and 13 (Sherman et al., 2014). In addition, increased LFPN activation and decreased DMN activation during a working memory task were related to improvements in working memory between ages 8 and 22, mediating age-related improvement, cross-sectionally (Satterthwaite et al., 2013). Reduced anticorrelations—that is, tighter coupling—between key nodes in these networks at age 7 have even been shown to predict attentional problems at age 11 (Whitfield-Gabrieli et al., 2020). Taken together, the literature suggests that it is adaptive for DMN to function largely independently from LFPN during performance of a cognitively challenging task, and that the development of this dissociation may promote stronger focus on externally directed tasks.
Drawing from a large behavioral and brain imaging dataset including over 10,000 children across the United States (ABCD Study; Casey et al., 2018), we asked whether the patterns of connectivity that are adaptive among higher SES children also help to explain why some children living in poverty are more resilient than others. Specifically, in a set of pre-registered analyses, we tested whether characteristics of LFPN and DMN connectivity predict cognitive test performance for over 1,000 children from this larger dataset estimated to be living in poverty. We combined measures of children’s abstract reasoning (Matrix reasoning task), inhibition (Flanker task), and shifting (Dimensional Card Sort task), to capture children’s performance on higher-level cognitive tasks that did not task verbal skill, given well-established SES differences in verbal performance.
Given prior evidence from higher SES children and adults, we predicted that weaker LFPN-DMN between-network connectivity (decreased LFPN-DMN temporal coupling) and stronger within-network LFPN connectivity (LFPN-LFPN coupling) would be related to higher cognitive test performance even for children living in poverty. However, it is also plausible that children in poverty might develop different brain-behavior links in order to contend with different barriers. In line with theories that children could achieve the same phenotype through alternate developmental trajectories, one might expect that higher cognitive test scores would be predicted by different patterns of network connectivity among children in poverty. To preview our findings, our analyses revealed a different pattern in children in poverty than had been observed in prior studies. As a result, we conducted follow-up analyses involving the higher-income children in this sample to test whether their data would replicate prior findings, and confirmed that it did.
In a second set of pre-registered analyses, we probed demographic variables to better understand features of children’s environments which might explain variability both in their cognitive test performance, and in the relation between LFPN-DMN connectivity and cognitive test performance. We looked at a set of 29 variables that span home, school, and neighborhood contexts to see whether they could predict variability in children in poverty’s test performance. We also included interactions between LFPN-DMN connectivity and each of these variables, to see if patterns of brain-behavior relations could be explained by any particular set of experiences.
To our knowledge, this is the largest sample of children living below the poverty line whose brain development has been studied. Moreover, the tight age range in this dataset—all children were between 9 and 10 years old—complements prior studies that have considered children across a much wider age range. Ultimately, examining relations between patterns of brain activity and cognitive test performance could help to elucidate the mechanisms through which high-performing children in poverty are able to contend with structural barriers in their environments.
Results
We identified 1,034 children between ages 9 and 10 with usable data on cognitive test performance, resting state connectivity, and family income, who were likely to be living below the poverty line in 2016-2018, when the data were collected. We made this determination by comparing children’s combined household income to the Supplemental Poverty Level for 2015-2017 averaged across study sites, which adjusts for variation in the cost of living in different locations, as well as household size (L. Fox, 2017). We considered children to be in poverty if they were part of a family of 4 with a total income of less than $25,000. An additional 5,805 children from the same study sites had usable cognitive test, resting state, and family income data and were likely to be living above the poverty line, based on their combined household income (ranging from $25,000 to over $200,000) and number of individuals in the home. Participant information is displayed in Tables 1 and 2.
Participant characteristics. Demographic information in plain text; brain and cognitive variables italicized.
Wider environmental information. Variables included in the ridge regression predicting cognitive test scores. All except income were used in primary models; additional tests confirmed that income did not add predictive power above and beyond these variables.
Children’s scores on the three cognitive tests (Matrix reasoning, Flanker task, and Dimensional Card Sort task) were moderately correlated with each other, r = 0.23 – 0.43 in the whole sample, r = 0.25 – 0.39 for children living in poverty alone. We created summary cognitive test scores by summing children’s standardized scores on all three tests, as pre-registered. We first tested whether there was an association between income and cognitive test scores, using a linear mixed effects model with a random intercept for study site. For this analysis, income was defined as a continuous variable using the median income level in each income bracket. Results replicated prior studies (e.g., Duncan & Magnuson, 2012; Farah, 2018; Noble et al., 2015): on average, children whose families had higher incomes tended to perform better on cognitive tests, B = 0.008, SE = 0.0004, p < 0.001, r = 0.24, a moderate effect size, though it accounts for only 6% of the variance in children’s cognitive test scores. As shown in Figure 1, however, there was large individual variability in cognitive test scores within each income bracket. It is this individual variability we sought to explore further.

Illustration of the variability of cognitive test performance within every level of family income in the sample (N = 6839). Colors indicate whether children were classified as living in poverty, based on a combination of their family income and number of people in the home. Replicating prior studies, higher income is associated with higher cognitive test performance (R = 0.24); however, it is important to acknowledge this substantial variability within and overlap between children at each level of family income.
LFPN-DMN connectivity
Working from our pre-registered analysis plan (https://aspredicted.org/blind.php?x=3d7ry9), we tested the relation between LFPN-DMN connectivity and nonverbal cognitive test performance in our sample of children in poverty. We used linear mixed effects models to predict cognitive test performance from LFPN-DMN connectivity, controlling for children’s age and head motion in the scans, with a random intercept for study site (see Methods). Contrary to previously published results, we did not find a negative association between LFPN-DMN connectivity and test performance. In fact, the estimated direction of the effect was positive, though this was not statistically significant, B = 2.11, SE = 1.12, t (1028) = 1.88; χ2 (1) = 3.52, p = 0.060. This numerically positive association was still observed when using a robust linear mixed effects model, which detects and accounts for outliers or other sources of contamination in the data that may affect model validity, B = 1.78, SE = 1.09, t = 1.64. Thus, this unexpected pattern was not driven by outliers. This effect was most pronounced for Matrix Reasoning and least evident for Flanker, but the estimate was positive for all three tests (see Supplement).
Given this unexpected result, we next explored whether the expected association between LFPN-DMN connectivity and test performance was present in higher-income children in the larger dataset. To this end, we analyzed the 5,805 children from the same study sites were likely to be living above the poverty line. Consistent with prior studies (Satterthwaite et al., 2013; Sherman et al., 2014; Whitfield-Gabrieli et al., 2020), children living above the poverty line showed a negative association between LFPN-DMN connectivity and cognitive test performance, B = −1.41, SE = 0.45, t (5794) = - 3.14; χ2 (1) = 9.85, p = 0.002. A direct comparison between the groups confirmed that the association between LFPN-DMN connectivity and test performance differed as a function of whether or not children were living in poverty, χ2 (1) = 8.99, p = 0.003 (Figure 2). For children living above poverty, having higher LFPN-DMN connectivity appeared to be risk factor for low cognitive test performance, while for children living below poverty, this was more protective (see Supplementary Figure 1).

Relations between resting state network metrics and cognitive test score residuals, for children living above poverty (dark blue) and below poverty (light blue). Models include fixed effects for age and motion and a random effect for study site. Panel A: Children living above poverty show an expected, negative, relation between LFPN-DMN connectivity and test performance, B = −1.41, SE = 0.45; p = 0.002, while children living below poverty show the opposite pattern, B = 2.11, SE = 1.12; p = 0.060, interaction: X2 (1) = 8.99, p = 0.003. Panel B: Children across the sample show a non-significant positive relation between LFPN-LFPN within-network connectivity and test performance, above poverty: B = 0.34, SE = 0.36; p = 0.346; below poverty: B = 0.24, SE = 0.87; p = 0.783; interaction: X2 (1) = 0.0005, p = 0.982. Networks functionally defined using the Gordon parcellation scheme; on left, LFPN is shown in yellow and DMN shown in red, figures adapted from (Gordon et al., 2016).
To further investigate the reliability of this dissociation, we performed several follow-up tests. Our first test was designed to probe how frequently the parameter estimate observed in the children in poverty would be expected to be observed in a larger sample of children living above poverty. Using a bootstrapping procedure (see Methods), we estimated the expected distribution of LFPN-DMN coefficients for the prediction of cognitive test scores among the higher-income children in the dataset. The results of this analysis confirmed that the observed estimate for children in poverty fell outside of the 95% CI, and was higher than 987 out of 999 bootstrapped samples, p = 0.013. Repeating this bootstrapping procedure for children living below poverty revealed a similar effect (see Supplement); the bootstrapped distributions from the two samples are plotted side by side in Figure 3. Permutation testing further confirmed this dissociation; a model trained on children above poverty consistently over-estimated the performance of children living below poverty, well outside of what would be expected by chance (see Supplement). These results confirm that the relation between LFPN-DMN connectivity and cognitive performance differed for children living below and above poverty.

Bootstrapped distributions for LFPN-DMN connectivity parameter estimates in the models predicting cognitive test performance, for children above (dark blue) and below (light blue) poverty. Estimates calculated from models run on 500 data points drawn with replacement from each sample separately, repeated 999 times. Bootstrapped coefficients for children above poverty ranged from −6.47 to 3.74, with a mean of −1.41, 95% CI [-1.50, −1.31], mirroring our observed parameter estimate for the higher-income group. The observed estimate for children in poverty fell outside of the 95% CI, and was higher than 987 out of 999 bootstrapped samples, p = 0.013.
We performed several additional follow-up analyses to ensure that these results were not driven by differences in head motion or age. First, head motion—which is known to influence functional connectivity estimates (Power et al., 2015)—differed significantly as a function of poverty status (see Table 1) and was correlated with cognitive test performance (B = −1.91, SE = 0.16, p < 0.001). Thus, we repeated these analyses with only those children who met a stringent motion criterion of less than or equal to 0.2 mm of average framewise displacement (N = 4444; 589 below poverty). Results were consistent, and even stronger, in this subsample of low-motion children (see Supplement). Second, given prior evidence that LFPN and DMN become less correlated across age, we asked whether this relation was true in the current study. Indeed, even within this very restricted age range, LFPN-DMN connectivity was lower among older children across the entire sample, B = −0.0003, SE = 0.0001, t (6832) = - 2.93 p = 0.003, a pattern which was consistent for both children below poverty and those above (see Supplementary Figure 2). We note that, while children in poverty had marginally higher LFPN-DMN connectivity overall (see Table 1), this difference was eliminated when accounting for group differences in child age; on average, children living above poverty were approximately 17 days older than children living below poverty (see Table 1).
LFPN-LFPN connectivity
Following our pre-registration, using linear mixed effects models, we next tested whether children in poverty would show the positive correlation between LFPN within-network connectivity and cognitive test performance that has previously been documented in higher-SES children. The relation between LFPN-LFPN connectivity and test scores was not significant for children in poverty, B = 0.24, SE = 0.87, t (1028) = 0.28; χ2 (1) = 0.08, p = 0.783, or for the higher income children in the larger study, B = 0.34, SE = 0.36, t (5797) = 0.94; χ2 (1) = 0.89, p = 0.346. Thus, strength of resting-state functional connectivity within the LFPN network was not a predictor of cognitive performance in this large sample of 9 to 10-year-olds.
Environmental variables
To further explore the dissociation observed for LFPN-DMN connectivity, we next asked whether features of children’s environments might explain why the brain-behavior link differed as a function of poverty status. Even among children living in poverty, different children are exposed to very different experiences in their homes, neighborhoods, and schools. Under what environmental constraints might it be optimal (with respect to cognitive test performance) for the LFPN to work more closely with the DMN? To answer this question, we considered 29 demographic variables chosen to reflect features of children’s home, school, and neighborhood environments (Table 2). To test whether any of these variables could explain the observed group interaction, we performed Ridge regression. Specifically, we used nested cross-validation to predict cognitive test performance from an interaction between LFPN-DMN connectivity and these demographic variables, in addition to main effects of each of these variables. Briefly, Ridge regression is a regularization technique that penalizes variables that do not contribute to model fit, thus giving more weight to the most important variables. This approach allows for the inclusion of many variables in a model while reducing the chances of overfitting, and deals with issues of multicollinearity. We pre-registered this second step of analyses prior to examining the data further (https://aspredicted.org/blind.php?x=tg4tg9), given the substantial analytic flexibility possible with such a large set of variables.
We trained our model in a training set of two-thirds (N = 670, after removing missing data) of the children in poverty, using 5-fold cross-validation. Next, we tested whether these demographic and neural model parameters could be used to predict cognitive test scores in the held-out test set: the remaining one-third (N = 329) of children in poverty. Indeed, we found that our model performed above chance (cross-validated R2 > 0), explaining 6% of the variance in children’s cognitive test scores in this held-out sample. While 6 percent is small, it bears mentioning that this is a pure indicator, unlike the R2 of models that have been fit to the data themselves and are thus likely to be inflated because they are overfit. More importantly, this prediction is based on a relatively restricted sample of children: those who live in poverty, whose total family income is below $35,000. As we report below, the model is far more predictive when applied to the highly heterogeneous sample of children living above the poverty line.
Exploring the model parameters revealed that the strongest predictors of test performance for children in poverty included parents’ highest level of education; children’s race/ethnicity; youth-reported school disengagement (a negative predictor); strength of parents’ ethnic identification (a positive predictor); generational status—that is, the number of generations the family has been in the United States (a negative predictor); and a number of more structural characteristics, particularly related to the composition of children’s neighborhoods (Table 3). Thus—even within this relatively restricted sample of children living in poverty—individual, home, neighborhood, and school variables helped to predict children’s cognitive test scores.
Estimated coefficients from Ridge regression predicting children’s cognitive test scores, when controlling for fixed effects of age and motion and random effects of study site, for all children below the poverty line. Interactions with and main effect of LFPN-DMN connectivity italicized.
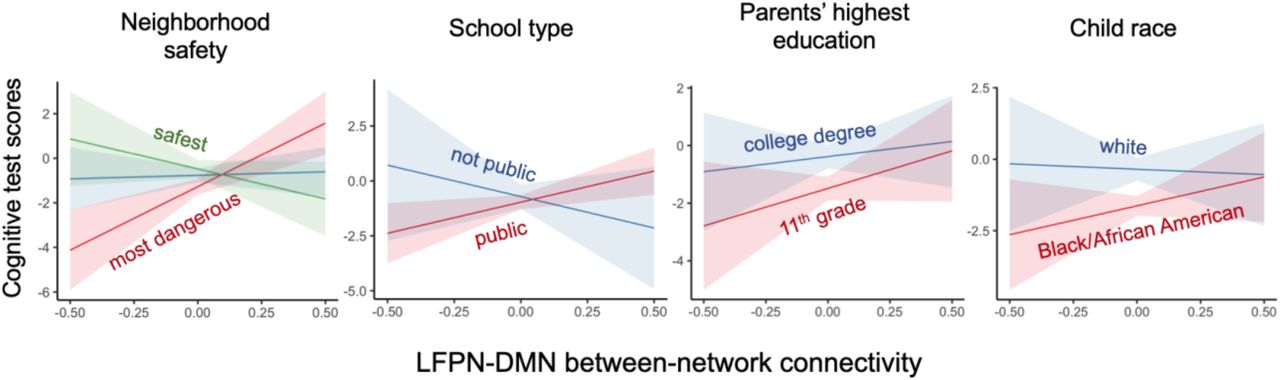
When considering interactions between functional connectivity and demographic variables, we found that a small number of characteristics of children’s experiences interacted with LFPN-DMN connectivity to predict cognitive test scores. Specifically, variables related to school type, neighborhood safety, child’s race/ethnicity, and parents’ highest level of education contributed to model fit (see Table 3). To better understand these results, we plotted the relation between cognitive test scores and LFPN-DMN connectivity for the factors showing significant interaction effects (Figure 4). Visualizing the interaction for neighborhood safety revealed that children living in safer neighborhoods showed a negative relation between LFPN-DMN connectivity and test performance, whereas those who lived in particularly dangerous neighborhoods showed a positive relation. With regard to schooling, the relation between LFPN-DMN connectivity was more positive for children attending public schools than those attending other types of schools (predominantly charter, N = 79, and private, N = 40). Thus, the brain-behavior relation for children in poverty living in safer neighborhoods, or attending non-public schools, more closely resembled that of the higher-income sample. Similar results were true for levels of parental education and race, such that subsets of children whose parents were more highly educated and children who were white showed a more similar pattern of brain-behavior relations as children living above poverty.
Interactions between demographic variables and LFPN-DMN connectivity in predicting cognitive test scores, for children below poverty. The majority of non-public schools were charter and private schools. In addition, only white and Black/African American race are displayed as these were the most represented in the current sample. 89% level confidence intervals for predicted effects calculated and displayed using the sjPlot package in R (Lüdecke, 2019).
Given that this model achieved predictive power even in a held-out sample of children in poverty, we wondered whether the relations between these demographic, brain, and cognitive variables would hold across a broader spectrum of socioeconomic status. Thus, as an exploratory analysis, we tested whether these initial model parameters, trained on the two-thirds of children living in poverty, could also be used to predict cognitive test performance in the higher-income children. Again, we found that the model performed above chance; in fact, it explained 19% of variance in cognitive test scores in this large, diverse sample.
Finally, we conducted a confirmatory factor analysis to test whether the demographic variables could be split into individual and home, neighborhood, and school factors based on our a priori categorization. This categorization did not meet our pre-registered criteria for a good model fit (our CFI was considerably lower than 9); as a result, we did not continue with this portion of the analysis. Thus, our data-driven approach provided insights that would have been missed by simply categorizing variables based on our prior assumptions.
Discussion
Prior research in both adults and children suggests that, in order to perform well on cognitively demanding tasks, the LFPN must operate independently from the DMN (Chai et al., 2014; Sherman et al., 2014; Whitfield-Gabrieli et al., 2020). Given that the LFPN and DMN have been linked to externally and internally focused attention, respectively, these findings are generally taken to suggest that it is optimal for individuals engaged in a cognitively demanding task to focus narrowly on the task at hand while inhibiting internally-directed or self-referential thoughts (Raichle et al., 2001; Simpson et al., 2001a, 2001b; Weissman et al., 2006). However, the majority of the research that led to this conclusion has been conducted with non-representative samples of individuals from higher-income backgrounds. Given the large heterogeneity of experiences and outcomes for children living in poverty, we focused on this relatively under-studied population.
In this study, we tested the relation between patterns of brain connectivity and nonverbal cognitive test performance for over 1,000 American children estimated to be living in poverty. Although children in poverty scored lower on average than their higher-income peers from the same study sites, there was large variability. Indeed, many of the children in poverty scored on par with children whose family incomes were considerably higher. In contrast to prior research, we did not find that higher cognitive test scores were associated with stronger anti-correlations between the LFPN and DMN within this group; in fact, these children showed a weakly positive relation between cognitive performance and functional connectivity between these networks. By contrast, for the children in the sample living above poverty, we replicated the negative relation observed in prior studies (e.g., Sherman et al., 2014). Thus, for children living above poverty, having higher LFPN-DMN connectivity could be a risk factor for lower cognitive test performance, while for children living below poverty, it could be protective.
Further confirming the reliability of this dissociation, both a bootstrapping analysis and permutation testing showed that models trained on the data from the children living above poverty did a poor job of predicting test performance for the children below poverty. It is important to note that the fact that we see statistically trending but numerically small group differences in overall LFPN-DMN functional connectivity, as well as no evidence of group differences in LFPN-LFPN connectivity. As such, the most salient difference between children below and above poverty in our analyses was not overall brain connectivity, but rather the relationship between connectivity and cognitive performance.
This pattern of results is also in line with prior structural and task-based brain imaging studies showing interactions between SES and neural variables in predicting test performance (Leonard et al., 2019; Merz, Wiltshire, et al., 2019). For example, several studies have found SES differences in lateral prefrontal and parietal activation during cognitive tasks, core nodes of the LFPN (e.g., Finn et al., 2017; Sheridan et al., 2012). Together, these findings support the idea that which patterns of brain function are adaptive with respect to cognitive test performance depends on the environments that children must contend with.
One interpretation of this unexpected interaction is that the relation between LFPN-DMN connectivity and test performance depends in part on the demands of children’s daily experiences. It may be optimal under some circumstances to engage in thought patterns that more frequently co-activate the LFPN and DMN (e.g., Christoff et al., 2009; Fornito et al., 2012; Prado & Weissman, 2011). For example, while DMN is generally thought to be suppressed during goal-directed tasks, it is active during a variety of goal-directed tasks that require internal mentation, or projection outside of the here-and-now (e.g., thinking about the past or the future). In particular, the DMN has been found to support performance on tasks involving autobiographical memory, prospective memory (planning), and introspecting about one’s own and others’ thoughts (Buckner & Carroll, 2007; Spreng, 2012).
Thus, stronger temporal coupling between the LFPN and DMN for the higher-performing children living in poverty could be related to drawing on past experiences and planning for the future, which may be more important for children who grow up under circumstances in which a path toward achieving success is less clear-cut. Additionally or alternatively, it may be beneficial for disadvantaged children to reflect on their own performance or behavior to contend with being evaluated negatively within or outside of school (e.g., Batruch et al., 2017), and/or introspecting about others’ mental states. We expand on these ideas below in relation to specific environmental variables.
In contrast to our findings with LFPN-DMN connectivity, we found no significant association between within-network LFPN connectivity and test performance—either in the children living below or above poverty. These results were unexpected, given prior studies reporting that connectivity within the LFPN is positively related to cognitive test performance in both adults and children (Langeslag et al., 2013; Li & Tian, 2014; Sherman et al., 2014; Song et al., 2008). For example, Sherman and colleagues found that for 10-year-olds, higher IQ was correlated with higher connectivity between the dorsolateral prefrontal cortex and the posterior parietal cortex, two hub regions of the LFPN. One reason for the non-significant effect in our study may be that we examined connectivity within the LFPN as a whole, rather than looking at particular regions or subnetworks within LFPN. Thus, the entire network might not be developed enough by ages 9 to 10 to see this relation on a global scale.
To better characterize the positive relationship between LFPN-DMN and test performance among the children living in poverty, we examined a number of demographic variables. While poverty status tends to be associated with a higher likelihood of particular experiences, such as racial or ethnic discrimination, more crowding in the home and financial strain, unsafe neighborhoods, and underfunded public schools, there is large variation in the experiences of children who live in poverty (DeJoseph et al., 2020). Moreover, experiences that are on average associated with worse cognitive outcomes (such as being deprived of caregiver support in early life) can, under some circumstances, produce better cognitive outcomes (Nweze et al., 2020), suggesting there may be different routes to achieving high cognitive performance in these cases. Thus, we predicted that differences in environmental influences among children in poverty would explain whether strong LFPN-DMN connectivity was adaptive or maladaptive for cognitive test performance.
Our analyses suggested that demographic variables could not be well fit to a pre-determined factor structure based on variables relating to the individual, home, neighborhood, and school; therefore, we took a data-driven approach to examine the effects of environmental variables. Because many of these variables are correlated with each other, we adopted an analytic approach—Ridge regression—that allows for collinearity. The results of this analysis suggested that, even within the population of children in poverty alone—children who are often conceptualized as a homogenous group—variation in their environments was predictive of their cognitive test performance. We note, however, that this was far from deterministic; a model trained on two-thirds of the children in poverty explained 6% of the variance in the held-out third, suggesting these variables accounted for a small amount of variance overall.
The most predictive variables in the model were main effects of children’s race/ethnicity, their parents’ highest level of education, and neighborhood-level characteristics such as the percent of people in their census tract who were unemployed, had not completed their high school degree by age 25, and were living in poverty. There is ample evidence that living in an under-resourced neighborhood severely restricts opportunity (Badger & Bui, 2018; Chetty et al., 2016; Neuman & Moland, 2019). Further, while both race and parental education are individual-level variables, they are also indicators of the kinds of structural barriers that children face, including access to resources and institutions, such as high-quality schools, jobs, and healthcare and stable housing in safe neighborhoods, and experiences of racism within these systems (Alexander, 2012; Chetty et al., 2018; Desmond & Kimbro, 2015; Kraus et al., 2019; Shedd, 2015). Thus, the strongest predictors of low-income children’s cognitive performance reflect structural constraints on children’s lives. However, our data also suggest that being raised by parents with strong ethnic identification may provide some psychological buffer against these and other threats, in line with other research (Cardoso & Thompson, 2010; Chen et al., 2015; Costigan et al., 2010; Simons et al., 2002; Varner et al., 2018).
In addition to these main effects, we found several interactions between environmental variables and LFPN-DMN connectivity that contributed to the model’s predictive power. Given what is known about the functions of these brain networks as well as the types of challenges that children in poverty face, we offer some hypotheses as to why stronger LFPN-DMN connectivity could be beneficial for them.
Children who attended public schools were more likely to show a positive relation between LFPN-DMN connectivity and cognitive performance. Many public schools are economically segregated, meaning that the public schools attended by children in poverty are particularly likely to be under-funded (Reardon & Owens, 2014). The constraints children face in these kinds of public schools likely require them to learn under different circumstances than in charter or private schools. For example, there are likely to be more students in a public school classroom, and therefore more potential for distraction, or less feedback provided by teachers (Horng, 2005; Orfield & Lee, 2005). Thus, children who achieve high cognitive test scores even in these environments may do so by recruiting LFPN and DMN together more frequently to engage in thought patterns like monitoring their own learning or performance.
In addition, children living in poverty who were white were more likely to show the expected pattern between LFPN-DMN connectivity and performance based on the literature, particularly compared to children who were Black, who were the next best represented in our sample. In line with the idea that Black children face disproportionate barriers to success, these children typically have to deal with a different set of daily constraints than their white peers in particular (Shedd, 2015). Indeed, rich qualitative data suggests that Black mothers are vigilant about planning for potential experiences of racism (e.g., making decisions about how to dress in order to be treated well by store clerks), and self-monitoring in these situations (Nuru-Jeter et al., 2009), both thought patterns that would likely co-activate LFPN and DMN.
Along with type of schooling and race, several neighborhood characteristics interacted with LFPN-DMN connectivity to predict children’s cognitive test performance. The safer children’s parents reported their neighborhood to be, the more negative the relation between LFPN-DMN connectivity and test performance, mirroring the average relation for higher-income children. The same pattern of results was found for children who lived in neighborhoods in which people were more likely to have plumbing or higher levels of education. The effect of neighborhood safety could be related to mentalizing about the goals and intentions of others in the service of monitoring potential threats in their environment. Of course, further research is needed to test each of these hypotheses, and they are not mutually exclusive.
While our study benefited from the ABCD dataset’s rich objective measures of the large-scale environment, there are other potential environmental and individual level variables that should be considered in future research (Pollak & Wolfe, 2020). Our research assessed only self-reported parenting styles, but there is ample evidence that more specific parenting behaviors such as language use relate to children’s cognitive development (Hart & Risley, 1995). In addition, genetic variability contributes to individual differences in brain development, cognitive test performance, and even parenting, something worth exploring in future research. Future research could also benefit from a more sensitive measure of poverty. Because the dataset did not specify which of the 19 study sites corresponded to which American city, due to concerns about confidentiality, we determined a cut-off for our poverty threshold based on cost-of-living across study sites. Because cities across the United States vary substantially in cost-of-living, we selected a stringent cutoff for the poverty line. Thus, there are almost certainly families in the above-poverty group that belong in the below-poverty group. If anything, this suggest that the use of a more sensitive measure would likely increase the group difference that we report.
Further, while we focused on three tests of non-verbal cognitive test performance, future studies should examine a broader range of cognitive systems, as these may be differentially affected by the environment (Rosen, Meltzoff, et al., 2019). For example, a systematic review of the literature suggests that experiences of threat and deprivation have distinct effects on medial and lateral prefrontal cortex development, respectively (McLaughlin et al., 2019); these effects may be mediated in part by lower-level visual and attentional processes (Rosen, Amso, et al., 2019). Clearly, there is a need for research which investigates the precise mechanisms through which the environment affects specific neural and cognitive systems. In addition, there is evidence children’s performance on cognitive tests can fluctuate from day to day for a variety of reasons (Dirk & Schmiedek, 2016; Könen et al., 2015), including motivation (Somerville & Casey, 2010), which is a likely source of noise in our models. Moreover, the cognitive tests used in the current study, while predictive of children’s later outcomes (e.g., Pagani et al., 2017), have been argued to be culturally biased (Suzuki & Aronson, 2005). Notably, our emphasis is not on overall differences cognitive test performance between groups, but rather differences in the way cognitive performance is related to brain network connectivity. Nonetheless, an important area of research is to look beyond these more canonical cognitive tasks to identify assessments or testing contexts for which children living in poverty might be particularly adapted to excel (Frankenhuis et al., 2020). Doing so might reveal that some children who underperformed on the cognitive measures in the current study have strengths in other domains as a result of adaptation to their environments.
This study opens several questions about the neural underpinnings of these findings that should be further examined. Given individual variability in network topography (Seitzman et al., 2019), future studies should examine whether this variability contributes to our findings. In addition, LFPN and DMN are both summary network measures; there could be qualitative differences in node-to-node connectivity, or smaller interactions between sub-networks, that we are not capturing in the current study (Buckner & DiNicola, 2019; Dixon et al., 2018; Fornito et al., 2012; Lopez et al., 2020). Moreover, it would be helpful to look at children’s task-based activation and functional connectivity to examine whether children in poverty are more likely to activate DMN during neutral, externally driven cognitive tasks outside of their daily environments. Finally, given that these metrics only explain a small amount of variance, it is important to look at the contribution of other neural indices of both anatomical and functional brain network connectivity. In particular, it would be interesting to test whether the group interaction could be explained by differential engagement of the cingulo-opercular (so-called “salience”) network, given theories that it is involved in coordinating the engagement of DMN and LFPN (Sridharan et al., 2008), and evidence that connectivity between the three networks changes across age (Uddin et al., 2010).
Taken together, the results of our study suggest that “optimal” patterns of brain development depend in part on the external pressures that children face. Children living in poverty did not show the expected negative relation between LFPN-DMN connectivity and test performance based on prior research in higher-income populations. Features of children’s environments helped to explain which children showed more positive versus more negative associations, suggesting that different patterns of brain development may be adaptive under different circumstances. These results go against the idea that different patterns of brain activation for children living in poverty necessarily imply a deficit (Ellwood-Lowe et al., 2016), and instead point to the ways in which children adapt to various constraints. Still, it is unclear whether patterns of brain development that appear adaptive in middle childhood will continue to be adaptive over time; an important next step will be to follow these children longitudinally to see how LFPN-DMN connectivity and its relation with cognitive test performance changes across adolescence.
Given that the structures that govern success have been largely created around the needs of middle- and upper-middle class families, understanding the strengths of families in poverty—and how children may thrive in spite of these structural barriers—is critical. Altogether, these results highlight the substantial variability of experiences of children living in poverty, who are often conceptualized as a single, homogenous group and compared to higher-SES children. Moreover, they suggest that our field’s assumptions about generalizability of brain-behavior relations are not necessarily correct. Looking beyond convenience samples of children will ultimately lend more insight into the neural underpinnings of cognition, and may show that there is not a general guiding principle about what is optimal in the ways we have thus far assumed. Not only would this advance benefit developmental cognitive neuroscience as a field, but it may ultimately allow us to better serve disadvantaged youth.
Methods
Analysis plans were pre-registered prior to data access (https://aspredicted.org/blind.php?x=3d7ry9, https://aspredicted.org/blind.php?x=tg4tg9) and analysis scripts are openly available on the Open Science Framework (https://osf.io/hs7cg/?view_only=d2acb721549d4f22b5eeea4ce51195c7). All deviations from the initial analysis plan are fully described in the Supplement.
Participants
Participants were selected from the larger, ongoing Adolescent Brain Cognitive Development (ABCD) study, which was designed to recruit a cohort of children who closely represented the United States population (http://abcdstudy.org; see Garavan et al., 2018). We planned to restrict our primary analyses to children who fell below the poverty line on the supplemental poverty measure, which takes into account regional differences in cost-of-living (L. Fox, 2017). For example, while the federal poverty level in 2018 was $25,465 for a family of four, the supplemental poverty level in Menlo Park, CA—one of the ABCD study sites—was estimated to be over $37,000 around the same time period. However, upon reviewing the data after our pre-registration, we found that study site in the ABCD data was de-identified for privacy reasons, and as a result we could not use study site-specific poverty cut-offs. Instead, we estimated each child’s poverty status based on their combined family income bracket, the number of people in their home, and the average supplemental poverty level for the study sites included in the sample.
Based on these factors, we considered children to be in poverty if they lived in families of fewer than five people and their combined family income was less than $25,000, or if they lived in families of five or more people and their combined family income was less than $35,000. We excluded children who did not provide information about family income and complete data on all three cognitive tests, and/or if their MRI data did not meet ABCD’s usability criteria (see below). In addition, due to a scanner error, we excluded post-hoc all children who were scanned on Philips scanners. This left us with 1034 children identified as likely to be living below poverty (6839 across the whole sample). Table 1 provides a breakdown of sample demographics.
Cognitive test performance
Children’s performance was measured on three non-verbal cognitive tests. Specifically, children completed two tests from the NIH Toolbox (http://www.nihtoolbox.org): Flanker, a measure of inhibitory control (Eriksen & Eriksen, 1974), and Dimensional Change Card Sort (DCCS), a measure of shifting (Zelazo et al., 2013); and the Matrix Reasoning Task from the Wechsler Intelligence Test for Children-V (WISC-V), a measure of abstract reasoning (Wechsler, 2014). More details on each of these tests and their administration in the current study is described elsewhere (Luciana et al., 2018). We created a composite measure of performance across these three domains by creating z-scores of the raw scores on each of these tests and summing them, as pre-registered; the tests were moderately correlated, 0.23 < r < 0.43, in the whole sample.
MRI Scan Procedure
Scans were typically completed on the same day as the cognitive battery, but could also be completed at a second testing session. After completing motion compliance training in a simulated scanning environment, participants first completed a structural T1-weighted scan. Next, they completed three to four five-minute resting state scans, in which they were instructed to lay with their eyes open while viewing a crosshair on the screen. The first two resting state scans were completed immediately following the T1-weighted scan; children then completed two other structural scans, followed by one or two more resting state scans, depending on the protocol at each specific study site. All scans were collected on one of three 3T scanner platforms with an adult-size head coil. Structural and functional images underwent automated quality control procedures (including detecting excessive movement and poor signal-to-noise ratios) and visual inspection and rating (for structural scans) of images for artifacts or other irregularities (described in Hagler et al., 2019); participants were excluded if they did not mean quality control criteria.
Scan parameters
Scan parameters were optimized to be compatible across scanner platforms, allowing for maximal comparability across the 19 study sites. All T1-weighted scans were collected in the axial position, with 1mm3 voxel resolution, 256 x 256 matrix, 8 degree flip angle, and 2x parallel imaging. Other scan parameters varied by scanner platform (Siemens: 176 slices, 256 x 256 FOV, 2500 ms TR, 2.88 ms TE, 1060 ms TI; Philips: 225 slices, 256 x 240 FOV, 6.31 ms TR, 2.9 ms TE, 1060 ms TI; GE: 208 slices, 256 x 256 FOV, 2500 ms TR, 2 ms TE, 1060 ms TI). All fMRI scans were collected in the axial position, with 2.4mm3 voxel resolution, 60 slices, 90 x 90 matrix, 216 x 216 FOV, 800ms TR, 30 ms TE, 52 degree flip angle, and 6 factor MultiBand Acceleration. Motion was monitored during scan acquisition using real-time procedures to adjust scanning procedures as necessary (see Casey et al., 2018).
Resting state fMRI processing
Data processing was carried out using the ABCD pipeline and carried out by the ABCD Data Analysis and Informatics Core; more details are reported by Hagler et al. (2019). Briefly, T1-weighted images were corrected for gradient nonlinearity distortion and intensity inhomogeneity, and rigidly registered to a custom atlas. They were run through FreeSurfer’s automated brain segmentation to derive white matter, ventricle, and whole brain ROIs. Resting state images were first corrected for head motion, displacement estimated from field map scans, B0 distortions, and gradient nonlinearity distortions, and registered to the structural images using mutual information. Initial scan volumes were removed, and each voxel was normalized and demeaned. Signal from motion, quadratic trends, and mean time courses of white matter, gray matter, and whole brain, plus first derivatives, were regressed out, and frames with greater than 0.3mm displacement were excluded. While the removal of whole brain signal (global signal reduction) is controversial in the context of interpreting anti-correlations (Chai et al., 2012; Murphy & Fox, 2017), we note that we are able to replicate prior studies showing that a more negative link between our networks of interest is related to test performance in our higher-income sample (see Results), lending credence to the inclusion of this step in the analysis pipeline for our purposes. The data underwent temporal bandpass filtering (0.009 – 0.08 Hz). These time courses were projected onto FreeSurfer’s cortical surface, upon which 13 functionally-defined networks (Gordon et al., 2016) were mapped and time cources for FreeSurfer’s standard cortical and subcortical ROIs extracted (Desikan et al., 2006; Fischl et al., 2002). Correlations for each pair of ROIs both within and across each of the 13 networks were calculated. These were z-transformed and averaged to calculate within-network connectivity for each network (the average correlation of each ROI pair within the network) and between-network connectivity across all networks (the average correlation of pairs of each ROI in one network with each ROI in another network). Here, we examined only within-network connectivity for LFPN and between-network LFPN-DMN connectivity.
Analysis
Analyses were performed using R version 3.6.0 (R Core Team, 2017). We performed two separate linear mixed effects models using the lme4 package (Bates et al., 2015) to test the relation between cognitive test scores and (1) LFPN-DMN connectivity, and (2) LFPN within-network connectivity. In our initial pre-registration, we did not consider the nested structure of the data or potential confounds. To determine whether to include these in our model in a data-driven fashion, we tested whether each of the following variables contributed significantly to model fit: (1) nesting within study site, (2) nesting within families, (3) child age, and (4) mean levels of motion in resting state scan. All except (2) contributed to model fit at a level of p < 0.01 and were thus retained in final models. We note that our reported results are similar when we perform simple linear regression with no covariates, exactly as pre-registered. To determine the significance of our neural connectivity metrics, we tested whether these contributed to model fit. In all cases, we compared models without the inclusion of the variable of interest to models with this variable included, and calculated whether the variable of interest contributed significantly to model fit, using the anova function for likelihood ratio test model comparison.
In our second set of analyses, we sought to explore the unexpected results from our first set of analyses by asking whether certain environmental variables determine whether LFPN-DMN connectivity is positively or negatively associated with cognitive test performance across individuals. To do this, we gathered 31 environmental variables of interest, spanning home, neighborhood, and school contexts. Upon examining the data, we learned that three of these were not collected at the baseline visit and thus could not be included. Moreover, we made the decision to include ethnicity separate from race, as it was collected, to retain maximal information. The final 29 environmental variables are listed in Table 2. In preparation for our subsequent analyses, we mean-centered and standardized these variables in the larger dataset to allow for potential comparisons across the high- and low-income children. Levels of each factor variables were broken down into separate dummy-coded variables for inclusion in factor and ridge analyses. When data were missing, they were interpolated using the mice package in R (van Buuren & Groothuis-Oudshoorn, 2011).
We first performed a confirmatory factor analysis using the lavaan package in R (Rosseel, 2012) to see whether individual and home, neighborhood, and school variables can be separated into distinct factors. If this achieved adequate fit (significantly better fit than a single factor model and CFI>9), we planned to perform a linear mixed effects model predicting cognitive test performance from an interaction between LFPN-DMN connectivity and each factor score.
We next performed a ridge regression using the glmnet package in R (Friedman et al., 2010). This analysis technique penalizes variables in a model that have little predictive power, shrinking their coefficient closer to zero, thus allowing for the inclusion of many potential predictors while reducing model complexity. These models also include a bias term, reducing the chances of overfitting to peculiarities of the data, a common pitfall of ordinary least squares regression. Finally, ridge regression also deals well with multi-collinearity in independent variables; in contrast to alternatives such as Lasso, if two variables are highly correlated and both predictive of the dependent variable, coefficients of both will be weighted more heavily in ridge.
We fit ridge regressions predicting cognitive test score residuals, which partialled out the covariates included in our basic linear mixed effects models (random intercept for study site, fixed effects for age and motion), from an interaction between LFPN-DMN connectivity and each environmental variable of interest. This analysis used nested cross-validation. Specifically, we first split the data into a training (2/3) and testing (1/3) set. We then tuned parameters of the ridge regression on the training set using 5-fold cross-validation. Ultimately, we used the best-performing model to predict cognitive test scores in the held-out testing set and assessed model fit using R2 cross-validated. An R2CV above 0 indicates that the model performed above chance; otherwise, it will be below 0. We evaluated the significance of specific variables in our model by plugging in the lambda parameter from the best-performing model to the linearRidge function in the ridge package in R (Cule & Moritz, 2019), on the whole sample of children in poverty.
Robustness analyses
We did several additional analyses to test the robustness of our results. First, we repeated our primary analyses as robust linear mixed effects models, using the robustlmm package in R (Koller, 2016). These models detect outliers or other sources of contamination in the data that may affect model validity, and performs a de-weighting procedure based on the extent of contamination introduced. These analyses are reported in the main text, and bolster our primary analyses.
Next, we performed a bootstrapping procedure intended to probe how frequently the parameter estimate observed in the children in poverty alone would be expected to be observed in a larger population of children living above poverty. In order to derive an estimate for observed parameter estimates in a population of higher-income children, we randomly sampled 500 data points from the children living above poverty, with replacement. For these 500 data points, we fit our primary linear mixed effects model to the data, predicting children’s cognitive test scores, and calculated the average parameter estimate for LFPN-DMN connectivity. We repeated this process 999 times, generating a distribution of parameter estimates likely within the larger population of higher-income children from which our participants were drawn. Next, we compared these bootstrapped parameter estimates to the parameter estimate observed for children in poverty in our sample. If the brain-behavior relation does not differ systematically as a function of poverty status—in other words, if the observed relation between LFPN-DMN connectivity and cognitive test scores for the children in poverty would be likely to be observed in a larger, population-level sample of children above poverty—the parameter estimate for children in poverty should fall within the 95% confidence interval of the bootstrapped parameter estimates.
To further confirm this dissociation, we also performed a permutation procedure to examine the extent to which the model parameters from the higher-income children alone could explain the data in the children in poverty. Briefly, we used the model parameters generated from the higher-income children to predict test performance in the children in poverty, and calculated the mean difference (observed values minus predicted values). We next randomly permuted the labels of each group, such that assignment into the higher-versus lower-income group was now arbitrary. We repeated the process above, now fitting model parameters to our arbitrary “higher-income” group and using them to predict cognitive test performance in our arbitrary “lower-income” group. Again, we calculated the mean error between observed and predicted values. This permutation and prediction procedure was repeated 999 times, generating a distribution of mean differences when the distinction between the two groups was arbitrary. If the model parameters generated from our actual higher-income group could reasonably be applied to our actual lower-income group, we would expect that the mean error would fall within the 95% confidence interval of our distribution of permuted mean errors.
Finally, given that children living in poverty had significantly more motion than children living above poverty, we repeated our primary analyses with only those children who met an extremely stringent motion threshold of 0.2mm. These results are reported in the Supplement.
Additional R packages used for data cleaning, analysis, and visualization include: dplyr (Wickham et al., 2019); ggplot2 (Wickham, 2016); car (J. Fox & Weisberg, 2011); corrplot (Wei & Simko, 2017); MuMIn (Bartoń, 2019); tidyr (Wickham & Henry, 2019); summarytools (Comtois, 2019); finalfit (Harrison et al., 2019); fastDummies (Kaplan, 2019); caret (from Jed Wing et al., 2019); scales (Wickham, 2018); foreign (R Core Team, 2018); MASS (Venables & Ripley, 2002); sjPlot (Lüdecke, 2019); tableone (Yoshida, 2019); gtools (Warnes et al., 2018).
Acknowledgements
This study would not be possible without the massive efforts of the large team of ABCD leaders and organizers, staff and data curators, and families and children who participated. Research reported in this publication also benefited from the ABCD Workshop on Brain Development and Mental Health, supported by the National Institute of Mental Health of the National Institutes of Health under Award Number R25MH120869. We are grateful to Mahesh Srinivasan for thoughtful comments on a previous draft of this manuscript, and to the members of the Building Blocks of Cognition Lab and the Language and Cognitive Development Lab for their feedback along the way. The content is solely the responsibility of the authors and does not necessarily represent the official views of the National Institutes of Health. MEL was supported by NSF GRFP DGE 1752814. SAB was supported by a Jacobs Foundation Advanced Career Research Fellowship.
References


