

Abstract
The assembly of intracellular proteins into biomolecular condensates via liquid–liquid phase separation (LLPS) has emerged as a fundamental process underlying the organisation and regulation of cellular space and function. Physicochemical characterisation of the parameters that control and modulate phase separation is therefore essential for an improved understanding of protein phase behaviour, including for the therapeutic modulation of LLPS phenomena. A fundamental measure with which to describe protein phase behaviour in chemical space is the phase diagram. Characterisation of phase diagrams requires measuring the presence or absence of the condensed phase under a multitude of conditions and, as such, is associated with significant consumption of time and sample volume even when performed in microwell format. However, due to the rapidly increasing number of biologically and disease-relevant condensate systems, experimental techniques that enable high-throughput analysis of protein phase behaviour are required. To address this challenge, we present here a combinatorial droplet microfluidic platform, termed PhaseScan, for the rapid and high-resolution acquisition of protein phase diagrams. Using this platform, we demonstrate characterisation of the phase behaviour of a pathologically relevant mutant of the protein fused in sarcoma (FUS) in a highly parallelised manner, with significantly improved assay throughput and reduced sample consumption. We demonstrate the capability of the platform by finding the phase boundary at which FUS transitions from a one-phase to a two-phase state as modulated by 1,6-hexanediol, and estimate the free-energy landscape of this system using Flory–Huggins theory. These results thus provide a basis for the rapid acquisition of phase diagrams through the application of microdroplet techniques and pave the way for a wide range of applications, enabling rapid characterisation of the effect of environmental conditions and coacervate species on the thermodynamics of phase separation.
Introduction
Many cellular proteins have the ability to demix spontaneously into a protein-rich liquid condensate phase and a protein-depleted diluted phase.1 This process, known as liquid–liquid phase separation (LLPS), has emerged as a fundamental mechanism to describe the organisation of biological matter in living cells.2 Condensates formed thorough LLPS compartmentalise cellular space,3 act as microreactors for biochemical reactions,4 and are crucial to a wide range of physiological processes.5–7 Phase separating proteins are heavily implicated in protein misfolding diseases including motor neuron disease8,9 as well as cancer pathogenesis,10 thus making them an attractive target for therapeutic intervention.11,12
Phase separation, now established for hundreds of cellular proteins,13 can be triggered by minute variations in environmental conditions such as changes in ionic strength, pH, temperature, molecular crowding, and the presence of small molecules.14–19 Because of this sensitivity to physicochemical parameters, many phase separating protein systems are currently receiving intense interest as fundamentally novel drug targets to ameliorate human diseases.20,21 However, there is currently an unmet need to quantify the physical parameters that modulate phase separation behaviour in LLPS systems with high fidelity and accuracy.14
A fundamental measure with which to describe the thermodynamics of condensate systems is the phase diagram (Figure 1).21–23 Phase diagrams powerfully summarise the phase-behaviour of LLPS systems by monitoring the position of the chemical equilibrium between the phase-separated and the mixed regimes through determination of the position of the phase boundary in chemical space. Changes in the phase boundary for an LLPS system following variation of solution conditions affords insights to the thermodynamic processes driving protein condensation and the factors that modulate them.15 As such, the generation of phase diagrams is a vital step to an understanding of protein phase-separation behaviour.

Liquid–liquid phase separation of protein solutions occurs when the free energy of the system is lowered by partition of proteins from homogeneous solution into a condensed, protein-rich phase and a dilute, protein-depleted phase. Modulators such as 1,6-hexanediol affect the protein free energy of mixing, which can cause the system to transition from the phase-separated to the homogeneous state. Csat and Cdense are the saturation concentration, corresponding to the concentration of the dilute phase, and concentration of the condensed phase, respectively.
However, given the large variety of proteins undergoing LLPS and the environmental conditions which regulate their behaviour, there is a need for experimental methods that enable rapid and high-resolution characterisation of LLPS phase diagrams. Typically, these are generated by wasteful and laborious methods involving the stepwise and manual combination of reagents to create the requisite variation in solution conditions before observation of individual conditions by microscopy. Notably, although phase diagrams are often used to probe the behaviour of LLPS systems, such experiments can only provide an extremely coarse-grained picture of the protein phase-space when conducted manually.24,25
To address this issue, we have devised here a droplet microfluidic approach, termed PhaseScan, that enables rapid, automated generation of different LLPS solution conditions for high-resolution assessment of protein LLPS behaviour. Lab-on-a-chip microfluidic systems, in particular microdroplet-based formats, offer effective means to improve assay throughput, parallelisation, and miniaturisation in biochemical experiments, and have also found recent application in the quantification of protein phase-behaviour on chip.26–28 However, no technique exists to date to generate LLPS phase diagrams with sufficient speed, throughput, and resolution.
The PhaseScan platform presented herein achieves this objective and allows for the rapid (<5 min), high-throughput, and high-resolution examination of protein LLPS phase behaviour, thereby complementing and expanding upon previous examples of microfluidic investigation of LLPS.26,29 PhaseScan utilises combinatorial droplet microfluidics to rapidly generate a large number of compartments, each of which can be considered a discrete microenvironment to study protein LLPS. By altering the input solution conditions, a broad range of phase-separation environments are produced rapidly in order to map LLPS behaviour over a wide region of chemical space.
In our proof-of-concept study, we demonstrate the acquisition of a phase diagram for the G156E mutant of the protein fused in sarcoma (FUSG156E), a protein central to the pathology of amyotrophic lateral sclerosis.9,30,31 Using our microfluidic platform, we determine the phase boundary between phase-separated and homogeneous FUS solution as modulated by the small molecule 1,6-hexanediol, which is known to strongly interfere with LLPS behaviour, and which has been employed extensively to probe LLPS systems.17
Results and Discussion
To implement our platform for high-throughput phase scanning, we first developed a microfluidic droplet generator for the microencapsulation of EGFP-tagged FUSG156E under a range of solution conditions (Figure 2a). The device functions by combining the aqueous protein mixture with an immiscible continuous oil phase at a T-junction, which results in the generation of protein-filled water-in-oil microcompartments of ∼700 pL volume. The fluorinated oil phase is supplemented with a biologically compatible polyglycerol-based triblock surfactant (see Supporting Information) to prevent droplet coalescence after generation.32 Prior to the T-junction, buffer, protein, and 1,6-hexanediol solutions are combined in different ratios (Figure 2b, see also Supporting Information) to define the range of protein and 1,6-hexanediol concentrations scanned by the microfluidic platform. Alexa647 dye (10 μM) is included in the 1,6-hexanediol solution, to provide a fluorescent barcode for the intra-droplet 1,6-hexanediol concentration, whilst the concentration of FUSG156E is reported by the intrinsic EGFP tag.

(a) Droplets are generated using a microfluidic device controlled by automated syringe pumps. Combination of aqueous droplet components prior to the droplet-generating junction (inset) enables variation in droplet solution composition. Droplets are collected off-chip, before undergoing analysis by epifluorescence microscopy. (b) Set points for FUSG156E and 1,6-hexanediol concentrations as produced by automated flow control in droplet generation (see Supporting Information). The arrow indicates the beginning of the continuous flow programme loop.
A pre-programmed syringe pump controls the input flow rates of the aqueous droplet components, enabling automated sampling of chemical space (Figure 2b). Laminar flow prevents mixing of the assay components prior to encapsulation, before rapid mixing occurs after droplet generation.33 Droplets are then collected off-chip under a layer of mineral oil to prevent evaporation. Samples were collected for three minutes, to allow time for a sufficient number of droplets across the full range of conditions to be created, before undergoing fluorescence microscopy imaging analysis (Figure 3a, see also Supporting Information).
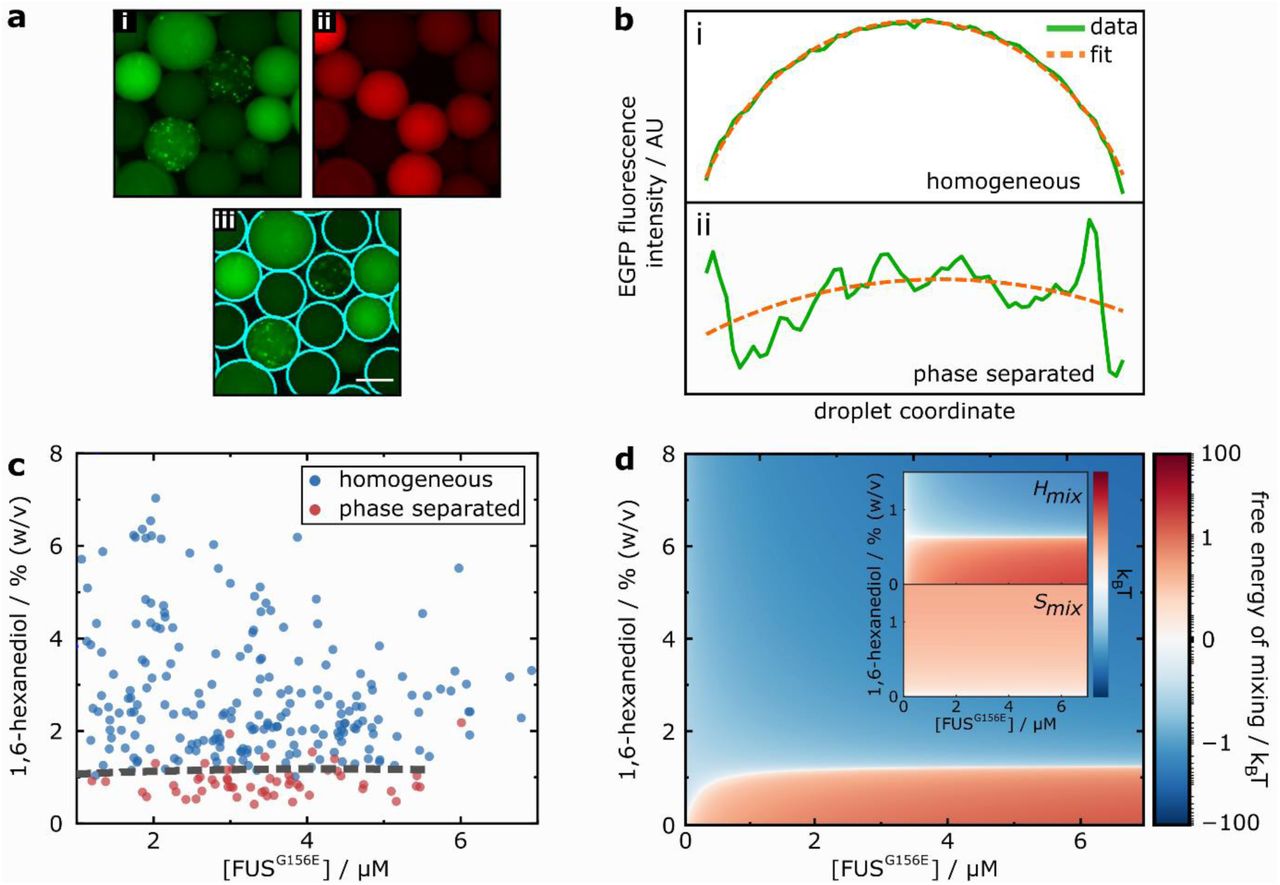
(a) Epifluorescence microscopy images of oil-in-water droplets containing various concentrations of (i) EGFP-labelled FUSG156E and (ii) 1,6-hexanediol, with the concentration of the latter indicated by fluorescence of co-encapsulated Alexa647. (iii) Output of automated droplet edge-detection. (b) Determination of the presence or absence of intra-droplet phase separation. (i) A close fit of a Gaussian curve (dashed orange lines) to a 1D-projection of droplet EGFP fluorescence (solid green lines) indicates a homogeneous droplet, whilst (ii) a poor fit indicated phase separation. (c) Phase diagram for FUSG156E as function of protein and 1,6-hexanediol concentration. Points represent measured solution conditions for individual microdroplets (N = 266), with presence or absence of phase-separation indicated by blue or red colouring, respectively. Dashed line is a fit generated by a support-vector machine algorithm for classification of the boundary between homogeneous and phase-separated droplet populations (see Supporting Information). (d) Estimate of the free-energy landscape for the FUSG156E/1,6-hexanediol system, according to the apparent phase boundary (dashed line) in (c). Free energy is reported in terms of the thermal energy kBT. (Inset) Enthalpic (Hmix) and entropic (Smix) contributions to overall free energy of mixing. Colour scale is plotted using same axis as in main figure.
To determine the concentration of FUSG156E and 1,6-hexanediol present in each droplet, as well as the presence or absence of protein phase separation, fluorescence images underwent automated image analysis using a Python script (Figure 3a,b). Droplet outlines were found by fluorescence thresholding, before the volume-normalised EGFP and Alexa647 fluorescence present in each droplet was quantified. Phase separation was determined by the presence of discrete puncta in EGFP fluorescence, corresponding to phase separated droplets, whereas homogeneous fluorescence indicated the absence of phase separation (Figure 3b).
By combining the measured concentration of droplet FUSG156E and 1,6-hexanediol concentration with the presence or absence of phase separation, a phase diagram for the FUSG156E/1,6-hexanediol system could be generated (Figure 3c). 1,6-hexanediol is known to strongly inhibit the formation of protein condensates;17 hence, as expected, phase separation was observable only at low (< 1% (v/v)) concentrations of 1,6-hexanediol, with FUSG156E exhibiting a homogeneous phase at higher alcohol concentrations. Over the FUSG156E concentrations surveyed (0.95–7.67 μM), the observed phase boundary has only a small gradient which we attribute to concomitant variation in KCl salt concentration (7–56 mM) with that of the protein, due to on-chip dilution of the protein stock solution (167 mM KCl, see Supporting Information).
With information on the phase diagram, and specifically the phase boundary between the demixed and phase-separated state, we utilised Flory–Huggins theory34–36 to extract further thermodynamic information. Flory–Huggins theory is a commonly employed lattice model for the characterisation of polymer phase behaviour, which describes the free energy of polymer mixing/demixing  according to the volume fraction (Φ) of the constituent solution components; the model is also dependent on the number of lattice sites N in which molecules are about to interact. We used a simplified three-component Flory–Huggins equation36,37 with FUS, 1,6-hexanediol (hex), and the buffer as the constituent solution components, in which each of the components have pairwise interaction parameters χ according to:

In Equation 1, the first line relates the entropic contributions to phase separation or mixing, and the second line informs on the corresponding enthalpic contributions. For lattice sites we used NFUS = 526, representing the number of amino acid residues of FUSG156E, and Nhex = 2 for each of the hydroxyl groups on the molecule. We utilised known constraints on χ-values to constrain the fit, such as χFUS, buffer > 0, since FUS is driven to phase separate when alone in buffer, and χFUS, hex, χhex, buffer < 0, as 1,6-hexanediol alone dissolves FUS and since the diol is soluble in buffer. Using this simplified three-component Flory–Huggins framework, we were able to determine an estimate for the free-energy landscape of the phase separation process (Figure 3d), and obtain estimates for the enthalpic (Hmix) and entropic (Smix) contributions to the overall free energy of mixing (Figure 3d, inset). These findings exemplify the rapid extraction of data pertaining to the thermodynamics of the LLPS system by our microfluidic platform, and we predict that measurement of mixing enthalpies and entropies in this manner will enable facile mechanistic insights into the effect of external modulators and solution conditions on phase separation behaviour.
Our approach thus enables not only determination of the position of the phase-boundary with significantly improved resolution in terms of solution conditions, relative to manual experiments, but also allows the extraction of free-energy parameters. It therefore shows great potential for in vitro characterisation of LLPS thermodynamics, and for the investigation of factors such as sequence variations and mutations, the presence of interfering small molecules, or coacervating polymers such as nucleic acids or other protein species that affect the position of phase equilibria.
Conclusion
Using our microfluidics-based combinatorial PhaseScan approach, the position of the LLPS phase-boundary for FUSG156E in the presence of 1,6-hexandiol was mapped, and a thermodynamic characterisation of the system was performed, following the generation and assay of >250 independent measurements within five minutes (3 minutes droplet generation, 2 minutes imaging time). This assay throughput is significantly greater than that achievable by manual or previously reported microfluidics experiments, with the subsequent increase in the number of data points enabling an improved fitting of the position of the protein phase boundary. Hence, the PhaseScan platform allows examination of LLPS phase behaviour with unprecedented speed and throughput.
Our study thus provides a basis for the rapid acquisition of LLPS phase diagrams through the application of microdroplet techniques. We note that with the droplet generation rate we observe here (∼30 Hz), future experiments could achieve an improved assay throughput by integrating the droplet-microscopy step with droplet generation. In addition, the droplet generation rate can be increased to improve throughput further. In this manner, it is feasible that phase diagrams can be acquired on the order of seconds, rather than minutes. We envisage that microfluidic platforms such as those presented here can find many applications in the quantitation of LLPS equilibria, such as, for example, the screening of candidate small molecules for the therapeutic modulation of phase-separation behaviour.
Conflict of interest
Parts of this work have been the subject of a patent application filed by Cambridge Enterprise Limited, a fully owned subsidiary of the University of Cambridge.
Acknowledgements
The research leading to these results has received funding from the EPSRC (award RG90413, W.E.A.), a Krishnan-Ang Studentship (R.Q.), Trinity College (Cambridge Honorary Trinity-Henry Barlow Scholarship; R.Q.), the Cambridge Trust (Honorary International Scholarship; R.Q.), the European Research Council under the European Union’s Horizon 2020 Framework Programme through the Marie Skłodowska-Curie grant MicroSPARK (agreement no. 841466; G.K.), the Herchel Smith Fund of the University of Cambridge (G.K.), the Wolfson College Junior Research Fellowship (G.K.), the Winston Churchill Foundation of the United States (T.J.W.), the Harding Distinguished Postgraduate Scholar Programme (T.J.W.) the European Research Council under the European Union’s Seventh Framework Programme (FP7/2007-2013) through the ERC grants PhysProt (agreement no. 337969; T.P.J.K.) and the Newman Foundation (T.P.J.K.).
Footnotes
Title and abstract revised
References


