

Summary
Chromosomal instability (CIN), characterized by frequent missegregation of chromosomes during mitosis, is a hallmark of tumor cells caused by changes in the dynamics and control of microtubules that comprise the mitotic spindle1–3. Thus, CIN tumor cells may respond differently than normal diploid cells to treatments that target mitotic spindle regulation. We tested this idea by inhibiting a subset of kinesin motor proteins that control spindle microtubule dynamics and mechanics but are not required for the proliferation of near-diploid cells. Our results indicate that KIF18A is required for proliferation of CIN cells derived from triple negative breast cancer or colorectal cancer tumors but not normal breast epithelial cells or near-diploid colorectal cancer cells exhibiting microsatellite instability. CIN tumor cells exhibit mitotic delays, multipolar spindles due to centrosome fragmentation, and increased cell death following inhibition of KIF18A. These mitotic defects were further enhanced by increasing the activity of the microtubule depolymerizing kinesin KIF2C/MCAK and are reminiscent of the phenotypes that result from clinically relevant doses of the chemotherapeutic drug paclitaxel4. Our results indicate that the altered spindle microtubule dynamics characteristic of CIN tumor cells can be exploited to reduce their proliferative capacity.
Introduction
Genetic instability is a common feature of tumor cells, and a large number of tumor cells exhibit frequent loss or gain of chromosomes1. This chromosomal instability (CIN) is primarily attributable to defects leading to abnormal interactions between chromosomes and mitotic spindle microtubules, which in turn increase chromosome segregation errors2,3,5–8. While CIN contributes to tumor progression, heterogeneity, drug resistance, and metastasis, it has been proposed that the same properties driving instability could provide an Achilles’ heel for CIN cell-specific targeted therapies1,9,10. Compared to chromosomally stable cells, CIN cells display increased spindle microtubule polymerization and reduced turnover of the attachments between spindle microtubules and kinetochores, which are specialized protein structures that assemble at the centromeric regions of mitotic chromosomes2,3. Thus, CIN cells may be particularly vulnerable to anti-mitotic therapies that target the microtubule cytoskeleton.
Consistent with this idea, microtubule-targeting agents are effective therapeutics for a wide variety of tumors11. Paclitaxel, a microtubule stabilizing drug routinely utilized to treat solid tumors, was originally demonstrated to induce cytotoxicity by preventing cells from completing mitosis12. However, due to adverse side effects associated with the broad inhibition of microtubule function, significant effort has been made to identify mitotic regulators that could be targeted with lower toxicity in cancer patients. While drugs targeting mitotic proteins that are required to complete cell division have shown promise in preclinical models, they have been largely unsuccessful in clinical trials13. One explanation for the apparent paradox presented by failed mitotic targeting strategies and the effective therapeutic results seen with paclitaxel is suggested by work demonstrating that clinically relevant paclitaxel doses induce abnormal, multipolar divisions in tumors, rather than preventing mitotic division altogether4,12. Thus, efforts to mimic the effects of paclitaxel on mitotic cells need to be refocused towards identifying proteins that can be targeted to disrupt normal bipolar divisions, ideally in a tumor cell specific manner.
Here, we tested the hypothesis that altered mitotic microtubule dynamics in CIN cells may confer sensitivity to inhibition of proteins that regulate microtubule dynamics or generate forces within mitotic spindles. Ideal targets would reduce CIN cell proliferation by inducing mitotic defects specifically in tumor cells. We focused our efforts on kinesin motors known to regulate spindle microtubule dynamics and mechanics that are also largely dispensable for division in diploid somatic cells.
Results
KIF18A is required for the proliferation of CIN tumor cells but not diploid cells
To compare the impacts of altered kinesin function in cells with or without CIN, we measured cell proliferation in both stable, diploid breast epithelial MCF10A cells and the chromosomally unstable triple negative breast cancer (TNBC) cell lines MDA-MB-231, MDA-MB-468, and HCC180614 following knockdown (KD) of kinesin motor proteins. Specifically, the effects of KIF18A, KIF18B, KIF4A, KIF22/KID, and KIF2C/MCAK KD were determined (Extended Data Fig 1). Cell proliferation was measured using an automated high-contrast brightfield microscopy-based kinetic assay (Extended Data Fig 2). KIF18A KD significantly reduced proliferation of all three TNBC cell lines, but did not affect the growth of diploid MCF10A cells (Fig 1 A-B). To determine if this trend holds in other tumor cell types, we measured proliferation in colorectal cancer (CRC) cells categorized as displaying either chromosomal instability (CIN) or microsatellite instability (MSI), a form of genomic instability arising from defective DNA repair in near-diploid tumor cells15. KIF18A KD significantly reduced the proliferation of two CIN cell lines but had minor effects on the proliferation of MSI cells (Fig 1C, Extended Data Fig 1). CIN cells also exhibited increased cell death following KIF18A KD, while near-diploid HCT116 and MCF10A cells did not (Extended Data Fig 3). These data suggest that, while diploid cells do not require KIF18A to proliferate, a subset of CIN tumor cells are dependent on KIF18A for efficient growth and survival.

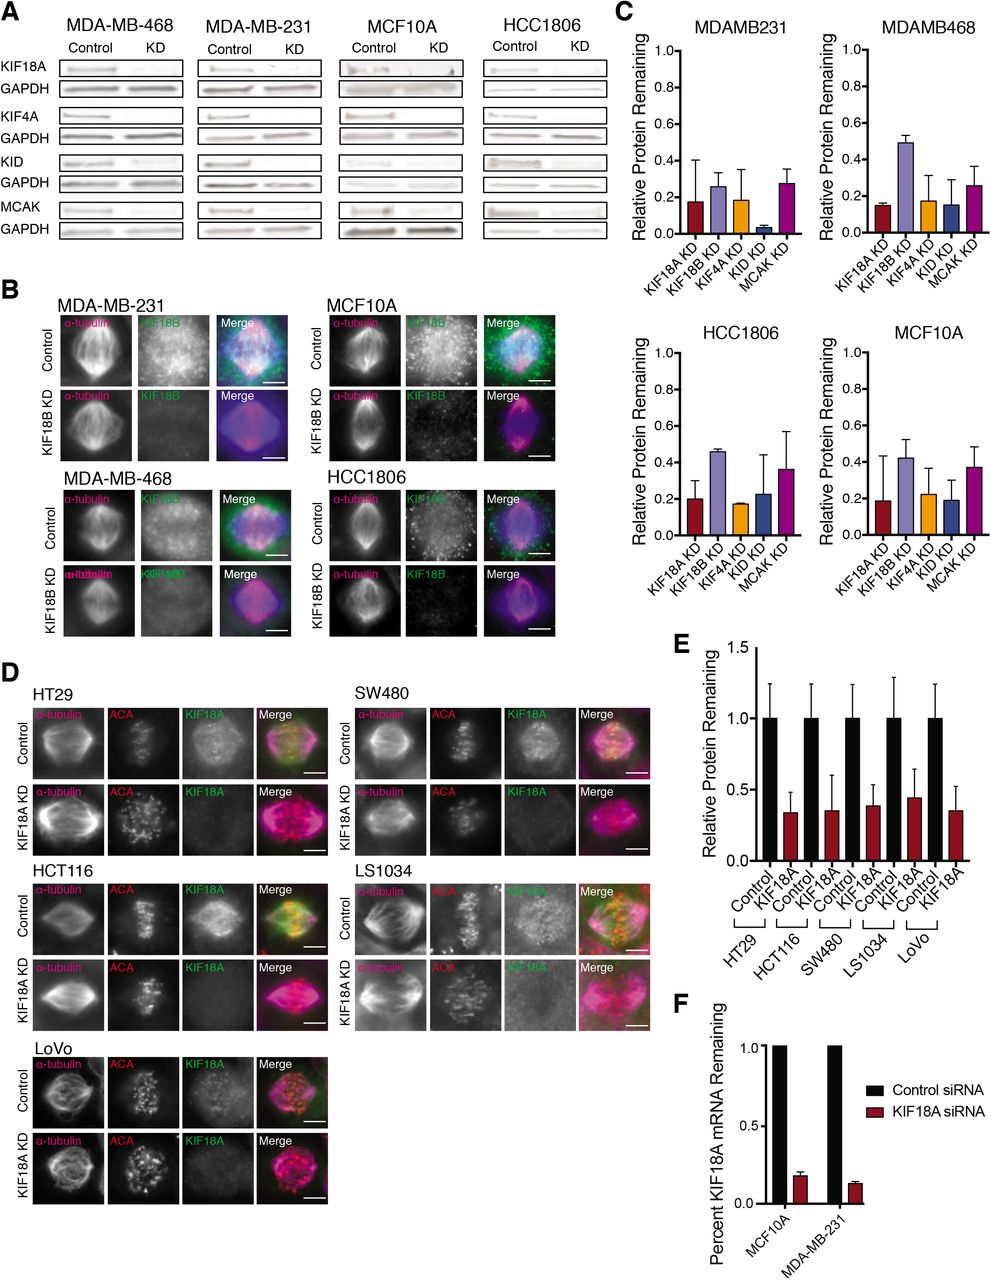
(A) Western blots showing siRNA knockdown (KD) efficiencies for the indicated kinesins in TNBC and diploid breast epithelial cells.
(B) Immunofluorescence images demonstrating efficiency of KIF18B KD in TNBC and diploid breast epithelial cells. Scale bar is 10 microns.
(C) Quantification of kinesin knockdowns in TNBC and diploid breast epithelial cells. Relative remaining protein indicates the proportion of each kinesin remaining in cells after siRNA knockdown (measured via western blot or immunofluorescence) relative to control.
(D) Immunofluorescence images demonstrating efficiency of KIF18A siRNA-mediated knockdown in CRC cell lines. Scale bar is 10 microns.
(E) Quantification of kinesin knockdowns in CRC cell lines. Relative remaining protein was measured via immunofluorescence, and all values within each cell line were normalized to control.
(F) Quantitative PCR measurements of KIF18A mRNA levels after siRNA-mediated knockdown in diploid breast epithelial cells and one TNBC cell line.
All graphs show mean +/− SD.

(A) Example trace of MDA-MD-231 cell density (cells/mm2) as a function of time over 96 hours.
(B) Representative images of HCT116 cells showing the masks created by Gen5 software for automated cell counting.
(C-D) Scatterplots of automated (C) LS1034 and (D) HCT116 cell counts using high-contrast brightfield microscopy as a function of cell counts of the same fields using a nuclear dye (Hoechst). Linear correlation indicates consistency in automated cell counting across different cell densities.

(A) Representative images of HT29 and MCF10A cells labeled with Celltox Green cytotoxicity dye five days after siRNA transfection. Scale bars are 100 microns.
(B) Relative cell death calculated as the normalized ratio of the change in Celltox-stained cell density to the change in total cell density over 96 hours. A total of at least 68 wells from three independent experiments were analyzed.
(C) Relative expression of cleaved-caspase 3 measured via Western blot for each condition. Results are from three independent experiments.
(D) Western blot showing representative cleaved-caspase 3 (CC3) expression levels.
All graphs show mean +/− SD. **** p<0.0001, *** p<0.001, ** p<0.01, * p<0.05

(A) Fold change in cell density (cells/mm2) after 96 hours in the indicated cell lines following knockdown (KD) of kinesin proteins. Data are normalized to cells treated with control siRNA.
(B) Representative images of MDA-MB-231 and MCF10A cells treated with either control or KIF18A siRNA. Scale bars are 100 microns.
(C) Normalized fold change in cell density (cells/mm2) of MSI and CIN colorectal cancer cell lines after 96 hours. At least 24 wells from three independent experiments were analyzed in A and C. All graphs show mean +/− SD. **** p<0.0001, *** p<0.001, ** p<0.01, * p<0.05
Loss of KIF18A induces prolonged mitotic delay in CIN tumor cells
KIF18A is required for chromosome alignment in all cells but also promotes spindle assembly checkpoint satisfaction and progression through mitosis in some cell types16–22. To determine if proliferation defects seen in KIF18A-depleted CIN cells are due to KIF18A’s role in promoting timely metaphase-to-anaphase transitions, we compared the effects of KIF18A KD on mitotic progression in CIN cells and near-diploid cells. KIF18A KD led to an increase in the percentage of mitotic CIN cells but did not significantly alter the percentage of mitotic cells within MCF10A or MSI CRC cell populations (Fig 2 A-C and Extended Data Fig 4). Quantification of mitotic duration revealed that all cell types displayed a significant increase in the amount of time required to progress from nuclear envelope breakdown (NEB) to anaphase onset (AO) following KIF18A KD (Fig 2 D-F). Consistent with previous work, the magnitude and variance of mitotic delays were larger in KIF18A KD CIN tumor cells than diploid (MCF10A) or near-diploid cells (HCT116) (Fig 2D)18–20,23,24. In addition, the cell types most sensitive to KIF18A KD contained a significant subpopulation of cells that failed to complete mitosis during the imaging studies and were arrested for up to 20 hours (Fig 2E). Interestingly, SW480 CIN cells did not display an increase in mitotically arrested cells and were also not dependent on KIF18A for proliferation. These data suggest that proliferation defects in KIF18A-dependent CIN cells may stem from defects that prevent subpopulations of cells from completing mitosis.

(A) Percent of cells in mitosis, as determined from fixed cell images, 48 hours after siRNA-mediated knockdown (KD) of the specified kinesins.
(B) Representative images of MDA-MB-231 cells treated with either control or KIF18A siRNA. Scale bar is 10 microns.
All graphs show mean +/− SD. **** p<0.0001, *** p<0.001, ** p<0.01, * p<0.05

(A,B) Representative images of HT29 cells (A) or HCT116 cells (B) treated with control or KIF18A siRNAs. Scale bars are 10 microns.
(C) Percentage of mitotic cells (mitotic index) observed in fixed populations of control or KIF18A siRNA-treated CRC cells. At least 60 fields from three independent experiments were analyzed per condition.
(D) Time between nuclear envelope breakdown (NEB) and anaphase onset (AO) in control or KIF18A siRNA-treated cells. At least 150 cells from three independent experiments were analyzed per condition.
(E) Percentage of control or KIF18A siRNA-treated cells that entered mitosis at least 200 minutes before the end of the movie but did not divide.
(F) Frames from DIC live cell imaging of HT29 and MCF10A cells treated with control or KIF18A siRNA, showing progression from NEB to AO. Scale bars are 5 microns.
All graphs show mean +/− SD. **** p<0.0001, *** p<0.001, ** p<0.01, * p<0.05
KIF18A-dependent CIN cells form multipolar spindles
Analyses of mitotic spindles in KIF18A KD cells revealed that KIF18A-dependent CIN lines display a significant increase in multipolar spindles compared to non-KIF18A-dependent cell lines (Fig 3 A-B). Interestingly, the fold-increase in multipolar spindles following KIF18A KD was inversely proportional to the fold-decrease in proliferation for each cell type (Fig 3C). These data indicate that mitotic spindle assembly is abnormal in KIF18A-dependent CIN cells.

(A) Representative images of MDA-MB-231 cells treated with either control (top) or KIF18A (bottom) siRNA. Pericentriolar material (γ-tubulin) is numbered to show poles with and without centrioles (centrin-1). Scale bars are 10 microns.
(B) Percent of mitotic cells with multipolar spindles from fixed cell images of each indicated cell line treated with either control or KIF18A siRNA.
(C) Plot of multipolar spindle percentage as a function of fold-change (FC) in cell number for the indicated cell lines following KIF18A KD. R-squared value is 0.84 using a linear regression model.
(D) Representative Images of MDA-MB-231 cell with a third pole lacking centrin-1. Scale bar is 10 microns.
(E) Percent of multipolar MDA-MB-231 cells in mitosis with fragmented pericentriolar material (PCM), as indicated by the presence of γ-tubulin puncta lacking centrin-1 puncta.
(F) Intercentriolar distance measurements (in microns) for MDA-MB-231 cells in each indicated category.
(G) Representative still frames of a live MDA-MB-231 KIF18A KD cell labeled with siR-tubulin. Arrows indicate pole splitting and separation.
(H, I) Percent of live, siR-tubulin labeled MDA-MB-231 cells that (H) enter mitosis with more than two spindle poles or (I) split and separate spindle poles during mitosis.
All graphs show mean +/− SD. **** p<0.0001, *** p<0.001, ** p<0.01, * p<0.05
Loss of KIF18A function could lead to multipolar spindles by promoting centrosome amplification, cytokinesis failure, centriole disengagement, or pericentriolar material (PCM) fragmentation25. To distinguish among these mechanisms, we analyzed the number and organization of centrioles within multipolar spindles in MDA-MB-231 cells (Fig 3 D-F). The majority of spindles (~75%) in both control and KIF18A KD cells contained four centrioles, indicating that centrosome amplification and cytokinesis failure do not significantly contribute to spindle defects in KIF18A KD cells. The distance between paired centrioles was increased in multipolar KIF18A KD cells compared to those in bipolar spindles but was comparable to that measured in multipolar spindles treated with control siRNA (Fig 3F). However, ~60% of multipolar KIF18A KD cells exhibited γ-tubulin containing microtubule organizing centers without centrioles (Fig 3E). Furthermore, live imaging of KIF18A-depleted MDA-MB-231 cells labeled with siR-tubulin revealed an increase in spindle pole fragmentation events but not the number of cells entering mitosis with multiple poles compared to control siRNA treated cells (Fig 3 G-I and Supplementary Videos 1-3. These data suggest that KIF18A KD primarily leads to multipolar spindles by inducing PCM fragmentation.
KIF18A KD induces multipolar spindles in CIN cells independently of mitotic delay
The fragmentation of centrosomes and formation of multipolar spindles following KIF18A KD could result from abnormal spindle forces caused by altered microtubule dynamics or as a secondary effect of an extended mitotic delay25. To determine if a mitotic delay is required for multipolar spindle formation following KIF18A KD, we analyzed spindle morphology in MDA-MB-231 cells depleted of both KIF18A and MAD2, which is required for spindle assembly checkpoint-dependent mitotic arrest26. KIF18A/MAD2 KD cells displayed a reduced mitotic index but a similar level of multipolar spindles compared to KIF18A KD cells (Extended Data Fig 5 A-B). Spindle pole splitting in live cells occurred at a range of times after mitotic entry in KIF18A KD cells and at times shortly after NEB in KIF18A/MAD2 KD cells (Extended Data Fig 5 C-E and Supplementary Video 4). The significant decrease in multipolar KIF18A/ MAD2 KD cells compared to KIF18A KD alone observed during live imaging may be explained by the limitations inherent to the identification of multipolar spindles in live assays, as poles must split sufficiently far apart to be completely separated in this case. Therefore, the live approach is likely to underestimate the actual time to splitting and percentage of multipolar spindles, especially in cells that exit mitosis quickly. Taken together, these data suggest that loss of KIF18A leads to spindle pole fragmentation in CIN cells and that this defect does not require, but may be enhanced by, a mitotic delay.

(A-B) Percent of fixed MDA-MB-231 cells (A) in mitosis or (B) with multipolar spindles after the indicated siRNA KD. Results are from three independent experiments.
(C-D) Percent of live, siR-tubulin labeled MDA-MD-231 cells that (C) split poles during mitosis or (D) entered mitosis with more than two spindle poles. Results are from two independent experiments.
(E) Stacked histogram showing relative frequencies of the duration of time between NEB and pole splitting for siR-tubulin labeled MDA-MB-231 cells following KIF18A KD or KIF18A/MAD2 KD.
(F) Western blots depicting the amount of each specified protein remaining after treatment with either a double dose of control siRNA or a combination of KIF18A and MAD2 siRNA. All graphs show mean +/− SD. **** p<0.0001, *** p<0.001, ** p<0.01, * p<0.05
CIN cells display increased sensitivity for KIF18A KD over diploid cells as compared to paclitaxel
The mitotic delay and multipolar spindles caused by KIF18A KD in some tumor cells are similar to those observed following treatment with clinically relevant doses of paclitaxel4. This is somewhat unexpected, as the two treatments have opposite effects on spindle microtubules. Microtubules grow faster and longer in the absence of KIF18A’s microtubule growth suppressing function, while paclitaxel stabilizes microtubules and slows dynamic instability27–29. Interestingly, we found that KIF18A KD and 10 nM paclitaxel produced similar mitotic defects in MDA-MB-231 cells, but only paclitaxel increased the mitotic index and multipolar spindles in diploid MCF10A cells (Extended Data Fig 6). These data suggest that CIN tumor cells may be particularly sensitive to the increased microtubule dynamics that occur following KIF18A loss of function, while diploid cells are minimally affected by this change.

(A) Percentage of mitotic cells with multipolar spindles in fixed MDA-MB-231 or MCF10A cells treated with control siRNAs, KIF18A siRNAs, 10 nM paclitaxel, or DMSO.
(B) Percentage of fixed MDA-MB-231 and MCF10A cells in mitosis following treatment with control siRNAs, KIF18A siRNAs, 10 nM paclitaxel, or DMSO.
All graphs show mean +/− SD. **** p<0.0001, *** p<0.001, ** p<0.01, * p<0.05
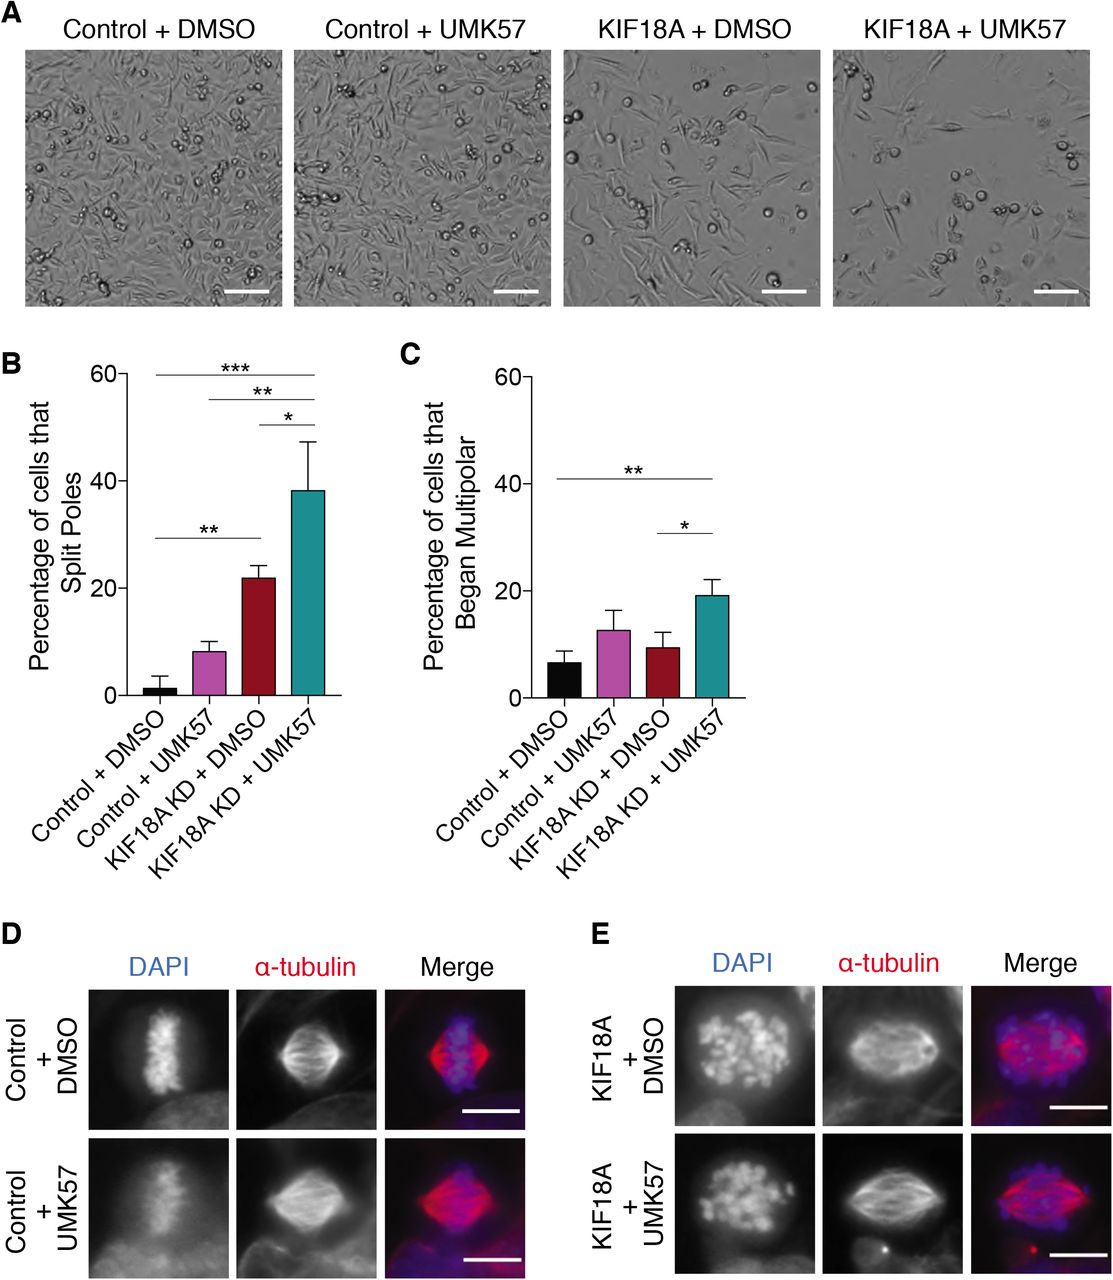
The CIN cell-specific effects of KIF18A KD are enhanced by a small molecule activator for microtubule depolymerization
KIF18A suppresses the dynamics of kinetochore microtubules to promote chromosome alignment and decreases kinetochore microtubule turnover17,30. Increased kinetochore microtubule turnover may contribute to the prolonged mitotic delays and destabilized spindles observed in KIF18A KD CIN cells. We tested this by treating cells with a small molecule (UMK57) that promotes kinetochore microtubule turnover by increasing the activity of the depolymerizing kinesin MCAK31. Treatment of KIF18A-depleted MDA-MB-231 cells with UMK57 (500 nM) decreased proliferation and increased both the mitotic index and percentage of multipolar spindles beyond what is seen in KIF18A KD cells treated with DMSO (Fig 4 A-C and Extended Data Fig 7A). The same concentration of UMK57 had no impact on the proliferation of control siRNA-treated cells (Fig 4 A-C). Furthermore, live cell imaging of siR-tubulin showed that KIF18A KD cells treated with UMK57 displayed increased spindle pole splitting without an obvious change in chromosome alignment defects in bipolar spindles (Extended Data Fig 7 B-E and Supplementary Video 5). These data indicate that loss of KIF18A function and increased MCAK function synergistically disrupt mitotic progression and spindle bipolarity in CIN cells.

(A) Representative images of cell density 96 hours after the start of high-contrast brightfield imaging. Cells were treated with either control or KIF18A siRNA in combination with 500 nM UMK57 or DMSO. Scale bar is 100 microns.
(B-C) Percent of live, siR-tubulin labeled MDA-MB-231 cells that (B) split poles or (C) entered mitosis with more than two spindle poles after the indicated treatments.
(D) Representative immunofluorescence images of mitotic MDA-MB-231 cells treated with either control or KIF18A siRNA in combination with either 500 nM UMK57 or DMSO. Scale bars are 10 microns.

(A) Fold change in cell density after 96 hours in MDA-MB-231 cells treated with the specified siRNAs and either 500 nM UMK57 or DMSO.
(B,C) Percent of total mitotic cells (B) and mitotic cells with multipolar spindles (C) in fixed populations after the indicated treatment. At least 60 fields from three independent experiments were analyzed per condition. All graphs show mean +/− SD. **** p<0.0001, *** p<0.001, ** p<0.01, * p<0.05
Discussion
Our data support a model in which the altered microtubule dynamics in mitotic CIN cells make them particularly dependent on KIF18A to reduce kinetochore microtubule turnover, which in turn is required to maintain spindle bipolarity and promote mitotic progression. Importantly, we find that KIF18A is not required for mitosis or proliferation of near-diploid cells. These results are consistent with previous observations that loss of KIF18A leads to spindle assembly checkpoint-dependent delays in cancer cells but not in diploid somatic cells16,18–22. KIF18A is also largely dispensable for proliferation of diploid somatic cells in vivo but is necessary for tumor growth. Kif18a mutant mice display an early growth delay and germline development defects but are viable18,32. However, the growth of both induced CRC and xenografted TNBC tumors in mouse models are dependent on KIF18A33,34. Thus, KIF18A may be an effective target to specifically inhibit the growth of CIN tumor cells, while inducing relatively low toxicity in somatic, diploid cells.
These data raise the important question of why CIN cells would depend more on KIF18A for successful mitosis than normal cells. CIN cells exhibit increased rates of spindle microtubule polymerization and altered turnover of kinetochore microtubules2,3, which may confer an enhanced dependence on KIF18A’s function to suppress the growth of kinetochore microtubules. Our results suggest that in the absence of KIF18A activity, maintenance of kinetochore microtubule attachments and the balance of forces within the spindle are defective in CIN cells, subsequently leading to mitotic arrest and centrosome fragmentation. Previous observations that KIF18A reduces the turnover of microtubules from kinetochores and is required to generate tension between paired kinetochores are consistent with this interpretation16,17,30,35. In addition, KIF18A KD cells that do complete mitosis form micronuclei as a result of chromosome alignment defects19. The frequency of micronucleus formation in KIF18A-depleted cells is enhanced by elevated chromosome number, and therefore, could also contribute to the specific reduction in proliferation observed in aneuploid cells (Quinton et al., in preparation).
Our tests of the effects of other kinesins that control spindle microtubule dynamics and chromosome movements suggest the specific dependence of CIN cells on KIF18A is unique among mitotic kinesins. Other mitotic kinesins are either not required for division of CIN cells or are required for division of both diploid and CIN cells. In agreement, two recent, large-scale bioinformatics studies identified Kif18A, but not other kinesins, as a gene specifically required for the growth of aneuploid cells (Quinton et al., in preparation and Cohen-Sharrir et al., in preparation). These data indicate the broad implications of our results and strongly support further investigation into therapeutically relevant mitotic vulnerabilities specific to CIN tumor cells.
Supplementary Videos
Supplementary Video 1. Representative time-lapse movie of bipolar division in a siR-tubulin labeled MDA-MB-231 cell treated with control siRNA. Images were acquired every 2 min and are played back at 7 frames per second.
Supplementary Video 2. Representative time-lapse movie of spindle pole splitting in a siR-tubulin labeled MDA-MB-231 cell treated with KIF18A siRNA. Images were acquired every 2 min and are played back at 7 frames per second.
Supplementary Video 3. Representative time-lapse movie of a siR-tubulin labeled MDA-MB-231 cell treated with KIF18A siRNA entering mitosis with multiple spindle poles. Images were acquired every 2 min and are played back at 7 frames per second.
Supplementary Video 4. Representative time-lapse movie of spindle pole splitting in a siR-tubulin labeled MDA-MB-231 cell treated with KIF18A and MAD2 siRNAs. Images were acquired every 2 min and are played back at 7 frames per second.
Supplementary Video 5. Representative time-lapse movie of spindle pole splitting in a siR-tubulin labeled MDA-MB-231 cell treated with KIF18A siRNA and 500 nM UMK57. Images were acquired every 2 min and are played back at 7 frames per second.
Methods
Cell Culture and Transfections
HT29, LoVo, SW480, LS1034, HCC1806, HCT116, MCF10A, MDA-MB-231, and MDA-MB-468 cells were purchased from ATCC. All cell lines were validated by STR DNA fingerprinting using the Promega GenePrint® 10 System according to manufacturer’s instructions (Promega #B9510). HT29, LoVo, SW480, MDA-MB-231, and MDA-MB-468 cells were cultured in DMEM/F-12 medium (Gibco) supplemented with 10% FBS (Gibco) and 1% penicillin/streptomycin (pen/strep). LS1034 and HCC1806 cells were cultured in RPMI 1640 medium (Gibco) with 10% FBS and 1% pen/strep. HCT116 cells were cultured in McCoys 5A media (Gibco) with 10% FBS and 1% pen/strep, and MCF10A cells were cultured in DMEM/F-12 supplemented with 5% horse serum (Gibco), 20ng/ml epidermal growth factor, 0.5 μg/ml hydrocortisone, 100 ng/ml cholera toxin, 10 μg/ml insulin, and 1% pen/strep. To inhibit specific kinesins, cells were treated with 5 pmol siRNA with Lipofectamine RNAiMAX Transfection Reagent (Invitrogen) in Opti-MEM Reduced-Serum Media (Gibco). Specific siRNAs include pools of Silencer and Silencer Select KIF18A (Invitrogen), KIF18B (Dharmacon), KIF4A (Invitrogen), KID/KIF22 (Invitrogen), MCAK/KIFf2C (Dharmacon), MAD2 (Invitrogen), and pools of scrambled-sequence negative control siRNAs (Invitrogen). For double knockdowns involving the inhibition of two proteins, Lipofectamine RNAiMAX was used at a lowered concentration (0.7X the concentration used for single knockdowns) to mitigate toxicity.
Proliferation and Cytotoxicity Assays
Cells were imaged in either a 96-or 24-well dish every two or four hours for up to five days using the Cytation 5 Cell Imaging Multi-Mode Reader (Biotek) driven by Gen5 software (Biotek). A 4X Plan Fluorite 0.13 NA objective (Olympus) was used to capture images. Between imaging reads, cells were incubated at 37°C with 5% CO2 using the Biospa 8 Automated Incubator (Biotek). Gen5 software (Biotek) was used to process images and to measure cell confluence and the number of cells/mm2 using high-contrast brightfield images. Parameters including cell size and light-intensity thresholds were specified for each cell line. To determine rates of cell proliferation, the fold change in cells/mm2 between the first and last reads of each well were calculated and normalized to the control for each experiment. One-way ANOVA with post-hoc Tukey’s test was used to compare proliferation fold-change values across cell lines to determine statistical significance. For cytotoxicity assays, CellTox™ Green Dye (Promega) was added to cell media prior to imaging, and the number of cells/mm2 was recorded for both GFP and brightfield channels. After four days of imaging, the area under the proliferation curve for the CellTox-stained cells was divided by the area under the proliferation curve for the total number of cells, and this value was normalized to the control for each cell line as the metric for relative cell death. An unpaired t-test was used to determine significance between control and KIF18A KD for each cell line.
Automated Cell Count Validation
Cells were seeded in a series of increasing densities in either a 96- or 24-well dish and allowed to adhere for 24 hours. Cells were then incubated with Hoechst stain (Invitrogen), a cell-permeable nuclear dye, for 30 minutes before being imaged using the_Cytation 5 system as described previously. For each field, one high-contrast brightfield image and one fluorescence image were acquired, and Gen5 software was used to process images and analyze the number of cells/mm2 using the parameters defined in the proliferation assays. The correlation between cell densities measured in the brightfield images and the fluorescence images was graphed as a scatterplot (Extended Data Fig 2).
Immunofluorescence
Cells were grown on glass coverslips and fixed using either −20°C methanol or 1% paraformaldehyde in −20°C methanol. Cells were blocked with 20% goat serum in antibody diluting buffer (Abdil-TBS, 1% BSA, 0.1% Triton X-100, and 0.1% sodium azide) and incubated with the following primary antibodies: mouse anti-a-tubulin (DM1a) 1:500 (Millipore Sigma) for one hour at room temperature (RT), human anti-centromere antibody (ACA) 1:250 (Antibodies Incorporated) overnight at 4°C, rabbit anti-γ-tubulin 1:500 (Abcam) for one hour at RT, mouse anti-γ-tubulin 1:500 for one hour at RT (Abcam), rabbit anti-KIF18A 1:100 (Bethyl Laboratories) at 4°C overnight, mouse anti-centrin-1 1:500 (Santa Cruz Biotechnology) for one hour at RT, and rabbit KIF18B 1:200036 for one hour at RT. Secondary antibodies conjugated to Alexa Fluor 488, 594, and 647 (Molecular Probes) were used at concentrations of 1:15000 for one hour at RT. Coverslips were mounted onto glass slides using Prolong Gold anti-fade mounting medium with DAPI (Molecular Probes).
Microscopy
Fixed and live cell images were acquired using a Ti-E or Ti-2E inverted microscope (Nikon Instruments) driven by NIS Elements software (Nikon Instruments). Images were captured using a Clara cooled charge-coupled device (CCD) camera (Andor) or Prime Bsi sCMOS camera (Teledyne Photometrics) with a Spectra-X light engine (Lumencore). For live-cell imaging, cells in CO2-independent media (Gibco) were imaged using Nikon objectives Plan Apo 20X 0.75 NA or 40X 0.95 NA and an environmental chamber at 37°C. Fixed cell images were taken using Plan Apo 40X 0.95 NA, Plan Apo λ 60× 1.42 NA, and APO 100× 1.49 NA (Nikon).
Western Blot
Cells were lysed in PHEM lysis buffer (60 mM Pipes, 10 mM EGTA, 4mM MgCl2, and 25 mM Hepes) with 1% Triton X-100 and protease inhibitors, incubated on ice for 10 minutes, and centrifuged at maximum speed for 5 minutes. Laemmli buffer with ß-mercaptoethanol was added to the supernatant prior to boiling for 10 minutes at 95°C. Lysates were run on 4-15% gradient gels (BioRad), transferred (75 minutes at 100V) to PVDF membrane (BioRad), and blocked for one hour in 1:1 Odyssey Blocking Buffer (Li-Cor) and TBS with 0.1% Tween-20. Membranes were incubated with primary antibodies overnight at 4°C. Primary antibodies included 1:1000 mouse anti-GAPDH (Invitrogen), 1:500 rabbit anti-KIF18A (Bethyl Laboratories), 1:1000 rabbit anti-Kif4A (Bethyl Laboratories), 1:1000 rabbit anti-KIF22 (Millipore Sigma), 1:1000 rabbit anti-MCAK (Abcam), 1:1000 rabbit anti-MAD2 (Bethyl Laboratories), and 1:1000 rabbit anti-Cleaved Caspase-3 (Cell Signaling Technology). Secondary antibodies included goat anti-Rabbit IgG DyLight 800 conjugate and goat anti-mouse IgG DyLight 680 (Invitrogen), which were each diluted to 1:15000 in 1:1 Odyssey blocking buffer/TBS and added to the membrane for one hour at room temperature. Membranes were imaged using an Odyssey CLx (Li-Cor).
Live Imaging with siR-tubulin
Cells were plated in a glass-bottom 24-well dish and treated with the indicated siRNA approximately 24 hours before imaging. Six hours before imaging, the cell culture media was replaced with CO2-independent media containing 100μM SiR-tubulin (Cytoskeleton). For conditions involving UMK57 or DMSO, the specified drug was added to the CO2-independent media with siR-tubulin. Cells were imaged every 2 minutes for 16-20 hours using a 40X 0.75 NA objective (Nikon).
Mitotic Timing and Mitotic Index Analyses
To measure the length of mitosis, live cells were imaged every two minutes for 16-20 hours using differential interference contrast (DIC) microscopy. The time between nuclear envelope breakdown (NEB) and anaphase onset (AO) was used to indicate the time a cell spent in mitosis. Mitotic index was measured using fixed-cell images by counting the number of mitotic cells divided by the total number of cells. All mitotic index fields were taken with a 40x objective. An unpaired t-test was used to determine statistical significance between control and KIF18A KD conditions for each cell line.
Mitotic Spindle Morphology Analyses
To analyze mitotic spindle morphology, cells were fixed and stained for γ-tubulin, a-tubulin, and centrin-1. Enough optical slices spaced 200 nm apart were captured to visualize the entire 3-D structure of the spindle. Spindles with three or more visible microtubule-organizing centers were classified as multipolar. Cells were considered to have fragmented pericentriolar material (PCM) if they had supernumerary poles observed via γ-tubulin staining but lacked centrioles (centrin-1 puncta) at one or more of the poles. Intercentriolar distance, or the distance in microns between two centrioles in a pair, was measured from the center of one centriole to the center of the adjacent centriole.
Knockdown Quantification Analysis
The efficiency of siRNA-mediated kinesin knockdowns was measured via either quantitative western blot or immunofluorescence. ImageJ was used for all quantification.
KIF18A knockdown efficiency in CRC cell lines was measured by comparing background-subtracted KIF18A fluorescence intensity in cells treated with control or KIF18A siRNA. In TNBC cell lines, KIF18B knockdown efficiency was measured by comparing background-subtracted KIF18B fluorescence intensity in cells treated with control or KIF18B siRNA. All other knockdown quantifications were determined by Western blot analysis. For MCF10A and MDA-MB-231 cell lines, the KIF18A knockdown efficiency was further analyzed at the RNA level by qRT-PCR.
qRT-PCR
Total RNA extraction was carried out using RNeasy Mini Kit (Qiagen). Extracted RNA was screened by the Vermont Integrative Genomics Resource (VIGR) DNA Facility for purity and integrity using a 2100 Bioanalyzer (Agilent Technologies), and human GAPDH and human KIF18A Taqman probes and primers (Thermo Fisher Scientific) were used for reverse transcription and qRT-PCR. KIF18A RNA expression levels were normalized to GAPDH RNA levels in each cell line.
Acknowledgements
The authors wish to thank Dr. Carol Vallett, Dr. Marion Thurnauer, Dr. Marie Wood, and Dr. Christopher Anker for insightful discussions and suggestions. We also thank Dr. Uri Ben-David and Dr. Neil Ganem for sharing unpublished results. This work was supported by Susan G Komen grant CCR16377648, NIH grant GM121491, American Cancer Society Institutional Research Grant 14-196-01, and a Lake Champlain Cancer Research Organization pilot grant (to JS) and by Department of Defense PRCRP Horizon Award W81XWH-17-1-0371 (to HM). The authors declare no competing financial interests.
References


